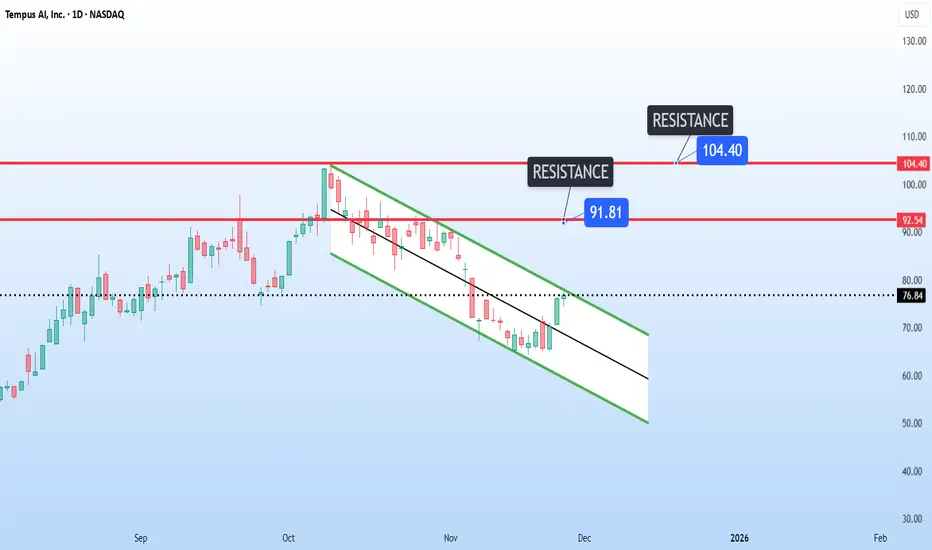
Tempus AI Potential Breakout of ChannelTempus AI NASDAQ:TEM is showing a text-book breakout setup on the daily chart.
It is hovering right at the top of the descending channel at 76, putting pressure on the trendline for a potential breakout.
The next key resistance levels could be at 91 and 104.
Trade ideas
TEM eyes on $71.94: Break-n-Retest should mark a BOTTOMTEM has been retracing with all other AI stocks.
Now testing a Semi-Major Genesis fib at $71.94
Look for a Break-n-Retest to enter longs or to add.

Tempus AI — Is This Where Time Turns Bullish Again?Fundamental View
Tempus AI (NASDAQ: TEMP) continues to attract attention with major partnerships in the AI and biotech space — including collaborations with AstraZeneca, Illumina, and Boehringer Ingelheim.
These deals strengthen its role in using AI for diagnostics and drug development, giving it strong long-term growth potential.
However, as a newly listed and high-growth company, short-term volatility remains likely.
Technical View
Price has made a sharp retracement into the golden OTE zone ($72–$63), overlapping a high-probability Fair Value Gap (FVG) and the weekly bullish Order Block (OB).
This zone represents a key area of interest where smart money could accumulate.
Safer traders will wait for confirmation signals within this zone, while aggressive entries could scale in early with managed risk.
Upside targets are $103 for partial profit and $155 for a full swing continuation.
Outlook
Tempus sits at a critical turning point — strong fundamentals meet a high-probability technical setup.
If the golden zone holds, a bullish reversal could unfold toward major liquidity levels.
Patience and confirmation remain key before full commitment.
⚠️ Disclaimer: This breakdown is for educational and entertainment purposes only. It is not financial advice — always DYOR and trade responsibly.

Put sale on TEMStrong stock. Innovative space. Buy low, sell high? $1.30
:-)
Around the 200 sma. 2 1/2 weeks is bread and butter. And getting stocks down there, I would be pleased.

TEM - Tempus AI - Pull-back to previous HighGood Evening everyone, followers,
This is the last one that i added to my follow-up list for next week.
Tempus AI – Quick Company Info
What they do
Tempus AI is a precision medicine / biotech / AI company. It offers genomic testing, diagnostics, and AI-enabled data & services, leveraging large clinical, molecular and imaging datasets to support patient care, clinical research, and drug development.
Latest Commercial / Strategic Agreements
- A multi-year strategic collaboration with AstraZeneca and Pathos AI to build a multimodal foundation model in oncology. Part of this agreement includes ~$200 million in data licensing + model development fees to Tempus.
- Joint venture with SoftBank Group (Japan) via Pegasos Corp. to provide Tempus’ sequencing and real-world patient data services in Japan.
Financial Snapshot & Key Metrics:
Market Cap : Roughly US$ 15.5 billion
Revenue (TTM) : ~ US$ 951.98 million ending ~ June 30, 2025; YoY growth ~ +60%
Revenue (FY 2024): ~$693.4 million, ~30.4% growth vs 2023
Q2 2025 Revenue : ~$314.6 million, up ~90% YoY
EPS : -1.1843
P/E : -81.39
They are growing AI Company therefore investing more many to their R&D researches and developments. Therefore they are in my radar for future as emerging tech stock.
Technical Part:
After it broke to down trade to up , it performed very well and gained approx %50 within 2 months , not bad.
Last week Wednesday it broke the previous high level which is also ATH level and then hit to resistance level which is 101.50 - 60 . With Trump Tariffs announcement now it was declined and now i am expection to re-test 91.50 area which could be really healthy move for future moves. I could consider this as Re-test old resistance new support level.
I see potentiol to hit 120 before end of the year. If it will decide to touch 91.50 then this level is quite good level to invest TEM. Maybe it could a try to go a bit down 88.50.
So between 88.50 to 91.50 is a good levels to buy it.
My expected move , you can see as yellow, it made the same moves before, so yellow patter will be the second wave.
All other support and resistance levels you can see in chart as FIB levels.
I am seeing good opportunity on this company and i beleive in the correct price level it worth investing. I believe with a patience for a long time , we can earn good amount of money on TEM.
This is just my thinking and it is not invesment suggestion , please do not make any decision with my anaylsis.
Have a good evening and good start a Week
Now it is time to watch DART World Grand Prix Final between 2 Lukes ;)

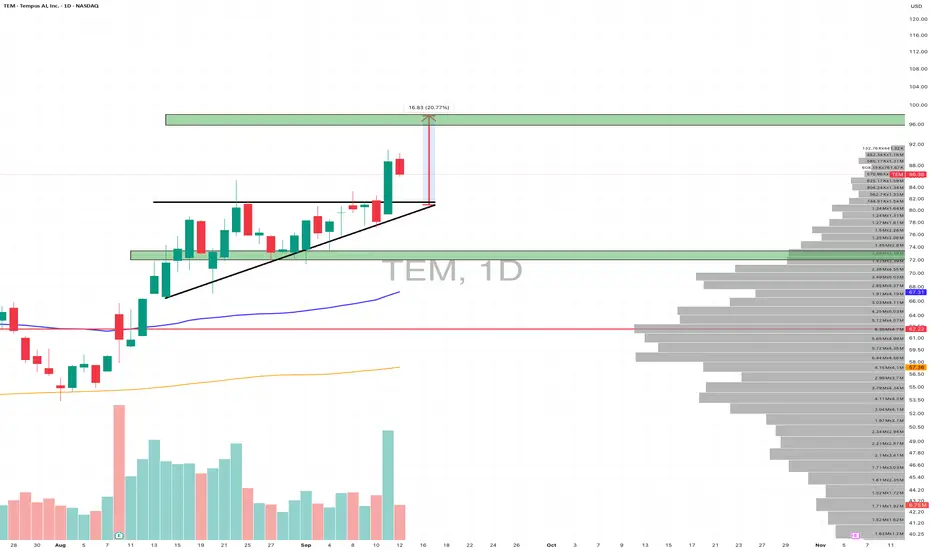
$TEM : The Price Action Says It All!
The complex structure has completed at $74.65. What followed was nothing short of explosive rally. 🚀... The chart highlights the projected targets!
*The complex trading structure is explained in the chart!
Happy Trading! 😊

TEM clean triangle Breakout on D/WGreat Earnings and clean technical setup (triangle) and Weekly BO from $75 next week !
Consolidation is complete from the 1 year base here and we are above the Volume shelf for that entire consolidation period.
No baggies in this one and smart money looks ready to take it up.
I dont mind a retest in the next few weeks for the $70 as the EMAs catch up as it pushes next few weeks.
Taking 60% off at $90 (previous ATH)
taking 30% at $100 (Psych level)
10% runners come off at break of 21ema
Keeping HARD SL at VRVP $61.83 but will surely cut early if Key levels $68.58 break and enters back in triangle.
Its a easy 3R trade here. keep it simple and honor the stops no matter what happens !
I am not an investor, I am a swing trader, dont care if it goes to moon, i will be 90% out at 100 and/or 1R loss. Period !

Tem
Key Levels (Visually from Chart)
| Level | Meaning
| -------- | -------------------------------------------------------------
| 🔴 77.30 | Resistance — short-term pivot (tested, price rejected
| 🟩 76.60 | Critical support — neckline of double top
| 🟡 75.39 | First bearish target — key inflection zone
| 🔻 74.70 | Second bearish target — confirms full breakdown
| 🟢 78.13 | First bullish target — opens up if 77.30 breaks with strength
| ⚪ 79.20 | Secondary upside zone — major prior rejection area
---
Simply put:
* TEM formed a double top— that's a bearish pattern.
* Price is sitting right at a key level (76.60)
* 🔻 If 76.60 breaks → expect fast move to 75.39, then 74.70
* 🔼 If bulls reclaim 77.30 → opens door to 78.13 and possibly 79+.
* Momentum is leaning bearish, but the next move depends on 76.60.
---
🔼 Bullish Scenario: Reclaim 77.30 → Breakout
Trade Idea:
If TEM reclaims 77.30 with strength and volume, look for a move toward 78.13 and beyond.
* Entry: Break above 77.30 with volume
* Stop: Under 76.60
* TP1: 77.61
* TP2: 78.13+
Why It Works:
Price is oversold near support. A squeeze is possible if shorts get trapped and bulls take control.
🔻 Bearish Scenario: Breakdown Below 76.60
Trade Idea:
If TEM breaks 76.60 with volume, target the double top breakdown toward 75.39 and 74.70.
* Entry: Break below 76.60 with bearish candle (high volume)
* Stop: Above 77.30
* TP1: 75.39
* TP2: 74.70
Why It Works:
Double top pattern + weak support below = clean air for sellers. Bears will likely step in hard if bulls lose 76.60.
Neutral Scenario: Chop Between 76.60–77.30
* No breakout or breakdown.
* Trade the range if you must:
* Buy near 76.60 → Sell near 77.30
* Size down — less conviction.
Hypothesis:
> If 76.60 breaks, I’m looking for 75.39 → 74.70.
> I’m wrong if TEM **reclaims and holds 77.30** with strength.
Has a clear bullish signal, especially in the new formationA clear and closer push toward 100, looking at another range between 80-95, with overbought levels, the pattern has been consistent and continues to be, expect a retrace and continuation.
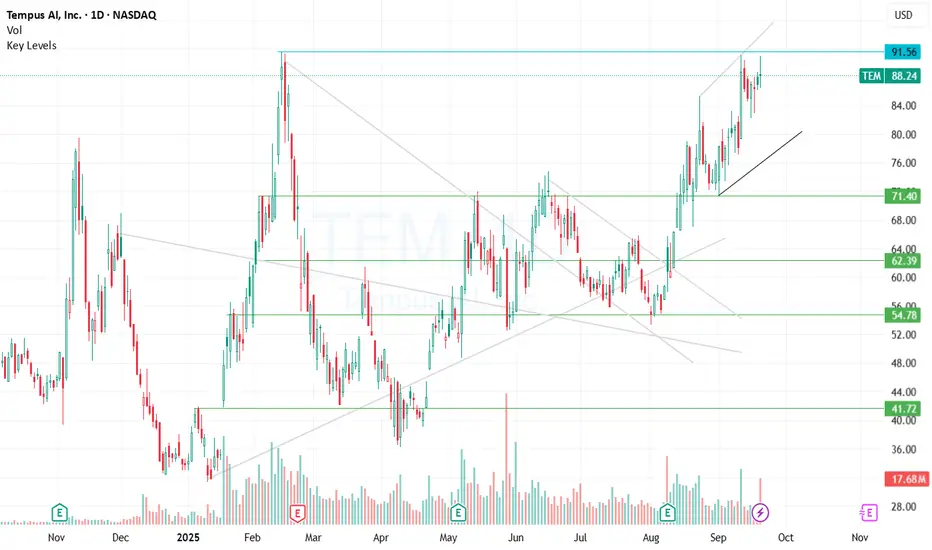
$TEM Weekend Analysis - 14th September, 2025Textbook breakout from the ascending triangle
Price tagged previous resistance at $91 (near 52-week high at $91.45) and is now cooling off after the strong push.
Next upside targets:
$96 (measured triangle target)
$100+ if momentum continues
NFA.
Tempus AI, Inc. (NASDAQ) (1D) - bullish continuationPrice Action
The stock had a strong run-up recently, breaking past previous consolidation resistance around $70.
Price is now consolidating above $70 support, which is healthy after a rally.
A breakout above $76.80–$77 zone would likely trigger the next leg higher.
Key Levels
Support Levels:
$69.23 (stronger base support; must hold for bullish case).
Resistance / Targets:
$76.80 (near-term breakout trigger).
$83.77 (first target).
$90.74 (second target, heavy resistance).
$97.71 (extended target).
$104.68 (longer-term bullish target).
Volume Analysis
Strong buying volume surge on the recent rally → institutional participation.
Current consolidation is happening on lighter volume, which supports a bullish continuation setup.
Trend & Momentum
Short-term trend: Sideways consolidation just below resistance ($76–77).
Medium-term trend: Bullish as long as it stays above $70.
Momentum: Favoring upside, but breakout confirmation needed.
Bias : Bullish, but waiting for a breakout above $76.8 to confirm momentum toward $83–91.
⚠️ Disclaimer : This chart is for educational purposes only.
Regulatory Note : We are an independent development team. Our services are not registered or licensed by any regulatory body in India, the U.S., the U.K., or any global financial authority. Please consult a licensed advisor before making trading decisions.

TEM BullishAfter breaking out of a long period of consolidation, TEM reached about 85 before healthily pulling back. As of recent its been wedging on the hourly, holding up 72 as support. Looked pretty strong today despite much of the market being down today, and had a strong close. I swung calls over the weekend and am looking to target above 80 in the near future. Nfa.

LONG | TEMNASDAQ:TEM
I’m leaning bullish on $TEM. Today’s volume came in around 2.5× the 20-day average, paired with a bullish engulfing candle—both strong short-term momentum signals. Price is testing the multi-month descending trendline, with $68.43 as the breakout trigger. A close above that opens the path to $72.15 → $74.20. The largest volume profile node sits in the $60–62 zone, making $62 my key support; losing it would shift bias to neutral/bearish

TEM $60C Lotto Play Before Earnings?🔥 **TEM \$60C Lotto Play Before Earnings?**
**Volatile Setup with 100%+ Upside Potential 🎯**
---
### 📈 **Trade Summary:**
* **Direction:** CALL (LONG)
* **Strike:** \$60.00
* **Entry:** \~\$2.20
* **Target:** \$4.40 (100%+)
* **Stop Loss:** \$1.10
* **Expiry:** Aug 08, 2025 (1DTE)
* **Confidence:** 65%
* **Risk Size:** Max 2% of capital
* **Gamma Risk:** 🔺 HIGH
* **Volume:** ⚠️ 0.8x prior week
* **Call/Put Ratio:** 1.34 (Bullish Flow)
* **RSI (W/D):** 52.2 / 49.0
---
### ⚠️ Key Takeaways:
✅ Bullish bias from RSI + Options Flow
❗ Weak volume and earnings risk = caution
⚡ 1DTE = high gamma, faster decay
🎲 Pure lotto? Size small, manage tight
---
### 🧠 Verdict:
**If you're playing it — play it tight.**
High reward, high risk. Treat it like a lotto ticket with a defined edge.

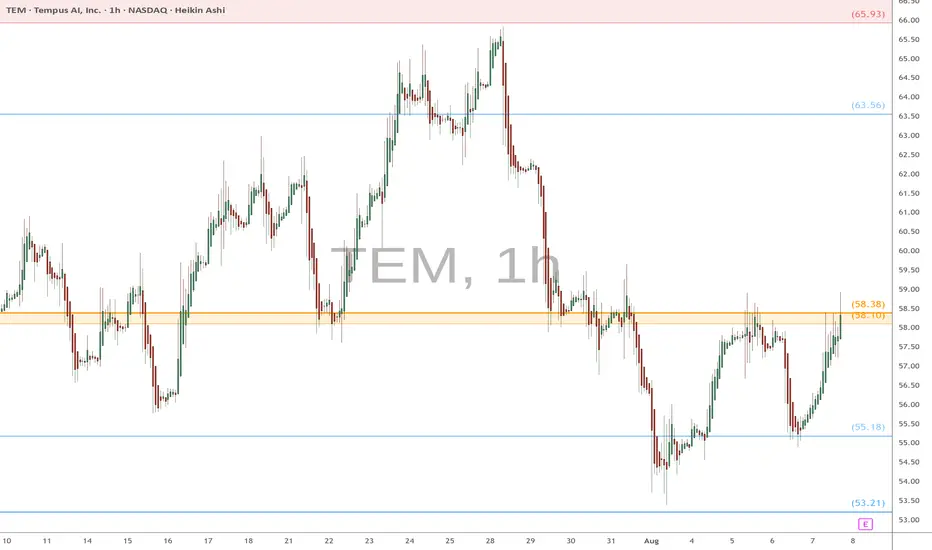
TEM eyes on $58.10/38: Double Golden zone about toe BREAK?TEM is trying to paint a bottom to its downtrend.
Look for break of Double Golden zone $58.10-58.38
Zone is well proven to all traders so watch it closely.
TEM: Bought Some Calls HereLooks pretty good at the demand zone, finding buyers and volume. Watching the next move. Thanks for reading.

TEM WEDGE Tem's in an interesting position. Multiple bullish and bearish gaps on the daily chart, wedging and tight consolidation, and head and shoulders that indicate a possible bearish continuation. Worth watching.

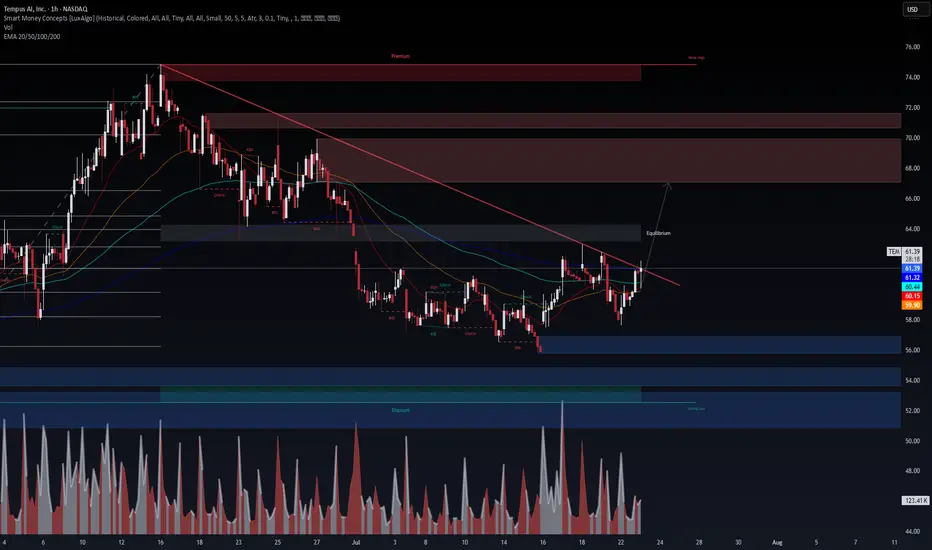
$TEM – Breakout Imminent After Accumulation? NASDAQ:TEM – Breakout Imminent After Accumulation? 📈
Tempus ( NASDAQ:TEM ) is flashing strong bullish signals backed by smart money and confirmed option flow.
🔹 Technical Picture (1H)
Trendline just broken to the upside
Clean break of structure (BOS) after sweep of June/July lows
Volume spike + EMA realignment confirms momentum shift
Targeting the $66–$70 equilibrium zone short-term
High timeframe liquidity sits above $74 — a magnet if momentum continues
🔹 Options Flow (July 23 @ 6:54 AM)
$56K call sweep for Aug 1 $66C (To Open)
Smart money positioning for a rapid move higher — not retail-driven
🔹 VolanX Bias: Bullish
Long trigger confirmed on trendline break and BOS
Risk: < $59.50
PT1: $66
PT2: $70
PT3: $74+ (if volume sustains)
This is now on VolanX watchlist as a potential stealth breakout fueled by institutional flow.
⚠️ For educational purposes. Not financial advice. VolanX Protocol active.
#TEM #Breakout #OptionsFlow #SmartMoney #VolanX #TradingView
TEM – Bullish Continuation to $74+ | Institutional Catalyst fromTEM – Bullish Setup Targeting $74+ | Strong Institutional Backing
VolanX DSS, WaverVanir AI, and SMC confluence confirm a STRONG BUY signal for TEM, with a 15–20% upside potential over the next 30 days.
Key Highlights
AI Forecast:
Current Price: $64.49
30-Day Target: $74.56 (+15.6%)
Model Confidence: Strong Buy
Technical Confluence:
Price has reclaimed equilibrium and is holding above EMA 20/50/100.
Fib levels and channel support point to an upside breakout towards $74–75.
Breakout of $66.3 (0.618 fib) would confirm bullish continuation.
Institutional Catalysts:
Recent Russell 3000E inclusion and increased institutional ownership.
Strong partnerships (AstraZeneca, Pathos AI) and expanding AI-driven healthcare initiatives.
Upgraded 2025 financial outlook.
Trade Plan
Entry: $64.50 (current levels)
Stop Loss: $56.96 (below EMA 100)
Target 1: $65.78 (partial)
Target 2: $74.56 (full)
Risk/Reward: 1.34:1
VolanX Protocol Insight:
Both the AI forecast and technical structure suggest continuation of the bullish channel. A clean breakout above $66.3 opens the door to $74+, with a potential extension towards $80.

TEM - what do you see ?I love this stock, so much momentum and good follow through.
I see it's ready for a strong rally. I've huge position via shares and Aug calls

Tempus AI getting some firepowerLooks like we have got support here at $57 area. MACD looking good and overall structure points to further upside. First target $69. If it pushes through then final target $78.


$TEM - New ATH's Inbound! 50% UpsideNASDAQ:TEM - New ATH's Inbound! 🚀
Bull Flag Breakout = $84.17 🎯
74.20 Cup&Handle Breakout = $110 🎯
WCB forming 📈
