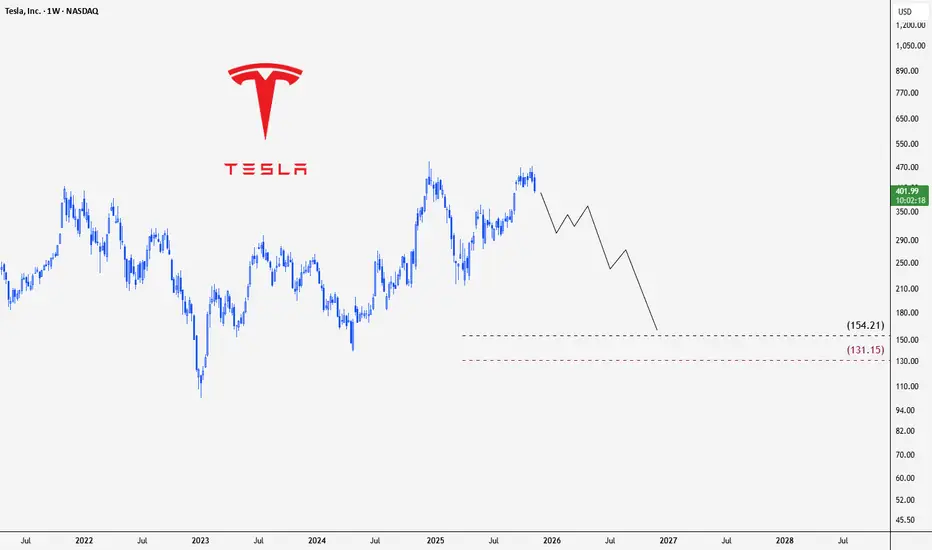
#TESLA My prediction for the next waveHello everyone
My prediction is that we will see a downward trend towards the targets outlined in the idea
The decline will take more than six months
This is not investment advice; please take full responsibility for your buying and selling decisions.
Warning: Be careful not to use this idea with leverage, as you could lose all your money
Trade ideas
TESLA Long SqueezeTesla has been trading within a sideways range but has recently broken down below it. Following some intriguing options data suggesting a potential positive gamma move above $450, many market participants may have become overly optimistic and begun anticipating new all-time highs.
However, at its current price level, Tesla appears to be in a danger zone. The recent rally lacks well-developed price action, indicating weak support until around $370. In that region, I have identified several VWAPs marking volume-weighted support areas, as well as the value area low from the volume profile of the previous trading range.
These zones align well with a potential support/resistance flip of the initial Wave 1 structure, and I’ll be watching for a possible Wave 4 low to form in this area.
According to Elliott Wave Theory, if Wave 4 falls below the highs of Wave 1, the structure is no longer considered impulsive and instead becomes corrective. This would increase the probability of Tesla’s price retracing toward previous lows—potentially dipping below $300 once again.
I plan to set alerts and monitor this zone closely for a possible long setup.

my levels to manage TSLA on Friday 11/14My direction: Bearish to neutral-bearish in the near term. I expect further downside or at best a weak bounce, given the mark-down phase, heavy volume selling, weak momentum and broken supports.
If things stabilize, there’s a chance for a relief bounce but nothing suggesting a strong bull run right now.

TSLA Bearish Setup: Double Top BreakdownTSLA’s 1D chart has shifted from a clean uptrend into a clear corrective phase. After a strong run into the $475 area, price printed a potential Double Top and then rolled over, breaking the neckline around $410 alongside a bearish Market Structure Shift. Price now sits below the 20 and 60-day MAs while still above the rising 120-day MA, framing this as a short-term bearish move within a longer-term uptrend.
The primary path favors further downside as long as TSLA stays capped below the $410–416 neckline zone and the $420 reclaim level. A daily close below the recent swing low at $385 would confirm continuation, opening room toward the $373 area and the 120-day MA support near $369, with an extended downside magnet around $360–345 if selling accelerates. MACD turning negative and increasing downside Squeeze Momentum both align with this bias.
If buyers manage to reclaim $420 on a daily close, that would threaten the bearish thesis by taking price back above the neckline and the 60-day MA. Such a squeeze could fuel a move toward $460 and potentially a retest of the $475 supply zone. Until that happens, rallies into $405–416 remain vulnerable to rejection.
Thought of the Day 💡: The strongest trade ideas start with a precise invalidation, not a prediction.
This is a study, not financial advice. Manage risk and invalidations.
-------------------------
Thanks for your support!
If you found this idea helpful or learned something new, drop a like 👍 and leave a comment, I’d love to hear your thoughts!

TESLA BIG SELL PROBABILITY SETUP SOON!!!🚨 TESLA HIGH PROBABILITY SELL SETUP 🚨
* Here We Can See Clearly The Next Potential Moves For TSLA Coming Hours/Days.
* Keep Your Eyes Close On Your Trading Positions.
* Happy PIP Hunting Traders.
FXKILLA.

$TSLA double top neckline breakoutNASDAQ:TSLA double top neckline gave way, could be sending price toward the 𝗺𝗮𝗷𝗼𝗿 𝘀𝘂𝗽𝗽𝗼𝗿𝘁 𝘇𝗼𝗻𝗲 𝘀𝗶𝘁𝘁𝗶𝗻𝗴 𝗶𝗻 𝘁𝗵𝗲 𝟯𝟱𝟬–𝟯𝟳𝟬 𝗿𝗮𝗻𝗴𝗲. That area has been a key battleground, and it’s where bulls will need to dig in if they want to stop the slide.
Until that support is tested, this chart is telling a story of weakness after a failed attempt to push higher.
If the support zone holds, the reversal could be powerful. If it doesn’t, the next chapter could get rough.

TSLA 1M AI Prediction📊 TSLA 1M AI Prediction – 2025-11-12
Current Price: $442.35
Trend: Neutral
Confidence: 55%
Volatility: 14.7%
Trade Signal:
Direction: Short
Entry Price: $442.35
Target: $440.50 (-0.52%)
Stop Loss: $448.99
Expected Move: -0.52%
30min Target: $440.31 (-0.46%)
Insight:
Katy AI predicts a small downward move in the short term
Low-moderate confidence; trade with proper risk management
Market trend is neutral, so position sizing should remain cautious
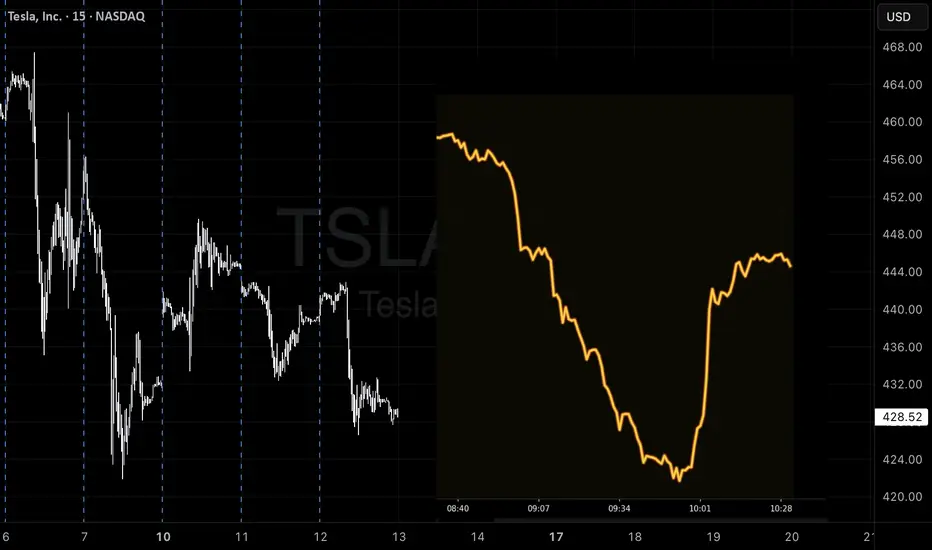
TSLA – Heavy Selling Finally Slows Down. TA for 11/17TSLA – Heavy Selling Finally Slows Down, but Buyers Still Need to Prove Themselves
TSLA has been one of the cleaner charts lately—not because it’s trending, but because the selling was so aggressive that the structure became obvious. Now that the drop has finally stalled, the real question is whether buyers can turn this into a recovery, or if today’s bounce was just a dead-cat reaction inside a bigger downtrend.
When I line up the 1-hour trend, the intraday 15-minute behavior, and the GEX levels behind the scenes, the situation becomes clearer.
1️⃣ 1-Hour Chart — Downtrend Still Dominant, but a Temporary Floor Formed
The 1H chart shows how sharp the selling was. TSLA broke every rising structure and couldn’t hold any mid-trend supports. It wasn’t until price flushed all the way into 380–385 that buyers finally stepped in with conviction.
What stands out is the wedge-shaped channel.
The upper trendline has been respected for days.
The lower trendline caught the bounce perfectly.
Now TSLA is sitting right in the middle of that wedge—not bullish, not bearish—just pausing after a strong decline.
Key 1H levels that matter:
* 423–424: First big resistance where every bounce fails
* 405–410: Local pivot zone
* 380–385: The level that saved TSLA from a deeper breakdown
Trading between these zones tends to be choppy, so I’m watching for a decisive break.
2️⃣ 15-Minute Chart — Short-Term Momentum Slowed, but No Reversal Yet
The 15M chart tells the real short-term story.
After the heavy downward move, TSLA printed a clean demand zone at 380–385 (multiple green FVGs). That’s where buyers finally stopped the bleeding. Price pushed up into 405–410, but stalled immediately. The last several candles show hesitation—buyers aren’t pulling away, but sellers haven’t fully taken over either.
The 15M structure right now:
* Strong demand: 380–385
* First barrier: 405
* Real test: 423–424
* EMAs are flattening, signaling indecision
The 15M chart is giving a “wait for confirmation” type of vibe. No clear reversal yet—just a temporary pause after a strong selloff.
3️⃣ GEX (1-Hour) — Finally Tells Us Where TSLA Wants to Go
This is the part of the chart that explains the hesitation.
Upside Levels (if buyers take control):
* 410: First meaningful GEX resistance
* 415: Stronger gamma wall
* 437–450: Multiple call walls stacked together
If TSLA ever gets above 424, the path toward 437–450 becomes much easier than it looks on the chart.
Downside Levels (if sellers return):
* 400: Light put support
* 395: Stronger hedge zone
* 380: Heavy put wall — explains the huge reaction today
* Below 380 → hedging accelerates toward 370
The GEX map lines up perfectly with what happened today:
Price bounced exactly at the deep put wall around 380, where market makers hedge aggressively.
This is also the kind of GEX structure that makes traders ask,
“Why does TSLA always bounce or stall at the same levels?”
—because these levels come from options positioning, not candles.
🎯 How I’m Approaching TSLA for 11/17
🔼 Bullish Plan (Only Above 410, Strong Confirmation Above 424)
This is not a name I want to jump early on.
TSLA is still in a downtrend, so the bullish scenario needs real confirmation.
Stock Trade Idea:
* Entry #1: Above 410
* Entry #2: Safer play above 424 (clean break of daily resistance)
* Targets:
* 430
* 437
* 445
* 450 (call wall + gamma cluster)
Options Idea:
* 420C / 430C for scalp
* 440C / 450C for swing continuation
* Only valid above 424
🔽 Bearish Plan (Below 400 → Downside Opens Fast)
If TSLA rejects 410 again or loses 400, the structure flips back to bearish.
Stock Trade Idea:
* Entry: Below 399.50
* Targets:
* 395
* 385
* 380 (major put wall)
* 370 if 380 breaks
Options Idea:
* 400P for scalp
* 385P or 380P for continuation
* If 380 fails → 370P becomes attractive
TSLA usually moves fast once it touches GEX/Put levels, so these can be sharp trades.
⚠️ Choppy Zone: 400–410
This whole zone is a trap area—lots of indecision, lots of fakeouts, thin conviction.
I avoid trading TSLA inside this zone unless volume spikes.
Final Thoughts
TSLA is in a spot where both bulls and bears have clean levels to play off. Today’s bounce was strong, but it came directly from a major put wall, so the reaction makes sense. The real direction doesn’t start until TSLA breaks either 410 up or 400 down—everything in between is chop.
Once one side wins, the move should be clean because both the chart and GEX positioning align on the next targets.
Disclaimer
This analysis is for educational purposes only and does not constitute financial advice. Always manage your own risk.

TSLA - Hold to die till the Optimus RobotConsumer availability: Earliest realistic U.S. consumer release ≈ 2030, with broad adoption 2032–2035.
Rollout path:
Tesla factory use (2025–2026) →
Pilot programs (2027) →
Enterprise sales (2028) →
Consumer launch (~2030).
Expected price:
Mass-market target: $20K–$25K
Early enterprise units: $30K–$40K
Premium version: $45K–$60K
Why the delay: Safety certification, AI reliability, household task generalization, insurance, and building a nationwide service ecosystem.

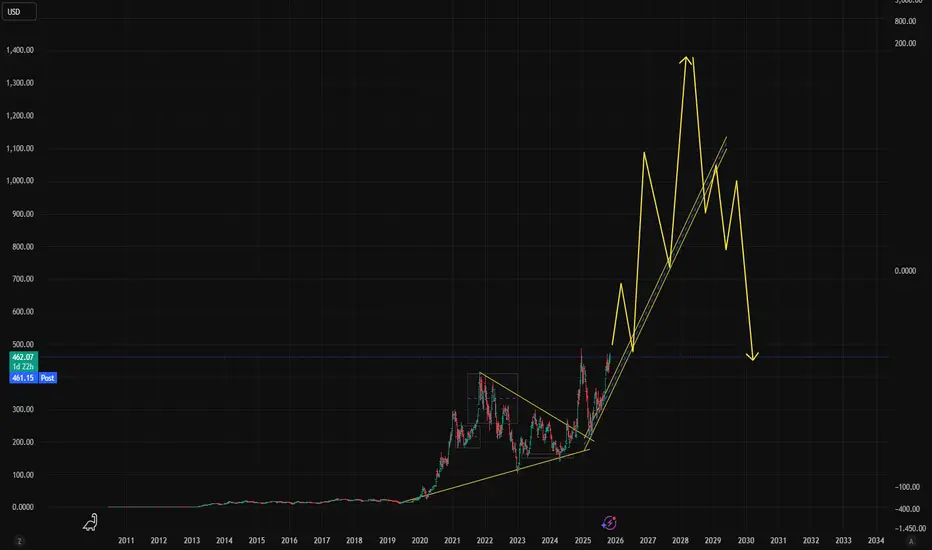
$TSLAHi we are back again with another banger: NASDAQ:TSLA
This is not financial advice but it is very much just key insight.
Here we have NASDAQ:TSLA trading at $462.07 with a potential %, which can bring 100%+ in profits.
Elon musk is doing great things for humanity, and TSLA is going to be a pillar of earths future success. With saying that we know Elon wont let earth of his NASDAQ:TSLA share holders down.
Possible bull market until the end of 2026 which is where we can start to see a break down in trend which would possibly be above $1000+ per share.
Don't forget to use your NASDAQ:TSLA shares to vote today :)
Thank You Elon Musk for everything !!
Don't forget to Comment Like & Share with a friend for good luck, peace out !!
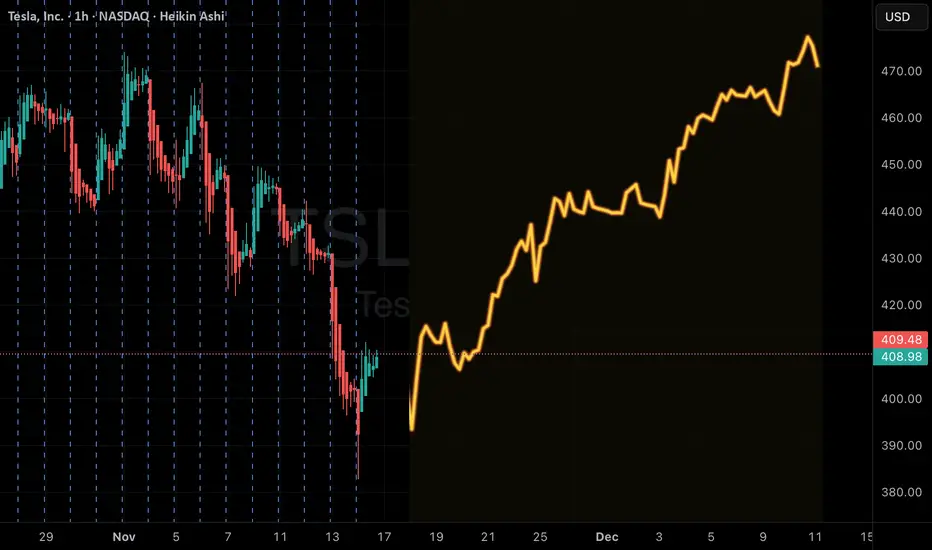
TSLA V3 Weekly Alert — Deep ITM CALL SignalTSLA QuantSignals V3 Weekly 2025-11-14
AI & Technical Forecast
Katy AI Target: $421.69 (+3.2% upside)
Expected Dip: $390.59 Monday before mid-week recovery
Momentum: Strong weekly uptrend, MACD bullish, EMA alignment confirms uptrend
Support: $402.40
Resistance / AI Target: $421.69
Insights:
Friday expiration entry offers volatility discount; deep ITM call captures most delta with minimal extrinsic loss
PCR 3.30 → institutional put-heavy positioning, creating potential contrarian opportunity
Event Risk: Elon Musk fireside chat (Friday 1:05 PM ET) may spike volatility
🎯 Trade Setup
Parameter Value
Direction CALL
Strike $370.00
Entry $40.30–$40.55 (mid: $40.42)
Target 1 $46.00 (+13.8%)
Target 2 $52.00 (+28.6%)
Stop Loss $35.05 (–13.3%)
Position Size 2–3% of portfolio
⚡ Key Advantages
Deep ITM structure → high delta exposure (stock-like behavior)
Limited extrinsic value → reduces theta and IV crush risk
Timing aligned with post-event momentum and mid-week recovery
Risk/Reward ~2.15:1 (Target 1 vs stop)
🚨 Risk Notes
PCR 3.30 → extreme hedging/fear; stop may trigger quickly
Theta decay accelerates Mon-Wed; manage positions carefully
Deep ITM calls → wider spreads; use limit orders
Consider scaling out at Target 1 to reduce gamma exposure
Summary:
TSLA deep ITM weekly call provides contrarian, medium-conviction bullish exposure, leveraging AI trajectory and technical alignment. Suitable for 7-day horizon with disciplined risk management.
TSLA Short: Completion of Wave BOver in this lengthy video, I shared the big picture of TSLA Elliott Wave counts on a Cycle level using logarithmic chart and showed that it has peaked since Dec 2024. The subsequent move down till Apr 2025 is a Wave A and the move up to 3th Nov is actually the completed wave B. Wave C down is in progress and the ultimate target is $198.66, or if you are more conservative, $200. The stop loss is above the top of wave B.
Good luck!

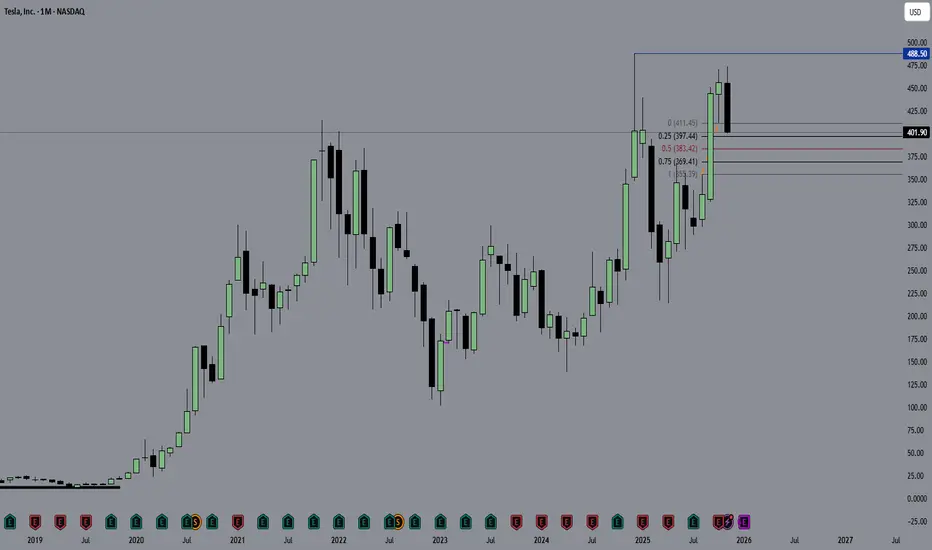
TeslaPrice finally made it down into the target box last Friday and already bounced higher moving back out of the box. Rather we make another low towards the 1.382 remains to be seen. If we have bottomed in what I am calling minor A, then we should move higher to the $440-$450 area next. There also remains the possibility that we get another high if intermediate (B) is yet to complete.
Currently price is moving down in the overnights. If we can get some more data pointing higher, though, I will begin tracking that move with fibs. Until then, there remains the very real possibility that we get another low.

Tslar4BearsThe
tslar's
elon musk recent vote likely to favor
the
bears temporarily
as
we
go
into
the
new
week
Though the year may likely end bullish

Tesla Wave Analysis – 13 November 2025
- Tesla broke support zone
- Likely to fall to support level 380.00,
Tesla recently broke the support zone between the support level 415.00 (which has been reversing the price from September) and the 38.2% Fibonacci correction of the upward impulse from September.
The breakout of this support zone strengthened the bearish pressure on Tesla accelerating the active impulse wave (iii).
Tesla can be expected to fall further to the next support level 380.00, which coincides with the daily up channel from April and the 61.8% Fibonacci correction of the upward impulse from September.

TSLA BULLISH BIAS RIGHT NOW| LONG
TSLA SIGNAL
Trade Direction: short
Entry Level: 404.30
Target Level: 433.84
Stop Loss: 384.55
RISK PROFILE
Risk level: medium
Suggested risk: 1%
Timeframe: 5h
Disclosure: I am part of Trade Nation's Influencer program and receive a monthly fee for using their TradingView charts in my analysis.
✅LIKE AND COMMENT MY IDEAS✅

TSLA the rollercoaster continuesCould Burry be right?
AI bubble could burst and take other stonks down, we need a correction NASDAQ:TSLA is expensive....again 300 could be possible again. This is what a healthy correction could look like even if nothing happens with Open Ai/Nvidia/Ect...

Tesla at a DiscountJamie Dimon said the future economy is going to be worth hundreds of trillions, and honestly that’s how I’m looking at Tesla right now. This feels like the discount phase before we go into 2026. If the whole economy is about to expand like that, Tesla’s AI, robotics, and energy side are going to be way more valuable than what the market is pricing in today. This is the type of level.
Tesla Macro Chart - Monitor PA @ Gap and Box midpointWatching to see what happens to tesla at the daily gap below and the box midpoint.
Again there could be a look below and fail of the pictured inner box but the failure at the top of this box says that we should be heading lower.
If the gap fill happens and it continues past $384, things could get musky.
What's happening at Tesla!!I think Tesla should reach a price range of about $50 cheaper than the current price along the box drawn in the chart!

Fresh Daily Tesla ChartSharing my very messy Tesla chart.
Still watching for that $384 and $314 if we push past that daily gap.
The box midpoint(384) of my tesla Macrochart is the decision point to me.
Could still get a look below and fail of the boxes or a gap fill and reversal.
Tesla at a Crossroad: Can the $410 Support Hold Before the Next Tesla’s price is currently consolidating below the $450–$460 resistance zone after failing to sustain its recent breakout. This area has previously acted as a strong supply zone, and the latest rejection suggests that short-term momentum has weakened.
If buyers manage to defend the $410–$420 demand area (highlighted in green), a rebound could occur, potentially leading to a retest of $460 and a further continuation toward $500 and $550 in the midterm. This bullish scenario would require strong buying volume and confirmation of higher lows forming on the daily timeframe.
However, if the price breaks below the $410 support, it could trigger a deeper pullback toward the $350–$360 demand zone — a level that coincides with previous accumulation before the last rally. A loss of this zone may open the path toward $300 in an extended bearish case.
Bias: Neutral-to-Bullish above $410; Bearish below $410.

Buy low, sell high, CC on TSLAI've sold SOOO MANY CALLS up here. I just keep buying them back and selling more. This one looks SUPER nice. 2 weeks until expiration! 1%. Plus a day of theta. If I get called away at $450 = amazing
