TESLA — Bad Earnings + Overcrowded Trade = More Downside RiskSummary:
Tesla’s latest earnings disappointed again — weak margins, slower delivery growth, and unclear guidance on new product cycles.
Despite that, retail and institutional positioning remains heavily crowded, with traders still trying to buy every dip.
But when sentiment stays bullish while fundamentals weaken — that’s when distribution begins quietly.
Key points:
EPS miss and declining automotive margins.
Valuation still priced for perfection.
Lower volume reaction on bounces = fading demand.
Market rotation out of megacaps continues as yields stay high.
Technical setup (chart above):
Major rejection at 450–455 USD resistance (post-earnings rally exhaustion).
Potential continuation toward 420 → 397 → 372 USD support zones.
Short zone: 445–450
Target: 372
Stop: 455
Narrative:
The “AI car” story is overcrowded — even good news now fails to spark real follow-through.
If macro stays tight and rates high, Tesla could correct further before finding long-term buyers again.
💬 “When everyone already owns it, there’s no one left to buy.”
Trade ideas

Buy low, sell high, CC on TSLAI've sold SOOO MANY CALLS up here. I just keep buying them back and selling more. This one looks SUPER nice. 2 weeks until expiration! 1%. Plus a day of theta. If I get called away at $450 = amazing

Tesla Is Moving Toward a Key Support ZoneHello everyone, Tesla is entering a sensitive phase as the strong rally from 310 USD to 406 USD over the past two months begins to lose momentum. The recent decline is not just a normal pullback; the repeated appearance of red FVGs shows that buying pressure is fading while sellers are gradually taking control again. At the moment, the 401 USD level is acting as the nearest support. If this area fails to hold, Tesla could slide further toward 395 USD — a zone with green FVGs and heavy volume where strong buying previously pushed the price upward.
On the fundamental side, the news flow isn’t helping. Tesla’s Q3/2025 report showed adjusted profits dropping nearly 29% even though revenue still grew around 12%, indicating that operational efficiency is weaker than expected. Rising costs, lower income from regulatory credits, and massive investments in AI and robotics continue to squeeze margins. At the same time, competition from Chinese and European EV manufacturers is intensifying, putting additional pressure on Tesla’s future market share. With the broader tech market shifting toward a risk-off mood, growth stocks are taking heavier hits — and Tesla is clearly feeling that weight.
Given both technical structure and market sentiment, the most reasonable scenario right now is a continued move down into the 395 USD support zone to test liquidity and gauge the market’s reaction. This level remains a strong technical area and could trigger a meaningful bounce if buyers step in. However, if 395 USD breaks under negative news or persistent outflows from growth assets, the decline could extend toward 385–380 USD. On the flip side, if a major positive catalyst appears — such as notable progress in robotaxi development, better margins, or a breakthrough in battery technology — the 405–410 USD region would be the first recovery target.
For now, Tesla is standing at a “pivot zone” — a place where the market will soon reveal whether this is just a pause before another upward leg, or the beginning of a deeper corrective cycle.

325 and then 800?Shaping up nicely to double next year. Most likely it will go down to 325 and if it can hold 325 then 800 coming next year most likely. If it looses 325 on a monthly basis then all bets are off.
Happy Trading. Not a financial advise.

sell tslatsla printed a beautiful double top. tsla price broke down highlited price range, retested it and is came back down again, sell here, tsla is now super bearish... it will likely lead an upcoming sell-off in stocks.

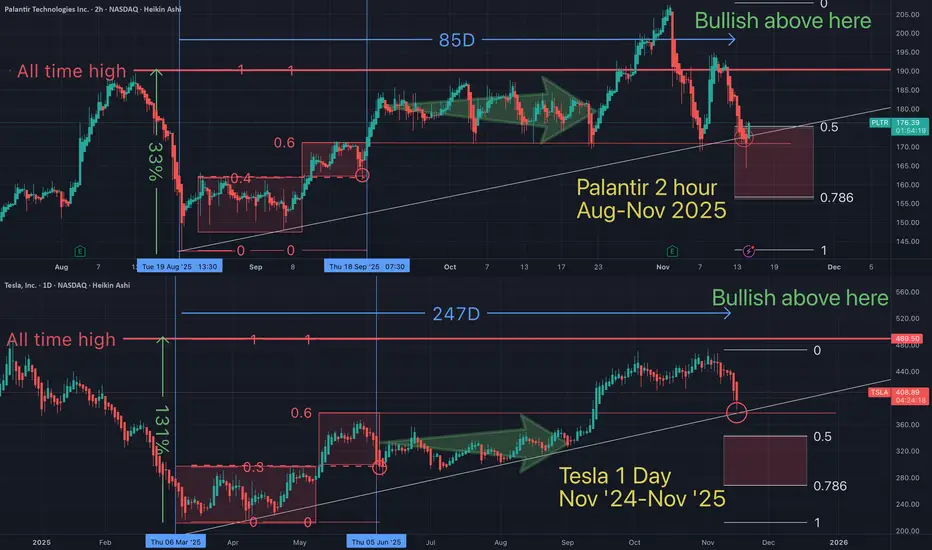
Tesla / Palantir Fractals DUMPED together towards GPThey're at it again. Folks this is a good horse race. Strangely accurate how they follow each other.
Are we in a simulation?
May the truth be with you.
Tesla - The Bullish Path Is Clear... For Now.Hey Traders! It’s been a while since I posted about TSLA. This one isn’t an in-depth LTF breakdown — instead, we’re zooming out to identify the higher-timeframe targets and where price wants to go before any real continuation can happen.
The market runs on liquidity — and the less of it there is, the harder it is for price to move freely. Because TSLA carries so much liquidity and volatility, we don’t need the same slow, drawn-out liquidity builds that other stocks require. The swings are large and the algorithms respect because the liquidity is always there.
When we zoom out, the structure becomes clearer. The market consistently gives us signs before each major move — and on a higher-timeframe bullish Tesla, the price action is guided by white tapered selling, which acts as our roadmap for healthy continuation.
But here’s the nuance:
The higher up in timeframe we go, the more liquidity is required to sustain the next leg. That’s why we often see price digging deep into previously proven and broken algorithms before continuing higher. It’s not randomness — it’s the market refueling for expansion.
The path is pretty clear ahead for TSLA that we'll need to take advantage of HTF algorithms in order to break out of a much HTF liquidity structure.
Happy Trading:)

TESLA Bearish Breakout! Sell!
Hello,Traders!
TESLA broke below a key horizontal structure, confirming a bearish breakout. SMC perspective suggests smart money could drive price to mitigate inefficiency near $375 support zone. Time Frame 12H.
Sell!
Comment and subscribe to help us grow!
Check out other forecasts below too!
Disclosure: I am part of Trade Nation's Influencer program and receive a monthly fee for using their TradingView charts in my analysis.

TESLA: Bullish Continuation is Expected! Here is Why:
It is essential that we apply multitimeframe technical analysis and there is no better example of why that is the case than the current TESLA chart which, if analyzed properly, clearly points in the upward direction.
Disclosure: I am part of Trade Nation's Influencer program and receive a monthly fee for using their TradingView charts in my analysis.
❤️ Please, support our work with like & comment! ❤️

Hi Trader, a little lost. For tomorrow we have TSLAwith a bearish trend.
If it opens above the closing price, we could expect a reversal at 412.00. If it rejects this zone, we could enter a short position.
If it opens below 392.00, we enter a bearish continuation position.

Hi Trader, a little lost. For tomorrow we have TSLA: with a bearish trend.
If it opens above the closing price, we could expect a reversal at 412.00. If it rejects this zone, we could enter a short position.
If it opens below 392.00, we enter a bearish continuation position.

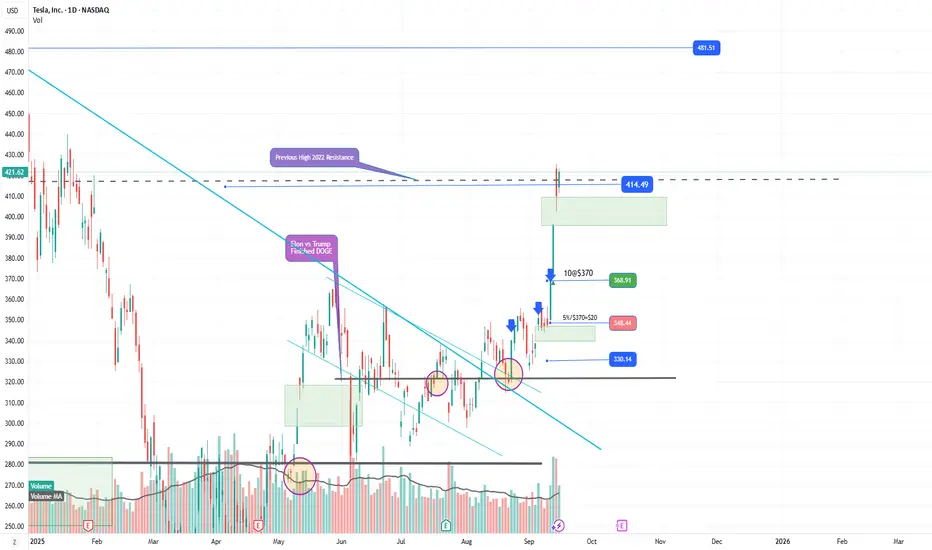
#TSLA Analysis, Elon breaks the Key level ^.^^Elon pours Big Money $$$ into TSLA stock recently causing Rally!
Price has gone up significantly, I don't think it will drop below $400 any time soon.
Strong Greenbar breaks out from the wedge with large volume increases.
Short sellers are getting squeeze out.
More investors are coming to catch smokey train.
Price Target next $480.
Come and join the Rally.
TSLA Pitchfork Breach | Neutral RSI, Weak VolumeFollow GoldenZoneFX for more content and valuable insights about financial markets.

Tesla - Stay patient and don’t rush in 🔮 Tesla (TSLA) – Long-Term Weekly Outlook
Based on the weekly timeframe, Tesla has completed its historical bullish cycle, topping out at $488.54, and has since entered a major corrective phase that has lasted for nearly two years.
This structural correction now appears to be in its final stages, as the price consolidates within what looks like a clear institutional accumulation zone.
---
⚙️ Key Technical Zones
The 2020 Point of Control (POC) around $219.42 represents the core price level that supported Tesla’s previous major rally.
The long-term ascending trendline passes right through this area, reinforcing it as a major structural support.
Just below lies the $183–$185 region, which marks a powerful confluence zone of:
Fibonacci 0.786 retracement,
a historical VWAP level near $183.60, and
the beginning of a strong volume node on the profile.
> This region is what institutions often refer to as the “final accumulation zone” — where large investors quietly rebuild positions before the next expansion phase begins.
---
📉 Expected Scenario Before the Next Rally
During the first quarter of 2026, Tesla is expected to experience one last corrective leg, gradually pulling back toward the $185 level, which aligns perfectly with the 0.786 Fibonacci retracement.
This move will likely act as a liquidity sweep — shaking out late buyers and triggering stop-losses — before institutions start accumulating heavily again.
---
💰 Smart Buying Zone
Optimal entry range: $183 – $190
Entry confirmation: A strong bullish weekly candle with rising volume emerging from the support zone
Protective stop: Weekly close below $170
Projected upside targets:
1. $295
2. $340
3. $396
4. $475
5. $520
These represent the key stages of Tesla’s expected bullish recovery cycle for 2026–2027.
---
🧠 Institutional Perspective
Large funds (“the whales”) are patiently waiting for this final phase of the correction to rebuild their long-term positions at discounted prices.
Between March and May 2026, the accumulation process is expected to complete, marking the beginning of Tesla’s next major bull cycle.
---
✅ Summary
The final downside scenario projects a move to around $185,
right at the 0.786 Fibonacci level — the last golden buying zone before the next historical rally begins.
⏳ Recommendation:
> Stay patient and don’t rush in — the real buying opportunity will come with the whales 🐳
in the $183–$185 zone, where smart money quietly re-enters the market.

TESLA PT-2 TRILLION DOLLAR PAY CHECKI hope everything is clear now. I have exited all positions here and I am not going into news.
Elon is not going to tell me where my money is going
NOTE:NOT TRADING TSLA

TESLA Sellers In Panic! BUY!
My dear subscribers,
My technical analysis for TESLA is below:
The price is coiling around a solid key level - 429.39
Bias - Bullish
Technical Indicators: Pivot Points Low anticipates a potential price reversal.
Super trend shows a clear buy, giving a perfect indicators' convergence.
Goal - 446.44
About Used Indicators:
By the very nature of the supertrend indicator, it offers firm support and resistance levels for traders to enter and exit trades. Additionally, it also provides signals for setting stop losses
Disclosure: I am part of Trade Nation's Influencer program and receive a monthly fee for using their TradingView charts in my analysis.
———————————
WISH YOU ALL LUCK

TSLA: one more leg down potential NASDAQ:TSLA
Watching for one more leg down into the 430–400 mid-term support zone to potentially complete the corrective structure, if price remains unable to break out above the October/November highs.
Chart:
Alternatively, if price manages to break-out and stay above above recent resistance, odds favor continuation to 555-630 resistance zone.
Chart:
Previously:
• On macro bottoming potential (Jun 6):
tradingview.com
• On support (Sep 19):
• On mid-term support (Oct 7):

$TSLA - Reaching $1050 in 2026 is NOT a Dream!I can't ignore how bullish Tesla stocks chart looks right now. A massive ascending triangle with horizontal resistance ($430) was broken upwards and currently the price is consolidating above it, the resistance also perfectly correlates with the 0.786 lvl by Fibo.
Taking into account the overall company's plan regarding its growth (talking about recent news that 75% of shareholders voted in favour of a compensation plan that could award Musk up to $1T in stock if Tesla could achieve $8.5T market capitalization) , we can easily expect NASDAQ:TSLA to reach point 1 by Fibo ($1050 mark) .
By the way, by pointing out to the news about providing $1T, I don't mean that Tesla could really achieve $8.5T market capitalization any time soon, if only in 10 years as the overall money supply is drastically increasing. This news highlights the plan, in other words - creative way of sharing what is their "plan maximum" in terms of 10 years.
I believe Tesla will cost $2T in 2026.

Going Short TESLA HereTrading Fam,
I'm taking my first ever short here since implementing my new indicator. It has been killing it on the long side. We've exited our last 17 trades, all for wins, with an average profit of 30% per trade and our portfolio is up over 86% on the year. Now, it's time to test the short signals. We received two here on TSLA. I've taken a small entry since this is my first short, representing around 9% of the portfolio total. I'm going to target $350 but will not take more than a 7% loss, thus my stops are set at $476 bring the rrr on this trade entry to 1:3. Let's see how this goes.
✌️Stew

Tesla IdeaShort to
430 then
up again
___________________________
summary
Tesla, Inc. continues to make bold promises about autonomous driving, robotaxis, Cybercab, and Optimus robots that remain unfulfilled or face legal and technological barriers.
TSLA's $1.5 trillion valuation is extremely high at a 348X Forward GAAP P/E, making the stock risky if Elon Musk's ambitious vision fails to materialize.
Despite repeated delays, broken promises, and shifting timelines, somehow investor enthusiasm for TSLA persists, driven by Musk's compelling narrative.
TSLA investors should exercise caution and conduct thorough due diligence rather than relying solely on Musk's visionary promises.
I continue to recommend a strong sale or even a long-term short of TSLA stock

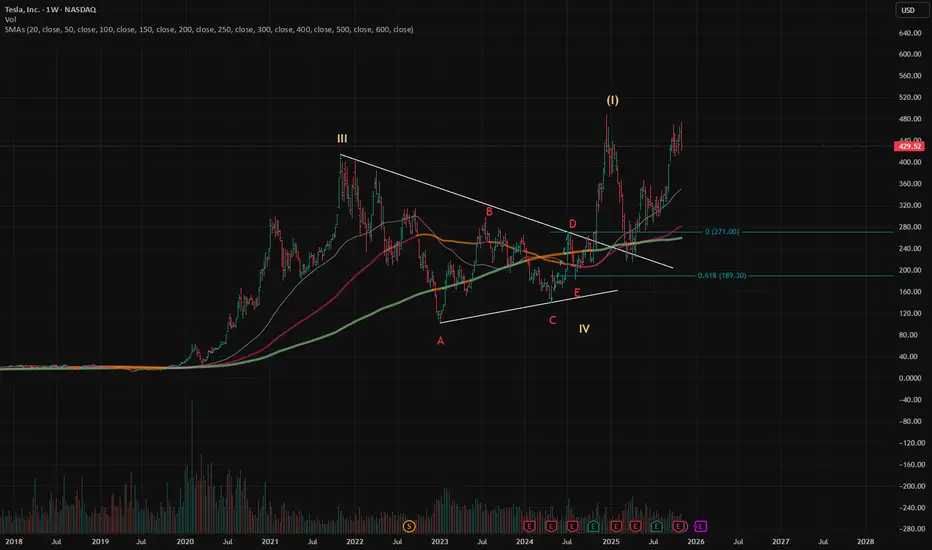
$TSLA: Weekly BullishNASDAQ:TSLA Weekly: I consider TSLA to have completed Wave III. Triangles are more likely to appear in Wave IV. We are in an extending Wave V.
Wave (I) of V has completed. Wave (II) appears to be a very sharp zigzag.
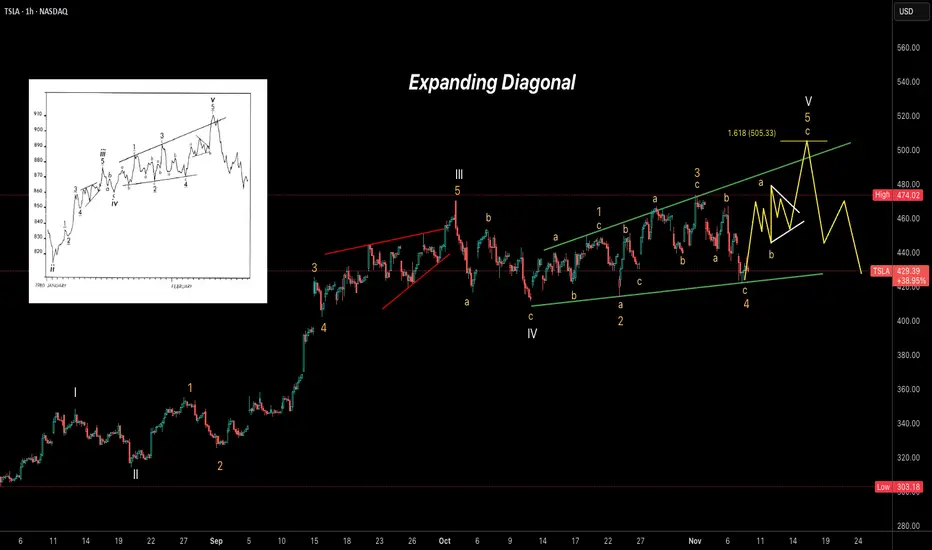
TSLA – Expanding Diagonal in Progress Tesla (TSLA) appears to be forming an Expanding Ending Diagonal pattern on the 1-hour chart, suggesting the final stages of a larger impulsive structure. Wave (V) seems to be unfolding with internal subdivisions visible, possibly targeting the 1.618 Fibonacci extension near 505 before a sharp reversal.
Key observations:
Structure resembles a textbook expanding diagonal (5-3-5-3-5).
Wave 4 found support near the lower trendline.
Wave 5 projection aims toward the 500–505 area.
Expecting a potential pullback or reversal once the diagonal completes.
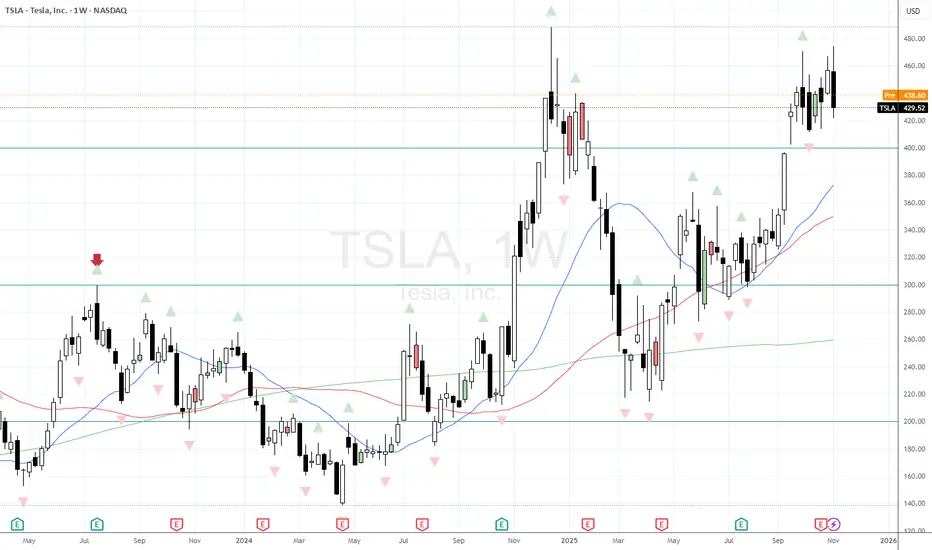
Tesla prints a weekly Key Reversal as part of a triple topTesla has been a volatile stock this year - and difficult to trade because of that.
However I now see that we've printed a weekly bearish key reversal as part of a double/ triple top. Is this now indication that we're likely to flow lower in the immediate future?
Well I am expecting some giddiness if they manage to end the US Gov't Shutdown, so it may help push prices higher for a day or two...and then the trend re-exerts itself?
Bearish in the short term after the relief rally bump.