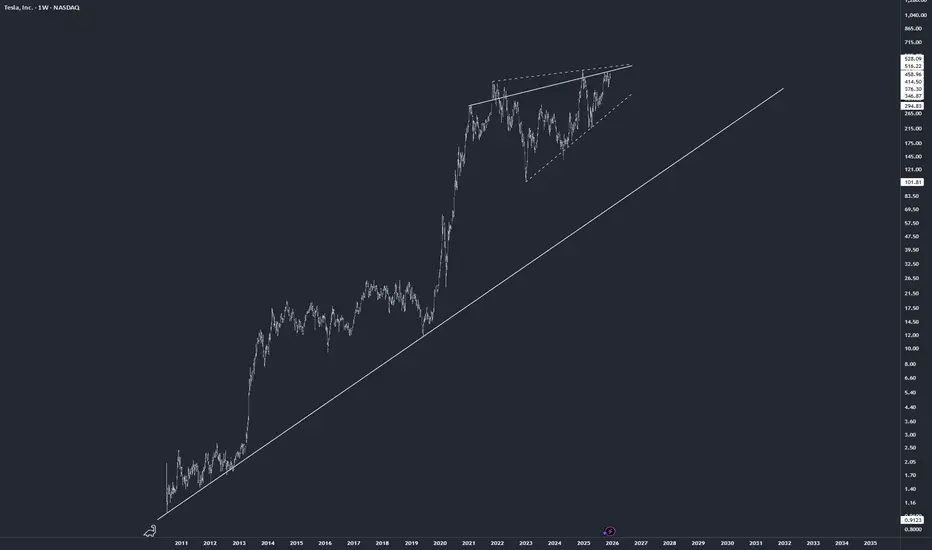
TESLA Is December seasonality about to hit it hard?Tesla (TSLA) has been trading within a 3-year Channel Up and has been on a Bullish Leg since the April 07 market low. Not everything on its long-term outlook is positive though as December in the past 5 years, holds a bearish seasonality for the stock as it has aggressively declined.
A 1W MACD Bearish Cross was always present during these times and so is today. With the price trading under a familiar Lower Highs trend-line as in 2023, we see strong probabilities that Tesla starts a new long-term correction. The minimum drop on these corrections has been -50% so a repeat of that would put the price exactly at the bottom of the Channel Up at $236, with only the 1M MA100 (red trend-line) in support.
---
** Please LIKE 👍, FOLLOW ✅, SHARE 🙌 and COMMENT ✍ if you enjoy this idea! Also share your ideas and charts in the comments section below! This is best way to keep it relevant, support us, keep the content here free and allow the idea to reach as many people as possible. **
---
💸💸💸💸💸💸
👇 👇 👇 👇 👇 👇
Tesla, Inc. Shs Cert Deposito Arg Repr 1/15 Sh
No trades
Market insights

Tesla Stock Lifts 2025 Gains to 20% as Traders Eye Santa RallyA megacap squeezing in one more rally before year-end? Yes, please.
🚗 A Holiday Glide Higher for Tesla Shares
Tesla NASDAQ:TSLA is heading into December with solid momentum. Coming into Monday, the stock has risen 20% since January, putting it on track for a third straight annual gain .
Investors will gladly take it. Tesla isn’t exactly a low-volatility cuddle toy — this is a stock that fell 65% in 2022, then turned around and doubled in 2023, then tacked on another 63% in 2024.
Still, the long arc is impressive: since Tesla's 2010 IPO, the stock has only posted annual declines twice — in 2016 and that infamous crash year of 2022. This year’s 20% gain looks tame by Tesla standards, but context matters: tame is good.
🎅 Santa Rally Season: Will Tesla Join the Party?
This is the time of year when traders start looking for that special year-end swing called Santa rally.
Fortunately, December has been good to Tesla shares. Really good. The stock has risen in more than half of all Decembers since its flotation 15 years ago, with nine monthly gains and six declines over its life as a public company.
Why does the Santa rally happen?
• Some say it’s psychology: investors in a good mood tend to buy.
• Some say it’s portfolio managers smoothing out their year-end reports.
• Others point to tax strategies, retail flows, or just holiday optimism.
No one really knows — which makes it the perfect market myth. But if Santa does show up this year, Tesla benefits. A few cheerful sessions could be enough to lock in another positive annual finish.
Just don’t confuse December with easy money. Historically, it’s just as volatile as every other month — and sometimes worse.
🔥 When December Isn’t So Jolly
Want a reminder that Tesla can rewrite the script in both directions? Look no further than December 2022, when the stock plunged 37% in a single month.
Back then, investors worried CEO Elon Musk’s bold acquisition of Twitter (now X) was consuming far too much of his attention — at the cost of Tesla’s market cap.
The 2025 backdrop is far calmer. Today’s concerns are more traditional Tesla fare:
• How many cars will it deliver?
• What will margins look like?
• Is the growth runway intact?
• What type of robots will Elon talk about on the next call?
December can still swing.
📦 Deliveries: The Real Catalyst on Deck
But traders love a year-cap rally. Even more so when there’s something to bet on.
Expectations for Tesla’s Q4 2025 deliveries sit between 507,000 and 512,000 vehicles, a number that would help confirm a steady, if not explosive, growth narrative.
More importantly, full-year 2025 deliveries are projected to exceed 2 million units, aligning with Elon Musk’s long-term growth target of 20–30% year-over-year production.
In Tesla’s world, hitting numbers is the difference between “Tesla has momentum” and “Tesla is broken again.”
That means Q4 data — arriving Thursday, January 1 or Friday, January 2, 2026 — will be key for this year’s narrative. The numbers drop early in the morning while everyone is still recovering from celebrations, and suddenly your phone buzzes with either joy or existential dread.
Earnings are a big factor, too. The next report date, as per the earnings calendar , is set for January 28.
🎁 The Takeaway: A Rally Within Reach
Tesla’s 20% gain in 2025 looks solid heading into the final stretch, and seasonality is on its side.
• December tends to be kind.
• Santa rallies tend to lift boats.
• Analysts are optimistic about deliveries.
• The stock has historical resilience.
But this is still Tesla — a stock with a personality, a fanbase, a fierce opposition , and a volatility profile that can make your stomach churn.
Off to you : How do you see Tesla stock performing in December? Share your views in the comments!

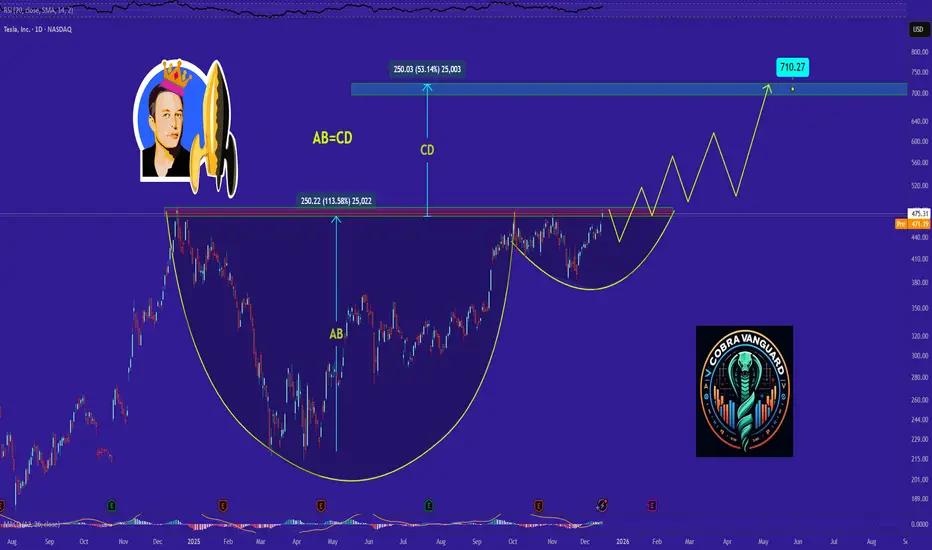
TESLA analysis, Chart is speaking itself !!!It can be said that the price has completed this pattern, and whenever the cup and handle is broken, we should expect a growth equal to AB=CD.
TSLA at a Pressure Point – Dec. 15 Could Be VolatileTSLA is in an interesting spot right now. It had a sharp move up, then immediately ran into resistance and started compressing. That kind of price action usually tells me the market is deciding whether this was a real breakout attempt or just a squeeze before another leg down.
Price pushed up fast, then stalled, and now it’s moving sideways under resistance. That’s not aggressive buying — it’s hesitation. Buyers showed up once, but they haven’t followed through yet.
Right now, TSLA is sitting just under a key resistance zone, and how it behaves there matters a lot.
Levels that matter on this chart
The main level I’m watching is 455–460.
This zone has been acting like a ceiling. Price pushed into it and immediately slowed down. If TSLA can’t reclaim and hold above this area, then the move up starts to look more like a reaction than a trend change.
Above that, 465–470 is the next area where sellers are likely waiting. If price gets there without strong momentum, I’d expect selling pressure again.
On the downside, 445–447 is the first real support. If TSLA loses that area, the chart opens up toward 440, and below that, 435 becomes the next downside magnet.
How the GEX options positioning lines up
Options positioning explains why price is stalling here.
There’s strong CALL interest overhead, which often acts like resistance unless price can push through with volume. At the same time, PUT support sits lower, which helps explain why pullbacks haven’t fully unraveled yet.
This creates a squeeze-like environment: upside is capped for now, downside is supported — until one side gives way.
That’s usually where volatility comes from.
If it keeps getting rejected under 455–460, I’m cautious chasing longs. That’s where I’d expect sellers to lean again.
A clean hold above 460 changes the conversation and opens the door toward 470+.
On the flip side, a loss of 445 would tell me the bounce failed, and downside continuation becomes the higher-probability path.
So for me:
* Below 445 → downside pressure builds
* Between 445–460 → chop, fakeouts likely
* Above 460 with acceptance → bullish continuation attempt
Until price proves otherwise, this still feels like compression under resistance, not a confirmed breakout.
This analysis is for educational purposes only and does not constitute financial advice.
Tesla - Falling DownThe bullish five-wave advance from Apr–Dec 2024 is complete.
Since Dec 2024, Tesla has been in a corrective phase.
Wave A (Dec 2024 - Apr 2025) was a five-wave corrective move.
Wave B (Apr - Oct 2025) formed a clear three-wave correction.
Sub-wave (C) correction is finishing. A brief upside attempt is still possible, but any short-term rise above 489 will likely make the subsequent decline of C deeper.
Tesla is in a major reversal zone.
A large wave C is expected, forming a five-wave impulsive decline to 210 or lower.
Summary:
A 50%+ decline in Tesla shares is expected in 2026.
---
Please subscribe and leave a comment.
You’ll get new information faster than anyone else.
---

Tesla (TSLA) – When the Uptrend Is “Locked In” by the EMA89Hello everyone, this is Domic.
Looking at Tesla’s recent price action on the 4H timeframe, the market is telling a fairly clear story. TSLA is not just moving higher — it is rising in a very “textbook” manner: supported by leading capital flows, reinforced by macro expectations, and confirmed by a constructive technical structure. The approach toward the 490 USD area is therefore not a random spike, but the result of a deliberate accumulation and breakout process.
On the macro layer, the narrative remains familiar yet still valid: expectations that the Fed may begin a rate-cutting cycle next year are driving capital back into growth stocks. Assets that are highly sensitive to “cheaper money,” such as Tesla, naturally become primary destinations for this flow. What stands out is how the capital is participating: volume expands sharply on breakouts, while pullbacks remain shallow and are quickly bought up. This behavior suggests not just retail interest, but clear involvement from active, institutional-style flows.
At the same time, the market appears to be gradually re-pricing Tesla’s growth story. Margins are showing signs of recovery after the aggressive vehicle price cuts, while long-term themes such as FSD and robotaxi continue to be viewed as core drivers that are not yet fully reflected in the stock price. In a broader market recovery, Tesla maintains its role as a central name within the EV sector — a stock that investors find hard to ignore as risk appetite returns.
In short, Tesla is not rising on expectations alone. Price, capital flow, narrative, and structure are all aligned on the same side. And as long as EMA89 continues to hold, this uptrend remains the primary story the market is following.

TSLA LongTsla Long, Breaking of handle to the upside. 440 key support. Personally a close under 466 invalidates the breakout. Entry 477. Target 1 is 520, target 2 is 570. If channel is broken to the downside the Long thesis is completely invalidated.

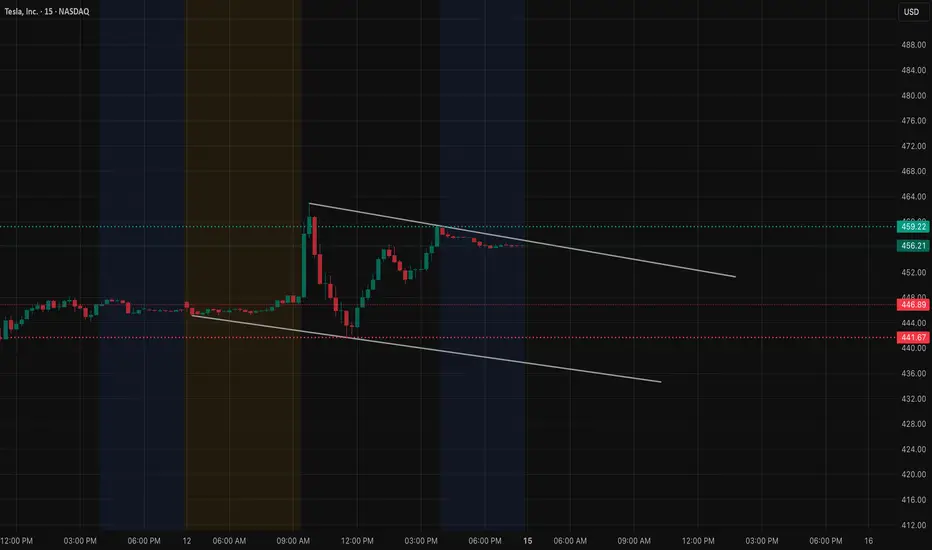
TSLA Dec 12. Compression at a Key Breakout PointTSLA has been consolidating inside a tight compression structure on the 15-minute timeframe, sitting between a rising support line from the midday recovery and a descending trendline from the earlier rejection. Price is now coiling right at the apex of these two lines, which typically sets up a decisive move once the market opens.
The 447.5–448 zone is the immediate intraday pivot. TSLA paused there at the close, and every small push above it was quickly absorbed. As long as price remains beneath the descending trendline, momentum remains neutral-to-bearish within the consolidation.
Above price, the next major supply sits at 450–452. This level caused a sharp rejection earlier in the session and continues to be the key ceiling that sellers defend. A clean break above 448 followed by a hold above 450 would shift momentum in favor of buyers and allow TSLA to challenge the higher levels inside its previous range.
On the downside, the rising trendline around 445–445.5 is the first support. If TSLA loses this line, the next support zone is 443.5–444. Below that, the breakdown opens space toward the lower demand zone around 437–435 where the buyers last stepped in aggressively.
The options landscape (GEX) matches these same transition levels.
The strongest positive gamma concentration sits between 455–457.5, which aligns with the upper resistance zone. This explains why TSLA repeatedly struggled to extend into 452–455 earlier — price was hitting both chart resistance and hedging resistance at the same time.
Before TSLA can reach those levels again, it must reclaim 448–450. If it does, hedging pressure begins to open up, allowing for a smoother path toward 452 and then 455.
On the downside, negative gamma pockets begin around 437–435. These levels align perfectly with the lower structure targets. If TSLA breaks below 445 and slips into these negative gamma zones, volatility tends to expand instead of being dampened. That is the environment where TSLA can slide quickly into 437–435.
This alignment between price structure and GEX creates a clear plan for Dec 12:
• Holding above 447.5 increases the chance of a breakout attempt toward 450
• Reclaiming 450 is the key signal that buyers have regained control, opening targets at 452–455
• Losing 445 shifts control to sellers and targets 444 → 437–435
• Breaking 435 releases deeper negative gamma and increases the chance of sharper downside movement
TSLA is sitting at the very end of a compression pattern. The next clear move through either 450 or 445 should define the direction for tomorrow’s session.
This analysis is for educational purposes only and not financial advice.

Tesla (TSLA) Shares Close at a Record HighTesla (TSLA) Shares Close at a Record High
On Tuesday, 16 December 2025, Tesla shares closed at a new all-time high, breaking above the $488 level.
As a result, TSLA:
→ surpassed its December 2024 peak;
→ is up by roughly 125% from this year’s lows;
→ made Elon Musk the first person in the world whose net worth has exceeded $600 billion.
Why are TSLA shares rising?
Elon Musk has officially confirmed that Tesla has begun testing driverless robotaxis in Austin, Texas, without safety monitors in the vehicle. This marks an important step towards the large-scale deployment of the Robotaxi concept.
Despite a decline in electric vehicle sales in November (following the removal of tax incentives by the new US administration), TSLA shares continue to rise as market participants are pricing in Tesla’s potential dominance in artificial intelligence and autonomous transport — a development that could unlock fundamentally new revenue streams for the company.
Supporting this outlook, several investment banks have raised their price targets for TSLA. For instance, Mizuho analysts lifted their target to $530.
Technical perspective
When analysing TSLA on 12 November, we:
→ identified an ascending channel and a support zone between $360 and $400;
→ suggested that the previous high was limiting bullish momentum, with the market entering a consolidation phase.
Since then (as shown by the blue arrow), TSLA shares:
→ broke out of the consolidation zone;
→ found support near the lower boundary of the ascending channel;
→ resumed their upward trend.
It is worth noting that trading volumes in early December were relatively low — which can be interpreted as a lack of selling pressure. However, the subsequent move into the upper half of the channel was accompanied by a surge in trading activity and the formation of a bullish gap (marked by the black arrow). This signals strong demand, with buyers willing to pay higher prices for a high-quality stock.
Looking ahead, it is possible that:
→ the former resistance at $465 will turn into a new support zone;
→ the current bullish impulse could drive attempts to challenge the psychological $500 level.
This article represents the opinion of the Companies operating under the FXOpen brand only. It is not to be construed as an offer, solicitation, or recommendation with respect to products and services provided by the Companies operating under the FXOpen brand, nor is it to be considered financial advice.

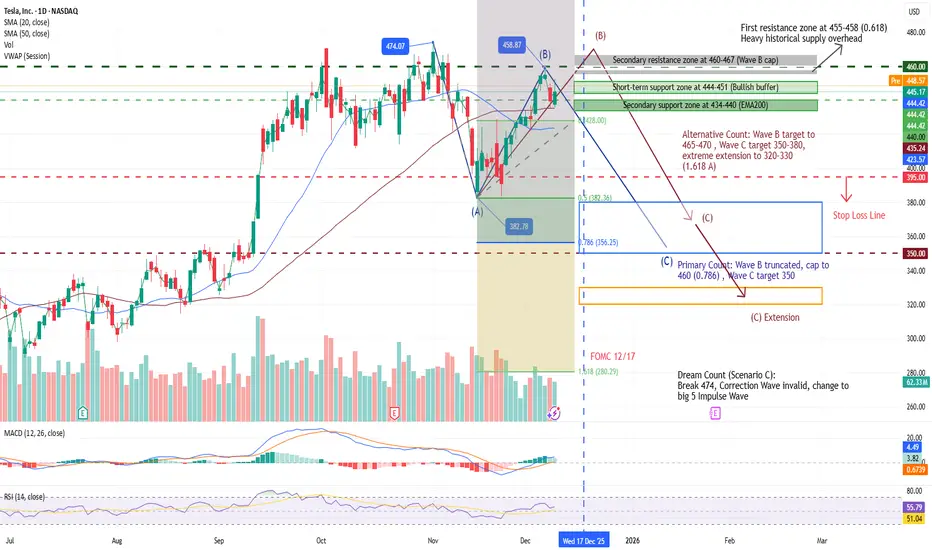
TSLA Elliott Wave Update: B-Wave Truncation at 460 or Extension TSLA Elliott Wave Update: B-Wave Truncation at 460 or Extension to 465?
TSLA's rally from the 383 low has tested the 61.8% Fib at 458, forming a potential B-wave top in the A-B-C correction from the 474 high. EMAs provide dynamic support, but MACD/RSI mild divergence signals momentum fade.
Primary Count: B-wave truncates at 460 (0.786 Fib), capping the rally short; current pullback signals C-wave start, targeting 350 (1.0 extension of A). Volume below 1.5B shares on 455 test reinforces failure—odds of C to 350 rise to 70%. Short-term support at 444-451 (bull buffer).
- Resistance: Primary 455-458 (0.618 Fib + heavy historical supply); Secondary 460-467 (B cap, EMA50 crossover). Volume surge >1.5B needed for break.
- Support: Secondary 434-440 (EMA200 channel low).
- Indicators: MACD (12,26,9) red bars narrowing to 0.32 hints exhaustion; RSI (14) at 68 with bearish divergence warns pullback. Volume MA shows low conviction above 455 (1.3B vs. 1.5B threshold).
Alternative Count: B-wave extends to 465-470 (0.786-1.0 Fib), then C pulls back to 350-380 (1.0 extension) or 320-330 (1.618 A extreme). Probability 25-30%, up on recent strength.
Scenario C: B exceeds 474 on volume >1.5B, invalidating correction for 5-wave impulse: Wave 3 to 520 (1.618x Wave 1, Jan 2026); Wave 5 to 600+ (Q2 2026). Probability 30-35%.
Monitoring: 12/17 FOMC rate cut catalyst.
Disclaimer: This analysis is for educational purposes only and is not investment advice. Please do your own research (DYOR) before making any trading decisions.
Tesla - The triangle is still valid!🎀Tesla ( NASDAQ:TSLA ) can still confirm the breakout:
🔎Analysis summary:
Just two months ago, Tesla perfectly broke out of the major ascending triangle pattern. In the meantime we just witnessed a major consolidation at the all time high. Quite likely that Tesla will soon confirm the breakout, launching another parabolic rally from here.
📝Levels to watch:
$400
SwingTraderPhil
SwingTrading.Simplified. | Investing.Simplified. | #LONGTERMVISION

Tesla Stock explained by Elliott Wave PrinciplesBack in March, Elliott Wave predicted a Bullish move for TESLA to around $500(link below). NASDAQ:TSLA was at around $230 at the time. Furthermore, Elliott Wave predicted that this Bullish move would have 3 Major waves. Fast forward 7 months later and we get a Major 3 wave move shown in Green as A,B and soon C. Elliott Wave is brilliant tool for analysis and helps to understand market dynamics.
With Wave A and B(Green) complete, Wave C expresses itself in 5 Waves namely 1,2,3,4 and 5 shown in Black. Using Elliott Wave Principles CORRECTLY offers precision and insight into the markets. What many term as chaos can actually be patterned. Did you cash in on this move that was predicted in March!?

TSLA - Huge Ascending Triangle to Push New HighsIm seeing this pattern all over gold and silver and now I see it on TSLA
I expect the same outcome as gold with a huge breakout of the triangle to the upside
Weekly timeframe is poised for upside

TSLA – Dec. 17 | Momentum Still Alive, But This Is the Real TestTSLA is still holding bullish structure on the intraday, but price is now pushing into a decision area where both structure and GEX matter.
From the 15-minute chart, the trend remains intact with higher lows after the earlier pullback. Price respected the lower trendline support near the mid-480s and quickly reclaimed the intraday range, which tells me buyers are still active on dips. As long as TSLA holds above the 480–485 zone, the structure favors continuation rather than breakdown.
That said, price is now sitting just below a key supply / resistance pocket, and this is where GEX adds important context.
On the GEX side, the data is clearly skewed bullish:
* Calls dominate the chain (over 70% call flow).
* The highest positive NETGEX / call wall sits near the 495–500 area, which explains why price keeps stalling as it approaches that zone.
* Dealers are likely short gamma above, meaning upside can grind but may struggle to accelerate unless that wall breaks cleanly.
This sets up a very clear map for the session:
* As long as TSLA holds above 480–485, dips are still being absorbed and continuation toward 490 → 495 remains the primary path.
* A clean acceptance above 495 opens the door for a gamma-assisted push toward 500+, where the next major resistance sits.
* Failure to hold 480 flips the tone short-term and exposes a retrace toward 465–455, where PUT support and negative GEX start to thicken.
Right now, this is not a “chase” environment. TSLA is strong, but it’s pressing into a gamma ceiling, which usually means patience pays better than aggression. Either we get a clean breakout with volume and dealer unwind, or we get another rotation back into support before the next attempt higher.
Bottom line:
Bullish bias remains intact, but TSLA is at a level where structure and GEX must align for the next leg. Above 495 = expansion. Below 480 = reset.
This analysis is for educational purposes only and does not constitute financial advice. Always do your own research and manage risk accordingly.

TSLA - Three Potential Paths Within Broad ChannelThis 4H TSLA layout maps out three main scenarios as price trades inside a larger descending channel. The left panel shows a bullish recovery path: after the recent pullback, price holds the mid‑channel area and grinds higher, eventually breaking toward the upper boundary and targeting the 500–540 zone. The projection price are based on historical price action. The green projection reflects a constructive series of higher lows; if that structure holds, the white path illustrates how trend continuation could unfold step‑by‑step.
The right panel focuses on a consolidation / decision zone. Here TSLA is squeezed inside a large rising wedge, with orange lines framing higher lows and higher highs while the broader gray channel still caps the advance. The red and white projected paths highlight how price could continue to ping‑pong within this wedge before a decisive break, either resolving higher into a new leg up or rolling over for a deeper correction. This section emphasizes that repeated tests of both wedge support and resistance are possible before direction becomes clear.
The bottom panel contrasts the current advance with a previous corrective phase. The green parallel channel outlines a prior downtrend where TSLA spent time grinding lower before reversing sharply higher. By overlaying the current price action in red, the chart suggests that a similar corrective channel could develop again if the wedge on the right panel breaks down, opening room for a measured pullback within that green zone before any larger bullish structure resumes. Overall, the chart is meant to visualize a bullish continuation case, a prolonged consolidation case, and a corrective retrace, helping traders plan around all three outcomes rather than fixating on just one.

Tesla Read For More Gains In 2026Tesla has been on the rise since March this year and is now approaching some very important levels around 480, which marks the high from about a year ago. What really matters at this stage is that we have five waves up from 217, which is a very strong bullish structure and suggests more upside ahead, as the market is showing a progressive trend. Because of that, there could be interesting opportunities to join the trend, especially if we see some kind of retracement in 2026. In that case it makes sense to keep an eye on the previous lower-degree wave four support around 483, which could be an attractive area for the next rebound.
An alternate wave count also allows for a triangle to form here, which would again suggest that after a setback into wave E of four we would most likely see more upside. That scenario would remain valid as long as the December 2024 highs are not breached. In general, the best opportunities could show up if we get a retracement into a lower-degree wave two and then look to ride the next strong leg higher, while the market holds above 213.
GH

TSLA: We've been here beforeFor possibly a third time, Tesla will triple its range, just as it has (had?) done twice before.
Dunno when or how long it takes (definitely less than 10 years), but I have faith that we'll see $6800 a share (pre any future splits).
You may come back to this when you need to remember, and comfort yourself during bear cycles.

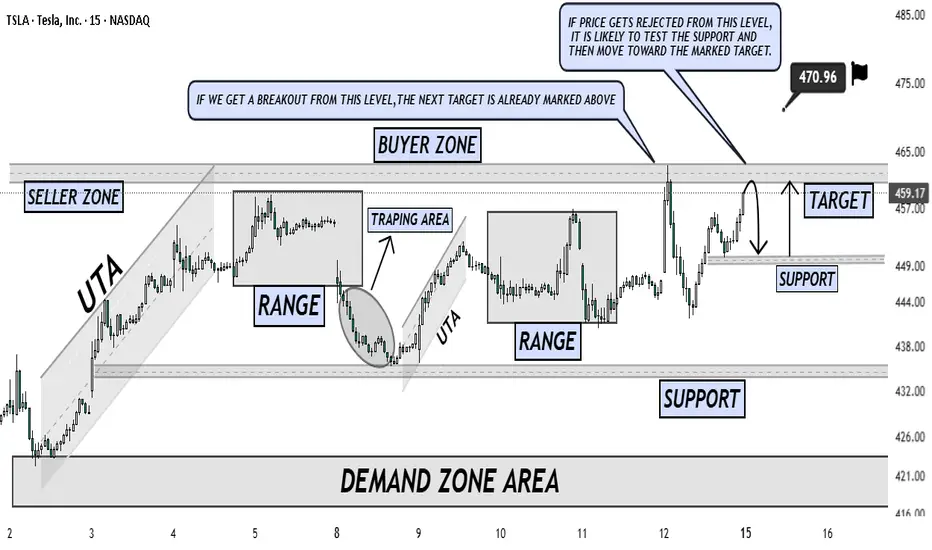
TSLA — Range Structure, Rejection Risk & Breakout Continuation TSLA is currently trading inside a well-defined range after a strong upside move from the demand zone, showing clear market structure with buyer and seller zones in play. Price has already reacted from the upper resistance area, where rejection is possible, indicating that sellers are defending this level aggressively.
If price fails to sustain above the buyer zone and shows rejection, a pullback toward the marked support level is likely, where liquidity and demand could step in before continuation toward the target. However, a clean breakout and acceptance above the resistance zone would invalidate the rejection scenario and open the path toward the next upside target already marked on the chart.
This setup highlights both scenarios clearly: rejection leading to a support retest, or breakout confirming bullish continuation. Patience and confirmation around key levels remain critical for execution.
TESLA BUY/SELL SCENERIOOverall sentiment is showing more downside.
Best way to play this a break above signals long opportunity , while break below for conservative entry signals strong bearish continuation

TESLA BULLISH BREAKOUT|LONG|
✅TESLA strong ICT bullish continuation as price breaks and holds above a key institutional demand level, confirming a valid breakout. Acceptance above prior highs suggests smart money participation, with upside liquidity resting above the range and favoring continuation into premium targets. Time Frame 2H.
LONG🚀
✅Like and subscribe to never miss a new idea!✅

Warren Buffet View on Market + TSLA PositionSo over here, we have done quite a Tesla analysis.
Our view on the markets, where the fear and greed index is and what it is telling us, what the Federal Reserve is doing, and where the market is going based on that.
Also what history has told us when the Fed cuts rates very fast.
If you like this video, give it a like.
And if we reach more than 10 likes, I will give an update on that section.
And share your views in the comments on which next talk or analysis you would like me to do next time.

Garbage Return To the meanCurrent structure suggests distribution at the top of range, with repeated rejections near the upper boundary and higher lows being maintained. While trend is still bullish on a structural basis, price is extended far above long-term trend support, increasing the probability of a return to the mean before any sustained continuation.
TESLADear Traders
small short on 4hrs for tesla but on monthly its so bullish
lets see if it can play
