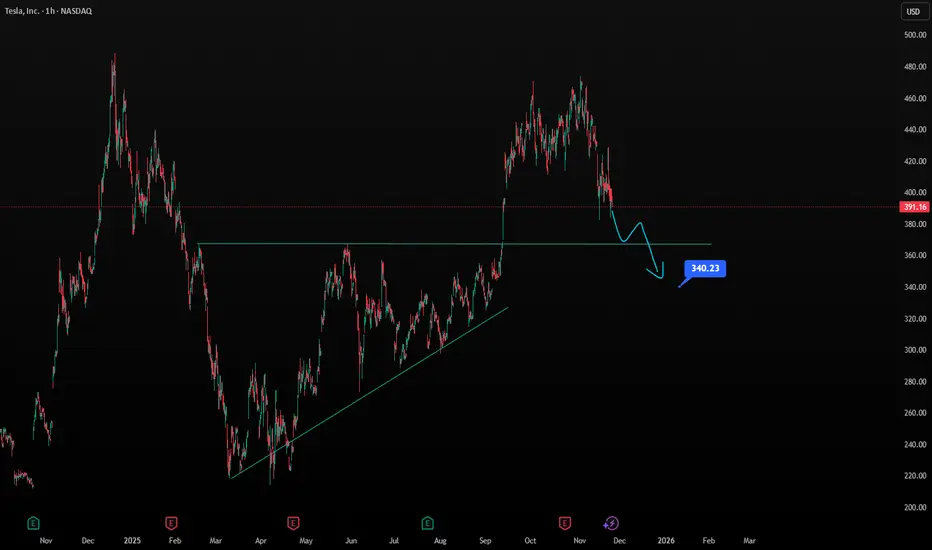
Midterm Stock Forecast for TeslaNASDAQ:TSLA at $391 shows weakening technical structure, suggesting a continuation toward $340. H1 trendlines indicate fading bullish pressure. Fundamentals remain mixed: energy storage grows, but auto margins face pressure and competition intensifies. The $340 zone is a key demand area for potential midterm stabilization.
Tesla, Inc. Shs Cert Deposito Arg Repr 1/15 Sh
No trades
Market insights
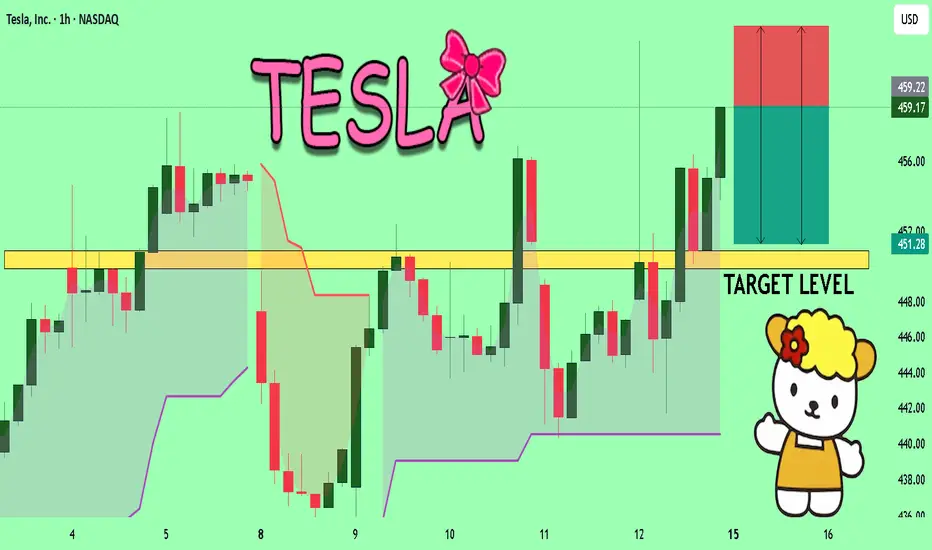
TESLADear Traders
small short on 4hrs for tesla but on monthly its so bullish
lets see if it can play

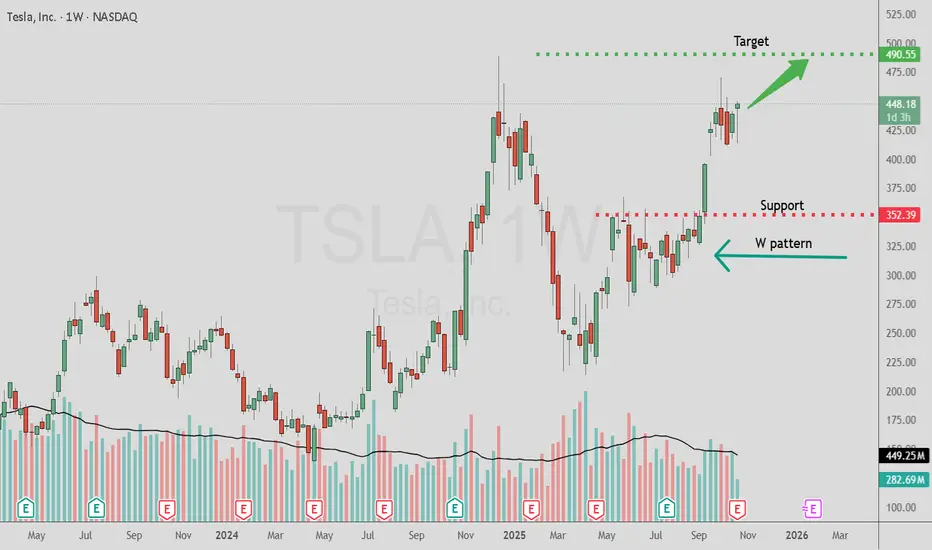
Tesla Has A W Pattern On The WeeklyGood day Tesla fans!
Thought I would publish a post on Tesla due to it's hype and trader fans.
Weekly and monthly have a " W " pattern and with that I measure a move to 490.55 area.
Not saying it will reach but it has the potential based on the pattern despite the negative earnings report.
Caution is advised as even if this area gets reached a sell off could occur afterwards.
Best of luck in all your trades $$$
TESLA Trading Opportunity! SELL!
My dear friends,
Please, find my technical outlook for TESLA below:
The price is coiling around a solid key level - 458.17
Bias - Bearish
Technical Indicators: Pivot Points Low anticipates a potential price reversal.
Super trend shows a clear sell, giving a perfect indicators' convergence.
Goal - 450.88
Safe Stop Loss - 463.89
About Used Indicators:
The pivot point itself is simply the average of the high, low and closing prices from the previous trading day.
Disclosure: I am part of Trade Nation's Influencer program and receive a monthly fee for using their TradingView charts in my analysis.
———————————
WISH YOU ALL LUCK
Double top....TSLA going downBeen watching this for a bit and when I see this level of volatility and double-top forming, we can see that it will drop like a hammer soon. Take TSLZ (inverse). Do your own research! I just made 27% on my last trade, I eat crayons :)

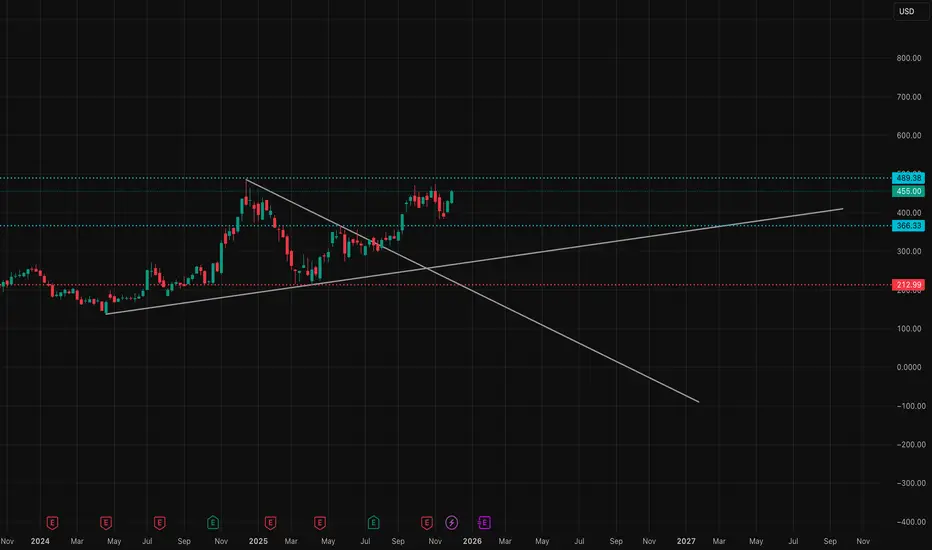
ascending triangle / ascending channelon the higher timeframe tesla has been trading in an ascending triangle, wich has broke out and retested. price target of the ascending triangle would be around $1600
but also trading in an ascending channel wich would face resistance at around $700 by februari 2026.

Tesla (TSLA) Extend Rally to new High, Pullback Should supportedTesla (TSLA) recently advanced to a new all‑time high, underscoring the strength of bullish momentum in the market. The short‑term Elliott Wave analysis indicates that the cycle from the November 14, 2025 low has concluded as a clear impulse structure. From that low, wave 1 terminated at $423.69, followed by a corrective decline in wave 2 that ended at $383.76. The upward progression then resumed, with wave 3 extending to $458.87. A modest pullback in wave 4 concluded at $435.
The final advance in wave 5 reached $496.16, as illustrated on the 45‑minute chart. This marked the completion of wave (1) at a higher degree and simultaneously closed the cycle that began on November 14. After this peak, the stock entered a corrective phase in wave (2), unfolding internally as a zigzag pattern. From the termination of wave (1), wave A of the zigzag is expected to finish soon. A rebound in wave B should follow, setting the stage for another decline in wave C, which would complete the corrective sequence of wave (2). As long as the pivot at $496.16 remains intact, rallies are likely to fail. The broader expectation is for Tesla to extend lower, thereby correcting the entire cycle that originated from the November 14 low.

Tesla to Invest Nearly $1.2 billion Into Battery cell productionTesla, Inc. (NASDAQ: NASDAQ:TSLA ) announced plans to invest nearly €1 billion ($1.2 billion) into battery cell production at its Gruenheide gigafactory in Germany, with output expected to reach up to 8 gigawatt hours annually starting in 2027. The move strengthens Tesla’s vertical integration strategy, allowing battery cells and vehicles to be produced at a single European site. Management highlighted that this structure improves supply chain resilience and positions Tesla more competitively against China and the U.S., despite acknowledging that large-scale battery production remains challenging in Europe due to cost pressures.
Fundamentally, the investment signals Tesla’s long-term commitment to Europe, even as its regional market share has come under pressure. By localizing more of the battery value chain, Tesla aims to reduce reliance on imports, control costs over time, and improve margins once scale is achieved. While near-term financial impact is limited, the strategy supports Tesla’s broader push into energy efficiency, battery innovation, and manufacturing autonomy.
Technically, the chart shows NASDAQ:TSLA trading within a long-term rising channel that has guided price action since early 2023. Shares recently surged toward the upper boundary of this channel near the $490–$500 zone, an area that aligns with prior highs and visible resistance.
The strong rally has pushed price well above the 9-period moving average, signaling extended conditions in the short term. A rejection from the channel top could trigger a pullback toward the $430–$450 support region, where buyers previously stepped in. Conversely, a decisive breakout above channel resistance would open the door toward the $550–$600 range, as projected by the measured move on the chart.
Overall, NASDAQ:TSLA remains structurally bullish, but near-term price action hinges on whether buyers can absorb supply at this critical resistance level.

TSLA Impulse After Multi-Year Correction?Looks like Tesla completed a multi-year correction at $215 in the form of a Running Flat.
If so then the move from $215 to current price could be wave 1 of 3 that could eventually end up around the $900 level.

TESLA TO BTC & TOTALThis analysis compares NASDAQ:TSLA performance relative to BINANCE:BTCUSDT .
As you can see, Tesla’s stock is showing a bullish stance against Bitcoin and appears to be at the beginning of its Elliott Wave 3.
This chart delivers Four key messages:
1.Bitcoin is expected to decline while Tesla moves higher
2.Bitcoin is expected to drop while Tesla moves into a range
3.Both are expected to decline, but Tesla is likely to fall less than Bitcoin
4.Both rise, but Tesla gains more.
I’d be happy if you shared your thoughts.
NASDAQ:TSLA
BINANCE:BTCUSDT
CRYPTOCAP:TOTAL
BINANCE:BTCUSD

Tesla Wave Analysis – 15 December 2025
- Tesla broke key resistance level 460.00
- Likely to rise to resistance level 500.00
Tesla today opened with the sharp upward gap breaking above the key resistance level 460.00 (which has been reversing the price from October).
The breakout of the resistance level 460.00 accelerated the active impulse wave iii of the intermediate impulse wave C from November.
Given the strong daily uptrend, Tesla can be expected to rise to the next round resistance level 500.00 (likely price for the completion of wave iii).

TSLA Short targetsI get my stock levels, and sometimes tickers, from my dowsing work with a pendulum and scales I've made.
I have that TSLA is at a swing high and should head down to the $417 area where it may bounce, and I've had numbers come as lower targets at $398, 399 & 400.
Today I was guided to get the date of a price revisit (which I find fairly reliable as guidance). The date came as 11/17. That was a large range day, but it's an area to watch and there's some meat on the bones even at the top end of the range, $424.
The low of that day was $398, so that's neat it aligns with numbers I've gotten. There is a little bullish energy still in TSLA, but the main thing is it'll keep going down.

TSLA(Tesla) Breaking Out...Can The Break Hold This Time?Tesla is trying to break out of my range once again. We have tried a couple of times and failed so we need to watch and see if this break holds. We do have a gap down to about 460 and then we have the 8MA(453) and the 21MA(441) sitting below for support. It's tough to chase this break so the safe entry would be to wait for a retest of the breakout around 470 or that gap at 460. Any weakness in that area that holds would be great long entries to target 487 and a hold above that level is where I would press longs for 500, 523, 560. A look above and fail at 487 would be a short to test 470, 460 and a hold below 450 is where I would press shorts for 441(21MA), 429(50MA), 415. I'm leaning long until bears show me something back inside the range.
NASDAQ:TSLA

Tesla poised for breakout as bullish momentum builds up
Current Price: $458.96
Direction: LONG
Confidence Level: 68% (Based on clear bullish bias from multiple professional traders, strong call option flow, and price action holding above key EMAs despite mixed sentiment on X)
Targets:
- T1 = $465
- T2 = $475
Stop Levels:
- S1 = $452
- S2 = $440
**Wisdom of Professional Traders:**
I'm seeing the collective consensus from many professional traders leaning bullish on Tesla this week. Several traders highlight strong relative strength compared to the broader market, with repeated mentions of a potential run toward $470 and even $500 if the breakout holds. The wisdom of the crowd here is built on multiple factors: unusual bullish call flow, price holding above the 20‑ and 50‑day EMA, and clear technical formations like cup‑and‑handle and inverse head‑and‑shoulders patterns that traders watch for continuation moves.
**Key Insights:**
Here's what's driving this setup: Tesla just posted a strong Q4 production beat and announced an FSD beta 2.0 rollout for Q1 2026, which traders see as a near‑term catalyst. Across the board, I'm noticing repeated references to 460‑470 as the "battle zone" where Tesla often consolidates before pushing higher. The MACD remains bullish, RSI is elevated but not in reversal territory, and option flow last week was overwhelmingly in favor of calls — 97% call flow versus only 3% puts.
What's interesting is that while some market watchers on X are cautious about valuation (PE > 300), the technical picture from professional traders shows price action defending support zones. The $450‑$452 area has been mentioned as a solid dip‑buy zone by multiple traders, with upside targets in the mid‑$470s this week.
**Recent Performance:**
Tesla is up 2.7% in the last 24 hours, closing strongly above both the 20‑ and 50‑day EMA. Volume came in about 10% above the 30‑day average, suggesting healthy participation. Over the past week, it's tested $465 resistance multiple times without breaking through, consolidating just below it — a common pre‑breakout behavior traders watch closely.
**Expert Analysis:**
Several traders I track have pointed out that Tesla is forming an inverse head‑and‑shoulders pattern around the 460 zone, with higher lows developing over the past few sessions. Others note that the $467‑$470 resistance cluster, once cleared, could quickly open the door to the $475‑$480 range. The unusually large call option purchases targeting $460 and $500 strikes reflect conviction among big players. Momentum indicators (MACD positive, histogram rising) support this bias.
**News Impact:**
The recent production and delivery beat for Q4 2025 has already lifted sentiment, though traders think it's not fully priced in yet. The announcement of the Full‑Self‑Driving beta expansion is being discussed as a major revenue driver, and footage of robo‑taxis running without safety drivers in Austin is helping to build the narrative. Potential regulation issues and valuation stretch are risks, but for this week, the news flow supports sustained bullish interest.
**Trading Recommendation:**
Here's my take: I’d look to enter on a dip toward $452‑$454, aiming for a break above $465 for T1 and riding momentum toward $475 for T2. Keep stops relatively tight below $450 (S1) and more conservative traders can use $440 (S2) as the ultimate fail‑safe level. Given the repeated trader mentions of these levels and strong call activity, this looks like a solid short‑term long trade for the week. Watch for a clean breakout through $467 — it could trigger a fast move to second targets.

THIS TESLA / BTC FRACTAL - IS A MAPThis is an expanded view of today's chart (posted earlier). I wanted to offer a broader context. On this "channel", I'm trying to focus on Tesla & related charts. Since I'm not posting anymore Tesla (single asset) charts, until a new all time high has been reached, I thought I would continue to pose questions in the meantime. Like "what is a fractal, mathematically?"...to encourage you to pull the curtain to the side and see the wizzard behind the curtain.
This isn't OZ, this is a digital casino, that has a casino agenda. If you don't know WHAT that is, and HOW that works, then should you really be investing your money. Until newbies figure that out & learn what is truly governing price action...I will try and provide some maps and share some of my *basic trading ideas with you. Most of all encourage you to educate yourselves and LEARN TA!
For those of you that have & will private message me with requests for shortcut secrets to success, I will ONLY say this.
1-Pick 1 asset
2-Start learning TA now, and apply it ONLY to your 1 asset
3-Study it's price action for 10,000 hrs (about 5 yrs full time)
4-Realize that the same patterns are repeating across all assets.
For those of you that are too busy or unmotivated to study:
If you dont want to work for your money, then how can you expect your money to work for you?
May the Trades be with you.

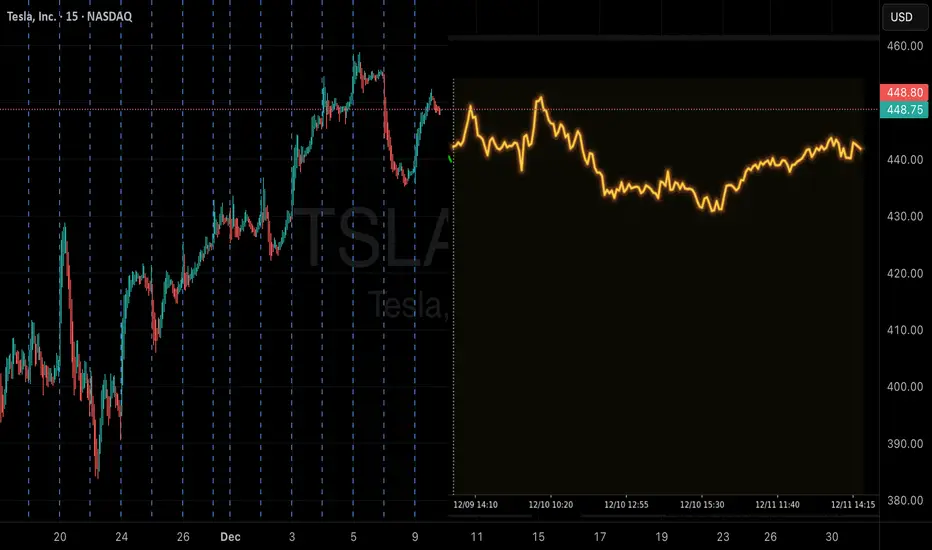
TSLA – Dec 8–12: Breakout or Breakdown Week TSLA – Dec 8–12: Breakout or Breakdown Week (Full Technical Outlook + GEX Insight)
TSLA sits at a major decision point heading into the week. The trend beneath is still constructive, but price is now pressing directly into the 456–474 supply zone, a region that has repeatedly capped upside. How TSLA behaves at this ceiling will determine the tone for the rest of December.
Daily Timeframe (1D)
On the daily level, TSLA continues to build higher lows and defend the broader uptrend. Buyers are still active, and the overall structure remains supportive. However, TSLA is approaching heavy supply without having swept liquidity beneath the trend. When this happens, the market often pauses or pulls back before attempting a real breakout.
The key demand areas beneath current price are 451, 438, 429, and a deeper pool around 422. If TSLA rejects the 456–474 zone, these levels become natural magnets for a retracement. A controlled dip into 451 or 438 would be healthy and may even set the stage for the next breakout attempt.
A daily close above 474 would confirm a significant shift — unlocking a cleaner, less restricted uptrend.
1-Hour Timeframe (1H)
The 1H trend still leans bullish, but momentum has begun to slow as price continues to press into resistance. This often signals that buyers may need to regroup. A dip into 451 or 438 gives the trend room to breathe before trying again.
The key signal to watch intraday is whether TSLA can reclaim and hold 456. Until that happens, upside remains limited. A clean reclaim followed by a shallow retest would show intent and give buyers more confidence.
If TSLA spends too much time struggling below 456, the market is likely preparing for a rotation into lower demand zones.
15-Minute Timeframe (15M)
Intraday structure has tightened into a compression range. This coiling behavior typically appears before a larger directional move, but when it happens right under a major supply zone, it often leads to fake breakouts.
For that reason, the most reliable entries this week will come from either:
* A sweep into 451 or 438, followed by a clear shift in intraday structure
or
* A breakout above 456 that retests and holds
Trading inside the chop offers poor reward and unnecessary risk.
GEX Insight (Options Positioning Driving the Behavior)
Gamma exposure aligns almost perfectly with TSLA’s technical levels.
Above 456, gamma starts to thin out — which reduces dealer hedging pressure and allows cleaner upside movement. If TSLA can break through 474, price enters a low-gamma region where momentum typically accelerates and moves become more directional.
Below 450, the landscape shifts sharply. Put-heavy positioning tends to pull TSLA lower into the same liquidity zones highlighted by the chart: 438, 429, and 422. This adds weight behind any breakdown.
In short:
* Above 456 → upside opens
* Above 474 → momentum becomes much stronger
* Below 450 → pressure toward 438 → 429 → 422
GEX fully supports the technical story this week.
Trading Focus for the Week
The main objective is to avoid chasing strength directly into the 456–474 supply zone. The cleaner trades come from reacting to how TSLA behaves around the key levels.
* Look for buyers at 451 or 438 if price dips early.
* Treat 456 as the first confirmation level for any upside continuation.
* A breakout only matters if TSLA can hold above it.
* Rejecting 456–474 again puts the lower demand zones back in play.
This week favors disciplined, reaction-based trading rather than prediction.
Disclaimer
This analysis is for educational and informational purposes only and does not constitute financial advice. Trading involves risk, and all traders should conduct their own research and apply proper risk management before entering any position.
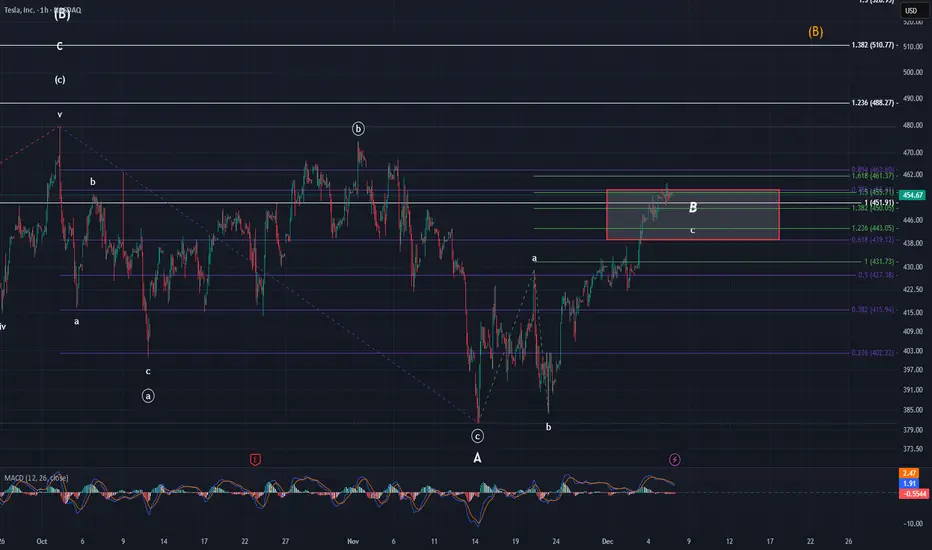
TeslaNothing has changed in regard to my analysis last week. MACD is reset and could support a move higher or lower from here. We have pierced the top side of my target box but have yet to invalidate the white pattern. Orange has risen in probability but remains an ALT count at this time. Looking at the overnight market tonight, price is down by a little over $1. That isn't enough to have any real meaning.
Structure continues to have two different outcomes from here. However, until the white count gets invalidated, it will remain my primary analysis. That happens with a breach of $479.42.
Tesla: Do Converging EMAs Signal a Decisive Moment?Hello everyone, looking at Tesla’s current rebound, my first impression is that the market is entering a rather sensitive “trend-defining zone.” After a strong decline since mid-November, TSLA has finally bounced and climbed above the EMA 34, moving straight into a test of the EMA 89 — where the two moving averages are creating a technically noteworthy confluence area.
In the past few weeks, Tesla consistently stayed below both the EMA 34 and EMA 89 , reflecting a clear and somewhat heavy downtrend. But the current recovery has partially changed the picture: buying momentum has returned strongly enough to push price above the EMA 34 and close in on the EMA 89. This is typically the moment when the market reveals its true intention — either continuing upward to confirm a phase shift, or pausing because buying pressure has not yet matured.
Volume has increased but remains relatively modest, indicating that large capital has not truly stepped in. This makes the 435–440 USD resistance zone a significant challenge: Tesla has been rejected here multiple times, and if buying power lacks depth, price may easily turn downward again.
Wishing everyone effective trading and resilience through every market movement!
TSLA in SELL ZONEMy trading plan is very simple.
I buy or sell when at either of these events happen:
* Price tags the top or bottom of parallel channel zones
* Money flow volume spikes beyond it's Bollinger Bands
So...
Here's why I'm picking this symbol to do the thing.
Price in selling zone at top of channels
Money flow momentum is spiked positive and nearing top of Bollinger Band
Entry at $447
Downside targets are
$370 bottom channel (short time frame)
$390 bottom channel (longer time frame)
$420 moving average
Will be buying NASDAQ:TSLQ

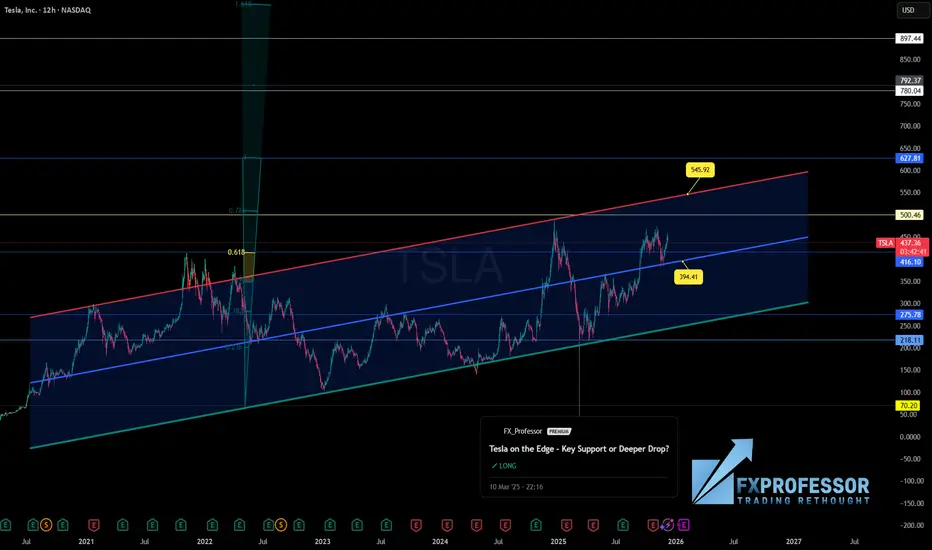
Key Support Worked, but What’s Next for TSLA? 📈 Tesla on the Edge — Key Support Worked, but What’s Next for TSLA? 🔍
Earlier this year, we tagged a textbook support at $218, right on the lower boundary of this macro regression channel — and price respected it beautifully. We’re now trading +100% above that level, just below the $500 psychological barrier and brushing the 0.618 retracement from the all-time high.
Current Key Levels:
• Support: $394.41 and $380.55 — both dynamic mid-channel
• Resistance: $500.46 and upper channel at $545.92
• Fib Golden Ratio: 0.618 zone still acting as macro resistance
Price is clearly in a pause zone — not bearish yet, but no longer early either. The rally from $218 to $440+ matured fast. Momentum may need to cool off unless we get new catalyst fuel.
🔋 Enter the newsflow:
Tesla is pushing hard on a dual front — lower vehicle prices (Model 3 Standard) to protect sales volume, and ambitious bets on AI + autonomy (FSD 14.2, robotaxi rollout). Musk’s recent push to allow "texting while driving" under FSD has regulators watching closely — and so are we.
This means Tesla isn’t just reacting — it’s recalibrating. The market’s trust in these moonshots (robotaxi, Optimus, autonomy) could define the next leg.
Bull Path? Break $500–545 and Tesla could target $627 or even $780+
Bear Path? Lose $394–380 and we likely retest the $275 zone
📉 For now, I expect sideways compression between $380–500 as macro narrative battles chart structure.
Thought of the Day 💡
Most traders get stuck chasing late moves. But if you map the macro channel, learn to wait for value zones, and stay calm when price goes vertical — you’ll separate yourself from the herd. TSLA’s big move already happened. Now comes the patience game.
Disclaimer: What you read here is not financial advice — it’s high-level market philosophy from the FXPROFESSOR himself. Risk is real, and your capital is your responsibility. Learn, adapt, evolve.
TSLA Weekly Options Signal — Strong Call Flow, Moderate RiskTSLA QuantSignals V3 Weekly 2025-12-09
📈 TSLA Trading Info — Weekly Signal (2025-12-09)
BUY CALLS
Confidence: 60% (Medium Conviction)
Risk Level: Moderate — consider reduced size
🔢 Options Setup
Strike: $450.00
Expiry: 2025-12-12 (3 days)
Entry Range: $8.40 – $8.50
Target 1: $13.50
Target 2: $16.90
Stop Loss: $5.50
Position Size: 2%–3% of portfolio
📊 Market Conditions
Current Price: $450.74
Weekly Momentum: Neutral (+0.65%)
2-Week Trend: +3.28% (bullish)
VWAP Support: $446.84
Resistance: $458.87
Support: $435.00
PCR (Put/Call Ratio): 0.48 (Strongly Bullish Flow)
🤖 Katy AI
Trend: Neutral
Confidence: 50%
Bias: Slow upward drift toward $453.89 (+0.70%)
📰 News Sentiment
Piper Sandler → Overweight, $500 price target
Positive sector sentiment
Institutional “whale” activity in consumer discretionary
Bullish TSLA trading articles trending
🔥 Flow Intel
PCR 0.48 = heavy call buying
Strong upside interest at $480C
Flow strongly supports bullish setup
⚠️ Key Notes
Mixed signals: AI neutral, flow strongly bullish
MACD bearish divergence → short-term pullback risk
Weekly options = high gamma → watch position closely
Scaling in is recommended due to moderate risk
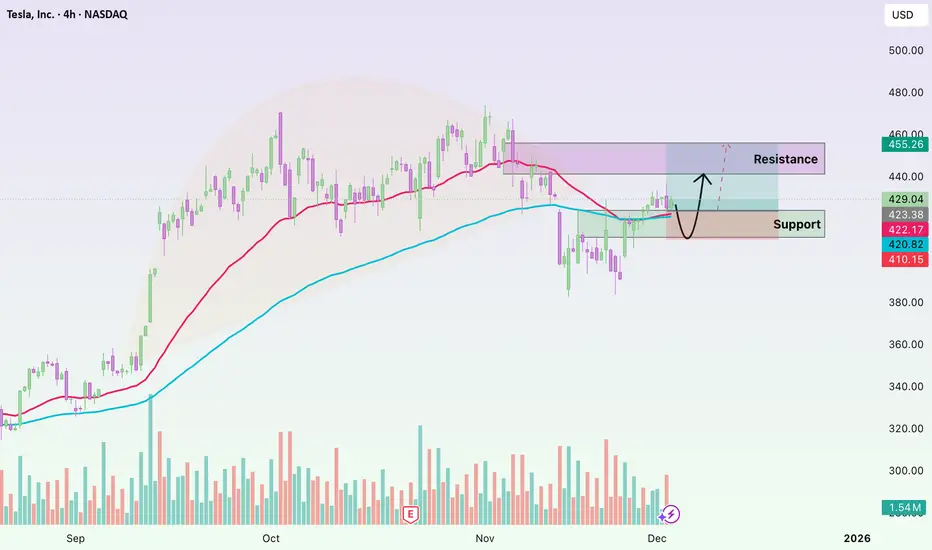
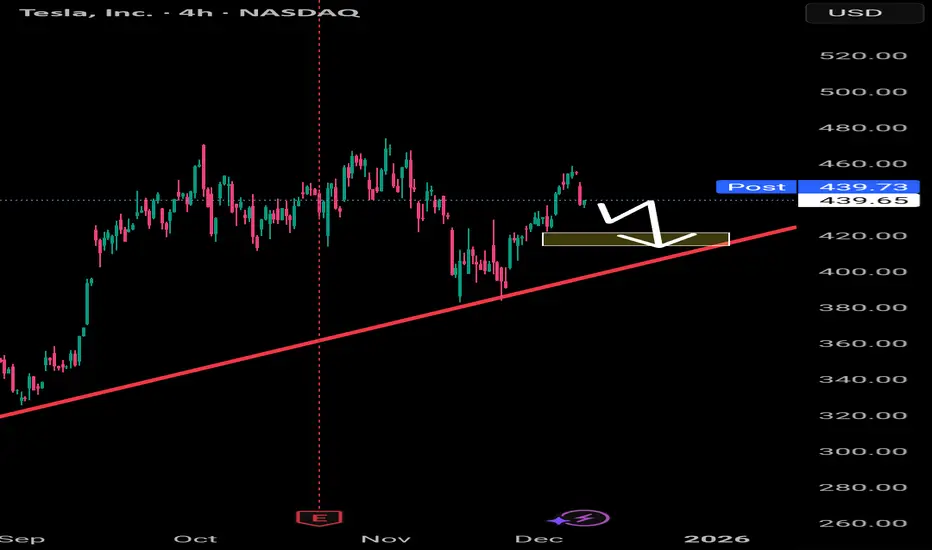
Tesla (4H) – Detailed Trendline Structure AnalysisTesla (4H) – Detailed Trendline Structure Analysis
Tesla is currently moving within a well-defined ascending structure, supported by a strong red trendline that has been respected multiple times since the beginning of the rally. This trendline has acted as the backbone of the bullish momentum, guiding every major higher low in the chart.
Right now, price is trading around 439, showing signs of slowdown after failing to create a strong continuation to the upside. The candles are starting to lose momentum, and the distance between price and the trendline has narrowed — a classic sign that the market may seek liquidity lower before deciding the next major move.
Because of this price behavior, a pullback toward the support zone near 420 is highly likely.
The 420 level is important for three reasons:
Trendline Support:
The ascending red trendline intersects almost perfectly near 420, making it a natural magnet for price to retest.
Historical Reaction Area:
Previous swing highs and lows around 420 create a clean structure of liquidity, making it a level the market likes to revisit.
Bullish Structure Validation:
As long as Tesla stays above 420, the 4H bullish trend remains intact.
A strong bounce from this zone would confirm continuation toward the 470–480 region.
Tesla Wave Analysis – 8 December 2025- Tesla reversed from pivotal resistance level 464.00
- Likely to fall to support level 420.00.
Tesla recently reversed up from the resistance zone between the pivotal resistance level 464.00 (which has been reversing the price from October) and the upper daily Bollinger Band.
The downward reversal from this resistance zone stopped the previous short-term impulse wave iii of the sharp C-wave from November.
Given the strength of the resistance level 464.00 and the overbought daily Stochastic, Tesla can be expected to fall to the next support level 420.00.
