Tesla to Invest Nearly $1.2 billion Into Battery cell productionTesla, Inc. (NASDAQ: NASDAQ:TSLA ) announced plans to invest nearly €1 billion ($1.2 billion) into battery cell production at its Gruenheide gigafactory in Germany, with output expected to reach up to 8 gigawatt hours annually starting in 2027. The move strengthens Tesla’s vertical integration strategy, allowing battery cells and vehicles to be produced at a single European site. Management highlighted that this structure improves supply chain resilience and positions Tesla more competitively against China and the U.S., despite acknowledging that large-scale battery production remains challenging in Europe due to cost pressures.
Fundamentally, the investment signals Tesla’s long-term commitment to Europe, even as its regional market share has come under pressure. By localizing more of the battery value chain, Tesla aims to reduce reliance on imports, control costs over time, and improve margins once scale is achieved. While near-term financial impact is limited, the strategy supports Tesla’s broader push into energy efficiency, battery innovation, and manufacturing autonomy.
Technically, the chart shows NASDAQ:TSLA trading within a long-term rising channel that has guided price action since early 2023. Shares recently surged toward the upper boundary of this channel near the $490–$500 zone, an area that aligns with prior highs and visible resistance.
The strong rally has pushed price well above the 9-period moving average, signaling extended conditions in the short term. A rejection from the channel top could trigger a pullback toward the $430–$450 support region, where buyers previously stepped in. Conversely, a decisive breakout above channel resistance would open the door toward the $550–$600 range, as projected by the measured move on the chart.
Overall, NASDAQ:TSLA remains structurally bullish, but near-term price action hinges on whether buyers can absorb supply at this critical resistance level.
Market insights

Garbage Return To the meanCurrent structure suggests distribution at the top of range, with repeated rejections near the upper boundary and higher lows being maintained. While trend is still bullish on a structural basis, price is extended far above long-term trend support, increasing the probability of a return to the mean before any sustained continuation.
Tesla Faces Key Resistance — Pullback Targets in FocusThis 2-hour TSLA chart highlights price rejection from a major resistance zone near the highs. After a strong upward channel, momentum shows signs of cooling as price slips below recent support. The Ichimoku Cloud suggests weakening bullish control opening the door for a potential pullback.
Target 1: Around $444 — first key support and short-term reaction level
Target 2: Around $389 — deeper support aligned with prior consolidation
Overall, the chart suggests a pause or corrective move unless price can reclaim and hold above the resistance zone.

Double top....TSLA going downBeen watching this for a bit and when I see this level of volatility and double-top forming, we can see that it will drop like a hammer soon. Take TSLZ (inverse). Do your own research! I just made 27% on my last trade, I eat crayons :)

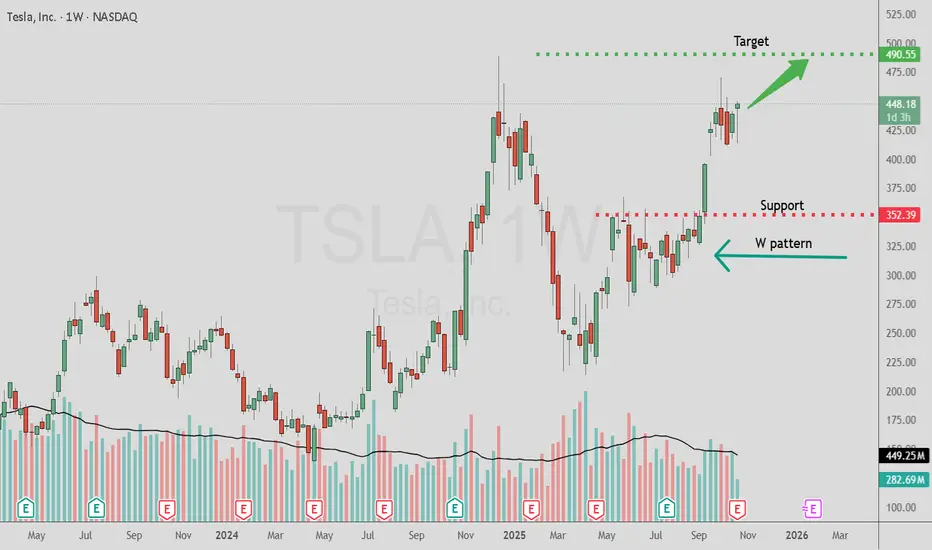
Tesla Has A W Pattern On The WeeklyGood day Tesla fans!
Thought I would publish a post on Tesla due to it's hype and trader fans.
Weekly and monthly have a " W " pattern and with that I measure a move to 490.55 area.
Not saying it will reach but it has the potential based on the pattern despite the negative earnings report.
Caution is advised as even if this area gets reached a sell off could occur afterwards.
Best of luck in all your trades $$$
ascending triangle / ascending channelon the higher timeframe tesla has been trading in an ascending triangle, wich has broke out and retested. price target of the ascending triangle would be around $1600
but also trading in an ascending channel wich would face resistance at around $700 by februari 2026.

TESLA Trading Opportunity! SELL!
My dear friends,
Please, find my technical outlook for TESLA below:
The price is coiling around a solid key level - 458.17
Bias - Bearish
Technical Indicators: Pivot Points Low anticipates a potential price reversal.
Super trend shows a clear sell, giving a perfect indicators' convergence.
Goal - 450.88
Safe Stop Loss - 463.89
About Used Indicators:
The pivot point itself is simply the average of the high, low and closing prices from the previous trading day.
Disclosure: I am part of Trade Nation's Influencer program and receive a monthly fee for using their TradingView charts in my analysis.
———————————
WISH YOU ALL LUCK
TSLA (Tesla) – H1 Analysis..TSLA (Tesla) – H1 Analysis (According to my chart)
Market Structure
Overall trend was bullish, price respected the ascending trendline + Ichimoku cloud.
Price is now rejecting from the top and showing bearish correction signs.
Breakdown below short-term support suggests deeper pullback.
---
📉 Sell Scenario
Sell Zone: 480 – 490
🎯 Targets
Target 1: 420
Target 2: 370
---
❌ Invalidation
A strong H1 close above 500 will invalidate the sell setup.
---
📌 Summary
Trend: Bullish (higher TF)
Current Move: Bearish correction
Expectation: Price to drop toward marked demand zones (Target Points)

TSLA Dec 12. Compression at a Key Breakout PointTSLA has been consolidating inside a tight compression structure on the 15-minute timeframe, sitting between a rising support line from the midday recovery and a descending trendline from the earlier rejection. Price is now coiling right at the apex of these two lines, which typically sets up a decisive move once the market opens.
The 447.5–448 zone is the immediate intraday pivot. TSLA paused there at the close, and every small push above it was quickly absorbed. As long as price remains beneath the descending trendline, momentum remains neutral-to-bearish within the consolidation.
Above price, the next major supply sits at 450–452. This level caused a sharp rejection earlier in the session and continues to be the key ceiling that sellers defend. A clean break above 448 followed by a hold above 450 would shift momentum in favor of buyers and allow TSLA to challenge the higher levels inside its previous range.
On the downside, the rising trendline around 445–445.5 is the first support. If TSLA loses this line, the next support zone is 443.5–444. Below that, the breakdown opens space toward the lower demand zone around 437–435 where the buyers last stepped in aggressively.
The options landscape (GEX) matches these same transition levels.
The strongest positive gamma concentration sits between 455–457.5, which aligns with the upper resistance zone. This explains why TSLA repeatedly struggled to extend into 452–455 earlier — price was hitting both chart resistance and hedging resistance at the same time.
Before TSLA can reach those levels again, it must reclaim 448–450. If it does, hedging pressure begins to open up, allowing for a smoother path toward 452 and then 455.
On the downside, negative gamma pockets begin around 437–435. These levels align perfectly with the lower structure targets. If TSLA breaks below 445 and slips into these negative gamma zones, volatility tends to expand instead of being dampened. That is the environment where TSLA can slide quickly into 437–435.
This alignment between price structure and GEX creates a clear plan for Dec 12:
• Holding above 447.5 increases the chance of a breakout attempt toward 450
• Reclaiming 450 is the key signal that buyers have regained control, opening targets at 452–455
• Losing 445 shifts control to sellers and targets 444 → 437–435
• Breaking 435 releases deeper negative gamma and increases the chance of sharper downside movement
TSLA is sitting at the very end of a compression pattern. The next clear move through either 450 or 445 should define the direction for tomorrow’s session.
This analysis is for educational purposes only and not financial advice.

TESLADear Traders
small short on 4hrs for tesla but on monthly its so bullish
lets see if it can play

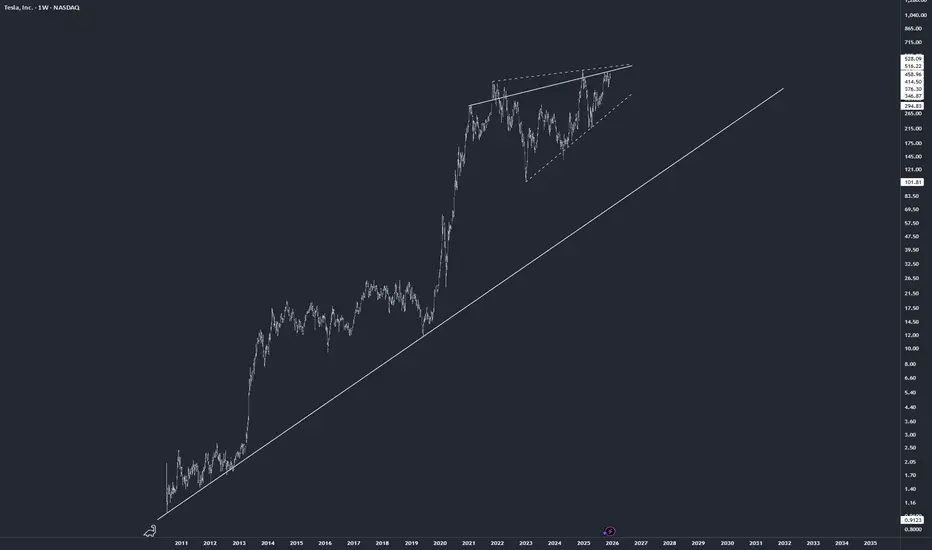
TSLA Impulse After Multi-Year Correction?Looks like Tesla completed a multi-year correction at $215 in the form of a Running Flat.
If so then the move from $215 to current price could be wave 1 of 3 that could eventually end up around the $900 level.

Warren Buffet View on Market + TSLA PositionSo over here, we have done quite a Tesla analysis.
Our view on the markets, where the fear and greed index is and what it is telling us, what the Federal Reserve is doing, and where the market is going based on that.
Also what history has told us when the Fed cuts rates very fast.
If you like this video, give it a like.
And if we reach more than 10 likes, I will give an update on that section.
And share your views in the comments on which next talk or analysis you would like me to do next time.

Tesla Wave Analysis – 15 December 2025
- Tesla broke key resistance level 460.00
- Likely to rise to resistance level 500.00
Tesla today opened with the sharp upward gap breaking above the key resistance level 460.00 (which has been reversing the price from October).
The breakout of the resistance level 460.00 accelerated the active impulse wave iii of the intermediate impulse wave C from November.
Given the strong daily uptrend, Tesla can be expected to rise to the next round resistance level 500.00 (likely price for the completion of wave iii).

TSLA at ATH - long term continuation vs pullback scenarioTSLA is trading at its all-time high after a strong 2025 uptrend.
The structure remains bullish, but at ATH it makes sense to map out both continuation and pullback scenarios.
On the higher timeframe, price action resembles a broad triangle pattern formed during 2024–2025.
Bullish continuation:
A clean acceptance above the $490–500 resistance zone would likely open the door for further upside.
Based on measured move projections:
• Short-term expansion (~25%) toward ~$590
• Mid-range (~70%) toward ~$700
• Full triangle height (~115%) toward ~$750
Pullback scenario:
A pause or corrective move from ATH wouldn’t be surprising before continuation.
Potential pullback areas include the recent swing low, or a deeper liquidity sweep into the $380–400 zone followed by a recovery.
As long as price holds above the rising green trendline, the higher timeframe bullish structure remains intact.

TSLA:Quadruple Witching Day Update:Wave 3 ExtensionvsTruncation TSLA Quadruple Witching Day Update: Wave 3 Extension vs Truncation – Key Level 474 Decides
TSLA Elliott Wave Update – Quadruple Witching Day (December 19, 2025)
Good morning folks! Here's the latest Elliott Wave analysis for Tesla (TSLA) on this high-volatility Quadruple Witching Day.
Primary Count (Bullish – ~60% probability)
We remain in a larger-degree Wave (3) impulse from the 2025 lows. The rally from the November low (~383) has invalidated the prior A-B-C corrective view after breaking above 474.
Current status: Extending Wave 3 with sub-wave structure intact.
Key targets:
• Secondary resistance zone at 488-500 – break on high volume accelerates momentum.
• Final Blue Box target for Wave 3 top: 515-520.
• Subsequent Wave 5 extension: 550-620.
Quad witching gamma hedging and year-end Santa Rally support upside resolution if 455-458 short-term support holds.
Alternative Count (Bearish – ~40% probability)
Failure to sustain above 474 confirms Wave 3 truncation at the 495 ATH.
This triggers a deeper Wave 4 correction targeting the extreme area at 435-450.
Witching-hour sell-off or pinning to lower strikes (e.g., 450 max pain) could accelerate the decline.
A compensatory extended Wave 5 (550-620) is still expected after the Wave 4 bottom, offering a high-reward dip-buy opportunity.
Key Levels to Watch Today
Upside: Break and hold 488-500 → bullish confirmation.
Downside: Breakdown below 474 (especially with expanding volume) → activates alternative count.
Critical support zone: 455-458 – must hold for primary scenario.
Volatility will be elevated today – watch volume direction in the witching hour. Stay disciplined!
Disclaimer: This analysis is for educational purposes only and is not investment advice. Please do your own research (DYOR) before making any trading decisions.

TSLA Will Go Lower! Short!
Take a look at our analysis for TSLA.
Time Frame: 1h
Current Trend: Bearish
Sentiment: Overbought (based on 7-period RSI)
Forecast: Bearish
The market is on a crucial zone of supply 483.11.
The above-mentioned technicals clearly indicate the dominance of sellers on the market. I recommend shorting the instrument, aiming at 463.90 level.
P.S
We determine oversold/overbought condition with RSI indicator.
When it drops below 30 - the market is considered to be oversold.
When it bounces above 70 - the market is considered to be overbought.
Like and subscribe and comment my ideas if you enjoy them!

The TeXas Chainsaw MassacrePE Ratio is 298 and Elon can barely even deliver on most of his outlandish promises.
No further explanation. If it goes higher its because of manipulation.
Fair value is $20 per share.

TSLA(Tesla) Breaking Out...Can The Break Hold This Time?Tesla is trying to break out of my range once again. We have tried a couple of times and failed so we need to watch and see if this break holds. We do have a gap down to about 460 and then we have the 8MA(453) and the 21MA(441) sitting below for support. It's tough to chase this break so the safe entry would be to wait for a retest of the breakout around 470 or that gap at 460. Any weakness in that area that holds would be great long entries to target 487 and a hold above that level is where I would press longs for 500, 523, 560. A look above and fail at 487 would be a short to test 470, 460 and a hold below 450 is where I would press shorts for 441(21MA), 429(50MA), 415. I'm leaning long until bears show me something back inside the range.
NASDAQ:TSLA

Tesla poised for breakout as bullish momentum builds up
Current Price: $458.96
Direction: LONG
Confidence Level: 68% (Based on clear bullish bias from multiple professional traders, strong call option flow, and price action holding above key EMAs despite mixed sentiment on X)
Targets:
- T1 = $465
- T2 = $475
Stop Levels:
- S1 = $452
- S2 = $440
**Wisdom of Professional Traders:**
I'm seeing the collective consensus from many professional traders leaning bullish on Tesla this week. Several traders highlight strong relative strength compared to the broader market, with repeated mentions of a potential run toward $470 and even $500 if the breakout holds. The wisdom of the crowd here is built on multiple factors: unusual bullish call flow, price holding above the 20‑ and 50‑day EMA, and clear technical formations like cup‑and‑handle and inverse head‑and‑shoulders patterns that traders watch for continuation moves.
**Key Insights:**
Here's what's driving this setup: Tesla just posted a strong Q4 production beat and announced an FSD beta 2.0 rollout for Q1 2026, which traders see as a near‑term catalyst. Across the board, I'm noticing repeated references to 460‑470 as the "battle zone" where Tesla often consolidates before pushing higher. The MACD remains bullish, RSI is elevated but not in reversal territory, and option flow last week was overwhelmingly in favor of calls — 97% call flow versus only 3% puts.
What's interesting is that while some market watchers on X are cautious about valuation (PE > 300), the technical picture from professional traders shows price action defending support zones. The $450‑$452 area has been mentioned as a solid dip‑buy zone by multiple traders, with upside targets in the mid‑$470s this week.
**Recent Performance:**
Tesla is up 2.7% in the last 24 hours, closing strongly above both the 20‑ and 50‑day EMA. Volume came in about 10% above the 30‑day average, suggesting healthy participation. Over the past week, it's tested $465 resistance multiple times without breaking through, consolidating just below it — a common pre‑breakout behavior traders watch closely.
**Expert Analysis:**
Several traders I track have pointed out that Tesla is forming an inverse head‑and‑shoulders pattern around the 460 zone, with higher lows developing over the past few sessions. Others note that the $467‑$470 resistance cluster, once cleared, could quickly open the door to the $475‑$480 range. The unusually large call option purchases targeting $460 and $500 strikes reflect conviction among big players. Momentum indicators (MACD positive, histogram rising) support this bias.
**News Impact:**
The recent production and delivery beat for Q4 2025 has already lifted sentiment, though traders think it's not fully priced in yet. The announcement of the Full‑Self‑Driving beta expansion is being discussed as a major revenue driver, and footage of robo‑taxis running without safety drivers in Austin is helping to build the narrative. Potential regulation issues and valuation stretch are risks, but for this week, the news flow supports sustained bullish interest.
**Trading Recommendation:**
Here's my take: I’d look to enter on a dip toward $452‑$454, aiming for a break above $465 for T1 and riding momentum toward $475 for T2. Keep stops relatively tight below $450 (S1) and more conservative traders can use $440 (S2) as the ultimate fail‑safe level. Given the repeated trader mentions of these levels and strong call activity, this looks like a solid short‑term long trade for the week. Watch for a clean breakout through $467 — it could trigger a fast move to second targets.

Tesla - The triangle is still valid!🎀Tesla ( NASDAQ:TSLA ) can still confirm the breakout:
🔎Analysis summary:
Just two months ago, Tesla perfectly broke out of the major ascending triangle pattern. In the meantime we just witnessed a major consolidation at the all time high. Quite likely that Tesla will soon confirm the breakout, launching another parabolic rally from here.
📝Levels to watch:
$400
SwingTraderPhil
SwingTrading.Simplified. | Investing.Simplified. | #LONGTERMVISION

TESLA TO BTC & TOTALThis analysis compares NASDAQ:TSLA performance relative to BINANCE:BTCUSDT .
As you can see, Tesla’s stock is showing a bullish stance against Bitcoin and appears to be at the beginning of its Elliott Wave 3.
This chart delivers Four key messages:
1.Bitcoin is expected to decline while Tesla moves higher
2.Bitcoin is expected to drop while Tesla moves into a range
3.Both are expected to decline, but Tesla is likely to fall less than Bitcoin
4.Both rise, but Tesla gains more.
I’d be happy if you shared your thoughts.
NASDAQ:TSLA
BINANCE:BTCUSDT
CRYPTOCAP:TOTAL
BINANCE:BTCUSD

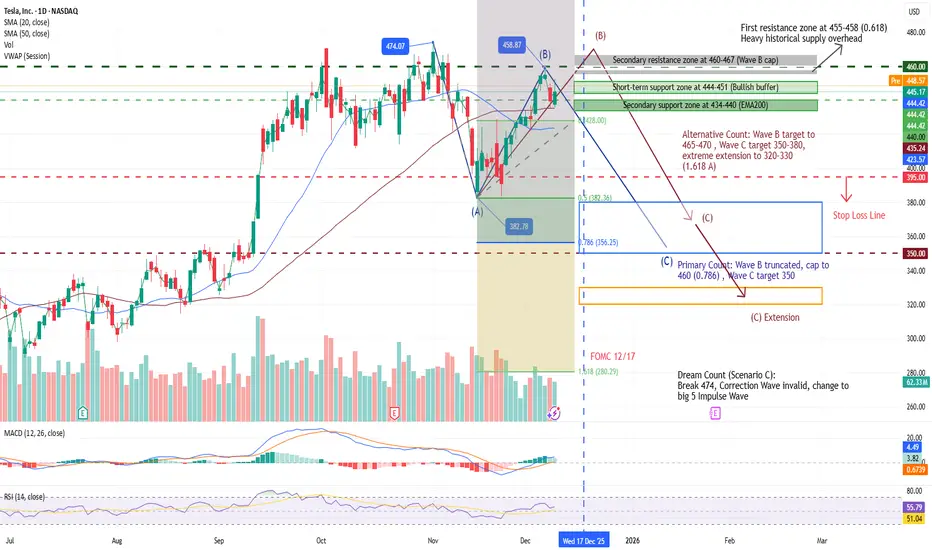
TSLA Elliott Wave Update: B-Wave Truncation at 460 or Extension TSLA Elliott Wave Update: B-Wave Truncation at 460 or Extension to 465?
TSLA's rally from the 383 low has tested the 61.8% Fib at 458, forming a potential B-wave top in the A-B-C correction from the 474 high. EMAs provide dynamic support, but MACD/RSI mild divergence signals momentum fade.
Primary Count: B-wave truncates at 460 (0.786 Fib), capping the rally short; current pullback signals C-wave start, targeting 350 (1.0 extension of A). Volume below 1.5B shares on 455 test reinforces failure—odds of C to 350 rise to 70%. Short-term support at 444-451 (bull buffer).
- Resistance: Primary 455-458 (0.618 Fib + heavy historical supply); Secondary 460-467 (B cap, EMA50 crossover). Volume surge >1.5B needed for break.
- Support: Secondary 434-440 (EMA200 channel low).
- Indicators: MACD (12,26,9) red bars narrowing to 0.32 hints exhaustion; RSI (14) at 68 with bearish divergence warns pullback. Volume MA shows low conviction above 455 (1.3B vs. 1.5B threshold).
Alternative Count: B-wave extends to 465-470 (0.786-1.0 Fib), then C pulls back to 350-380 (1.0 extension) or 320-330 (1.618 A extreme). Probability 25-30%, up on recent strength.
Scenario C: B exceeds 474 on volume >1.5B, invalidating correction for 5-wave impulse: Wave 3 to 520 (1.618x Wave 1, Jan 2026); Wave 5 to 600+ (Q2 2026). Probability 30-35%.
Monitoring: 12/17 FOMC rate cut catalyst.
Disclaimer: This analysis is for educational purposes only and is not investment advice. Please do your own research (DYOR) before making any trading decisions.
THIS TESLA / BTC FRACTAL - IS A MAPThis is an expanded view of today's chart (posted earlier). I wanted to offer a broader context. On this "channel", I'm trying to focus on Tesla & related charts. Since I'm not posting anymore Tesla (single asset) charts, until a new all time high has been reached, I thought I would continue to pose questions in the meantime. Like "what is a fractal, mathematically?"...to encourage you to pull the curtain to the side and see the wizzard behind the curtain.
This isn't OZ, this is a digital casino, that has a casino agenda. If you don't know WHAT that is, and HOW that works, then should you really be investing your money. Until newbies figure that out & learn what is truly governing price action...I will try and provide some maps and share some of my *basic trading ideas with you. Most of all encourage you to educate yourselves and LEARN TA!
For those of you that have & will private message me with requests for shortcut secrets to success, I will ONLY say this.
1-Pick 1 asset
2-Start learning TA now, and apply it ONLY to your 1 asset
3-Study it's price action for 10,000 hrs (about 5 yrs full time)
4-Realize that the same patterns are repeating across all assets.
For those of you that are too busy or unmotivated to study:
If you dont want to work for your money, then how can you expect your money to work for you?
May the Trades be with you.
