UPST UPST UPSTDidn't quite hit my buy box that I called out last week, but it broke out of it's trend line yesterday and held in PM. If it holds today and it hit it's low at 310.2, next resistance is 384.2, 430.3, and 504.85.
Trade ideas

UPST - log scale tracking countThis is just to keep track of the movement. Its so i dont forget what i was thinking in a few weeks
Looks like we might see a last push to 450 before dropping back down.

UPST to $420, LET'S GO!UPST chart
Looks great, I would buy under $315 on Nov 2nd or 3rd.
If trend breaks, wait for the HH to enter.

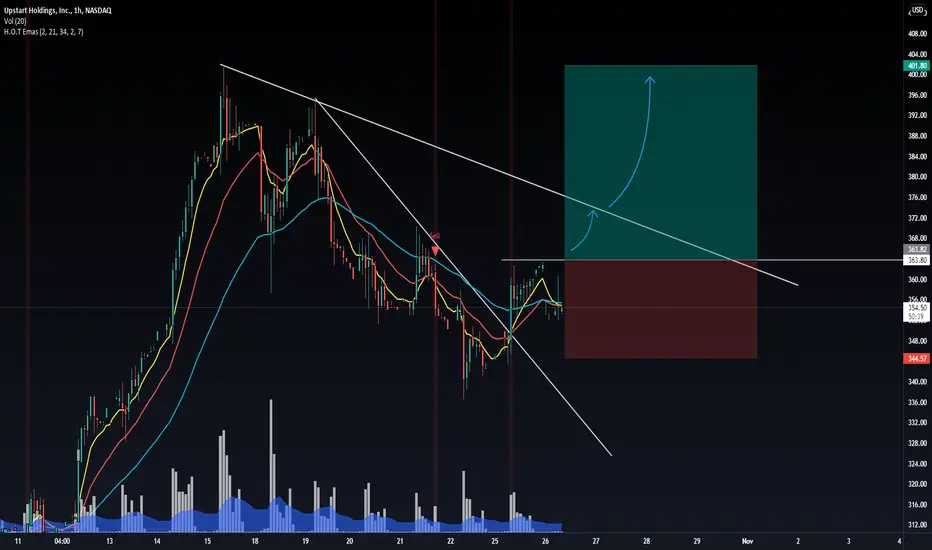
$UPST looks ready $UPST looking for it to break that $337 resistance area and make a move back above the 20 EMA. Beyond that i expect it to re-test all time highs.

UPST-- Time to go shortUPST-- bearish territory started. Might go down in waves. But the descend is on. The wild ride or more than 1000% gains since the beginning of the year are about to end.
There will be a profit-taking cycle happening.
Few data points,
1) 9 EMA crossing below 23 EMA
2) Price is not able to break above the trendline from recent highs. Forming lower lows on daily
3) Price is not able to break above 9EMA recently on 4hr and daily
4) 333 is acting as resistance from the left shoulder of the H&S pattern.... and in the distribution phase, as per stock cycles
If you follow this chart, it is matching to the textbook representation of stock cycles. Will it go down before ER or after?
Note: ER is on Nov 9th. It is time to watch this one. What do you guys think?

UPST 30m Wolfe Wave BullishUPST 30m Wolfe Wave Bullish, a Wolfe Wave is a chart pattern composed of five wave patterns in price that imply an underlying equilibrium price. Investors who use this system time their trades based upon the resistance and support lines indicated by the pattern

Upstart looking weak I pointed out with arrows the 2 signs of weakness I see.
1st.. When dealing with channels , a sign of weakness is when the stock can no longer reach channel top.
2nd. The volume on a green day was lower than average. that's always a sign the big money has exited a bubble. as seen on 10/25.
if 327 doesn't hold, we're headed back to 50sma

UPST - Ready To Reclaim All Time HighUPST - Bullish reversal .Broke the falling wedge.
It may reclaim the ATH Soon .

UPST possible pullback, regression channelHello everyone! UPST is now in the resistance zone of this regression channel in the daily chart. I think we can experience a pullback to the $340 in the upcoming weeks. Remember that the trend is your friend, that's why I'll not short UPST for now. NASDAQ:UPST
Not a financial advisor. Just my personal opinion. Enjoy your weekend.

UPST - 10.24.2021UPST has been on strong uptrend, displayed by the expanding EMAs..
Falling wedge on daily to the 21 EMA, and previous ATH breakout area (Prior resistance = future support)...
Can be seen more clearly on the 65min or 195 min chart...
Use a breakout out of the falling wedge or 350-354 area as your entry...
Risk = 336-345 area...

UPSTHere is my preferred count on Upstart, however, where Wave 4 of C ends is harder to predict, anywhere from $280-336.
Another pattern to consider is the 20 MA has been a strong buy indicator, so I will be watching that level of $332.


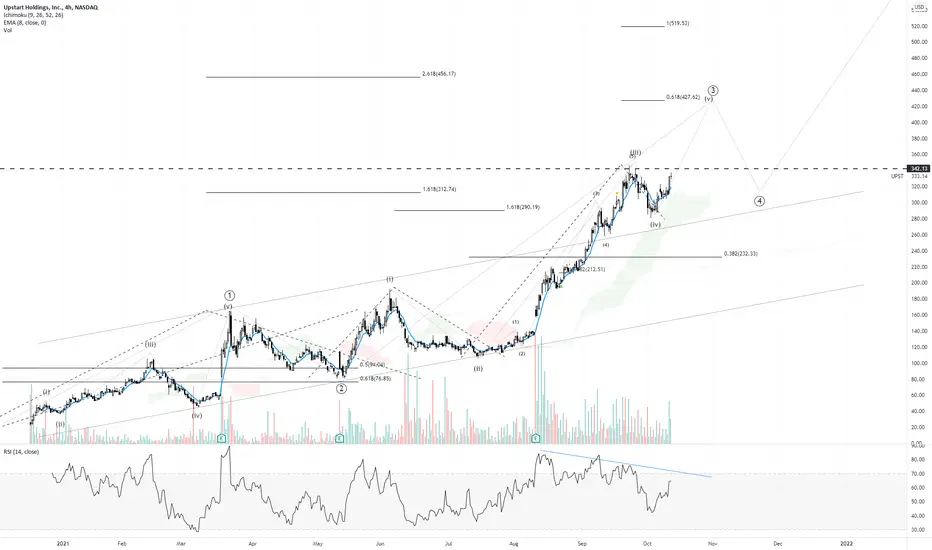
UPST Projections.These aren't accurate to time but to patterns visible on the monthly and weekly time frames.
UPST is following the Elliot Wave cycle and so far, Wave 3 is in the extension zone. I project a completion of the extension into earnings and a retracement for wave 4 anytime after that. Once that retracement is done, wave 5 will push us even higher. My current timeline is between now and 08/2022 for the cycle to complete.
Always do your own DD and pls add any corrections or comments to this thought.


Probably A Little ExtendedUpstart originated $2.8B in loans this most recent quarter. The current valuation assumes annual originations of well over $120B annually.
If you own Upstart, you are assuming traditional banks willingly cede loan originations to this company, and that Upstart originates ~18% of ALL PERSONAL AND AUTO loans annually. Both of the above are outrageous assumptions.
Also, from a technical standpoint, this thing is as overbought as they get.
Tough to short via puts, and man is there risk in short shares, but the bat seems REALLY high on this setup.

UPST- CUP pattern break out
Broke up the Cup pattern .
MACD - Bullish. Wait for the Follow through day.


Upstart Move UpdatedThis Basically shows the potential for the Upstart to boom above $400, as it is in an uptrend for long-term holders. In my opinion, one more dip to $325-$330 will be there and if it won't go below that level of support then it will go up for a restest at the level shown. Even if it breaks below that will be for the short term, so consider it as an opportunity to buy. just an example.

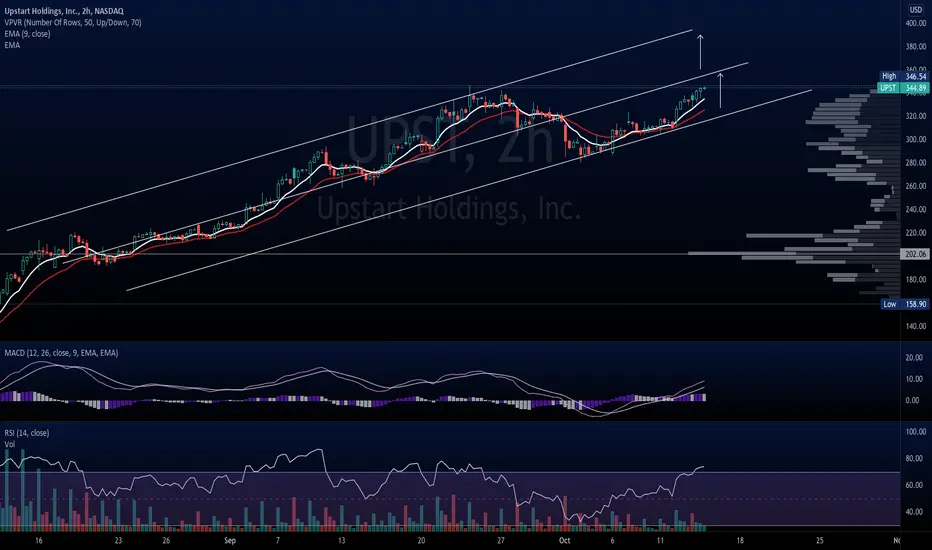
UPST: Continuation UPST Bull Case. Strong price action over 20ma, 50ma; Preserving oscillation in channel from lower deviation. Momentum indicators favorable for auction higher.
Upst inverted H&S This was one of the fastest corrections to take place this fall. Now, Looks good to heading back to ATH at 346

Revised Target UPSTShared this when it was $195 and looks like we still have more upside on this. Break of $346 will take it above $400 before having a meaningful correction.