VISA on my watchlistFrom doing all these analysis
looks like we have might have a bit of room for bullish rally until we really hit those dangerous sell off zones
Watching closely to see if it can do another bounce off 200MA
looking for bounce confirmation and violating of pivot line for a short daily swing
Trade ideas


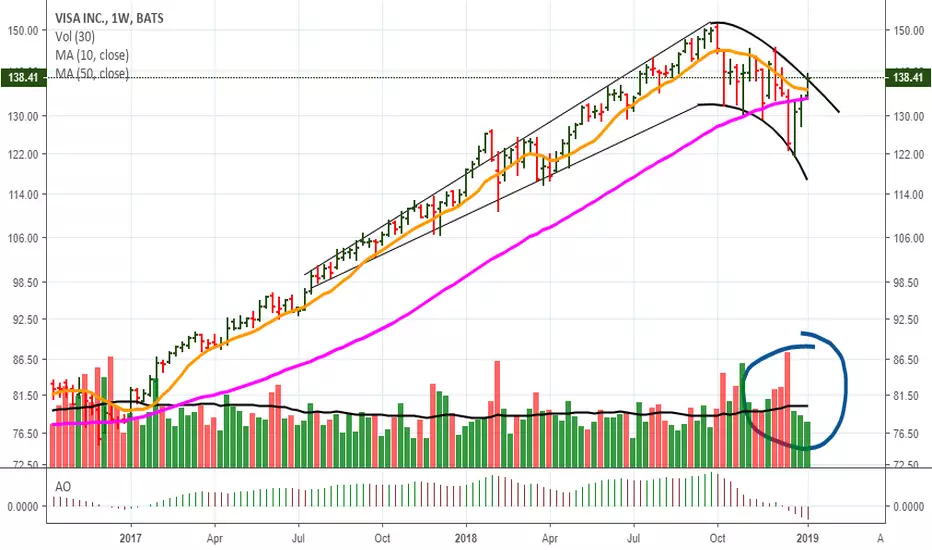
Broken Upper Channel Turns into SupportUpper Descending channel have been broken after a few tries, and going for a return move (finding back the upper channel line as a support).
Aggressive traders can wait till it bounces back on the upper channel, and long term buyers can start accumulating from here before adding more later once the price movement is confirmed.
Stochastics shows that it is currently oversold, prepare to add when stochastics <80.


Popped yesterday, consolidated, now moving out of bull flag $V is wandering up and out of this zone. Lookin bullish

Visa V Short-term one year daily chart
Resistance
Level 1 - $145
Level 2 - $155
Level 3 - $170
Support
Level 1 - $130 Mild Strength
Level 2 - $120 Moderate Strength
Level 3 - $110 Mild Strength
Level 4 - $90 Moderate Strength
NYSE:V
Long-term five year weekly chart:
Both charts show a similar pattern emerging.


VISA INC. (V): More Dips About To Come?Find Winning Trades In Seconds >> efcindicator.com (Special Discount)
The immersed crossing (white bar) indicated a strong bear flag, which was confirmed next. It seems that we have not yet reached the end of this correction.


V SwingMy quant model predicts
Profitability: it has a high probability(73%) to rebound at this level.
Worst Case: it could drop to $121.08
Money Management: Bet no more than 38% of capital
Suggested Strategy: long stock for 5 Days

Uphill Battle for VisaVisa has a lot of hurdles ahead if it wants to go higher.
A bear trend line has formed from the all-time high and the lower high on October 17th.
Today's high was rejected on the trend line.
Today's price also failed to break the upper heavy volume profile around $140.50.
Today's price was rejected at the 4hr 200 EMA.
The 50 EMA has crossed the 100 EMA.
Continued failure of the bear trend line shows that bears are in full control and there isn't a reason to be a buyer of Visa.
If this month's momentum continues downward and price continues to be suppressed under the recent bear trend line, the 2 year upward channel is going to be under attack. A test of the major upward channel will also line up with the 4hr 400 EMA and be near the low on the October 11th. If those areas don't hold the price, Visa is in big trouble since they would then become major resistance.
A failure of the major channel, recent low and 4hr 400 EMA could take Visa down to the low $120 range.
The $120 serves as a target for a few reasons:
It's a heavy volume profile area in the heart of the major flag from Jan-April 2018
The trend line from the top of the major flag from Jan-April 2018 would be retested.
A significant gap would be filled from late April.
All of this is pending the recent bear trend line doesn't get broken.
Price action up above the bear trend line means this play is no longer a short.
It would then become neutral until price tells us more information, first being if the 4hr 50, 100 and 200 EMA can be broken and held.
Then we wait to see if a new all-time high can be broken, tested and held.
A test of the all-time high is only 8% away. Not worth the risk at this point considering the downside potential.

Dow Stocks Visa (V)As a new company it is hard to see how the 08 crash can be translated , so I took Mastercard @ 50% and American Express @ 84%

