WELLS FARGO | Historical Bounce Setup at $88 Critical Support?Wells Fargo missed revenue expectations this quarter, reinforcing the same top-line weakness seen across US banks. While EPS was supported through cost discipline, the lack of revenue growth points to slowing loan demand and tighter credit conditions.
When viewed alongside JPMorgan’s EPS and revenu
Wells Fargo & Company Shs Cert Deposito Arg Repr 0.2 Shs
No trades
Key facts today
1,575 ARS
26.58 T ARS
153.85 T ARS
About Wells Fargo & Company
Sector
Industry
CEO
Charles William Scharf
Website
Headquarters
San Francisco
Founded
1852
IPO date
Dec 10, 1962
Identifiers
2
ISIN ARDEUT110434
Wells Fargo & Company is a bank holding company. The Company is a diversified financial services company. It has three operating segments: Community Banking, Wholesale Banking, and Wealth and Investment Management. The Company offers its services under three categories: personal, small business and commercial. It provides retail, commercial and corporate banking services through banking locations and offices, the Internet and other distribution channels to individuals, businesses and institutions in all 50 states, the District of Columbia and in other countries. It provides other financial services through its subsidiaries engaged in various businesses, including wholesale banking, mortgage banking, consumer finance, equipment leasing, agricultural finance, commercial finance, securities brokerage and investment banking, computer and data processing services, investment advisory services, mortgage-backed securities servicing and venture capital investment.
Related stocks

Wells Fargo Earnings Play — High-Confidence Call Alert!WFC Earnings Signal | 2026-01-13
Direction: BUY CALLS
Confidence: 78% (High)
Expiry: Jan 16, 2026 (3 days)
Strike: $87.50 (Deep ITM)
Entry: ~$6.95
Target 1: $10.42 (+50%)
Target 2: $13.90 (+100%)
Stop Loss: $5.21 (‑25%)
Position Size: 4% of portfolio
Why Trade:
WFC has a 100% earnings beat record

Wells Fargo Rose 33% in 2025. Here's Its Chart Ahead of EarningsWells Fargo NYSE:WFC rose more than 20% in the past three months and 32.7% in 2025, beating the S&P 500 SP:SPX in both time periods. What does its chart and fundamental analysis say as the bank prepares to release Q4 results?
Let's take a look:
Wells Fargo's Fundamental Analysis
Earnings se

WFC Wells Fargo & Company 1Y Chart Review - What's NextToday you can review the technical analysis idea on a 1Y linear scale chart for Wells Fargo & Company (WFC).
It seems there is some action going on here with WFC reviewing the Fibonacci, Trends, and RSI. This may be a concern.
If you enjoy my ideas, feel free to like it and drop in a comment. I lo

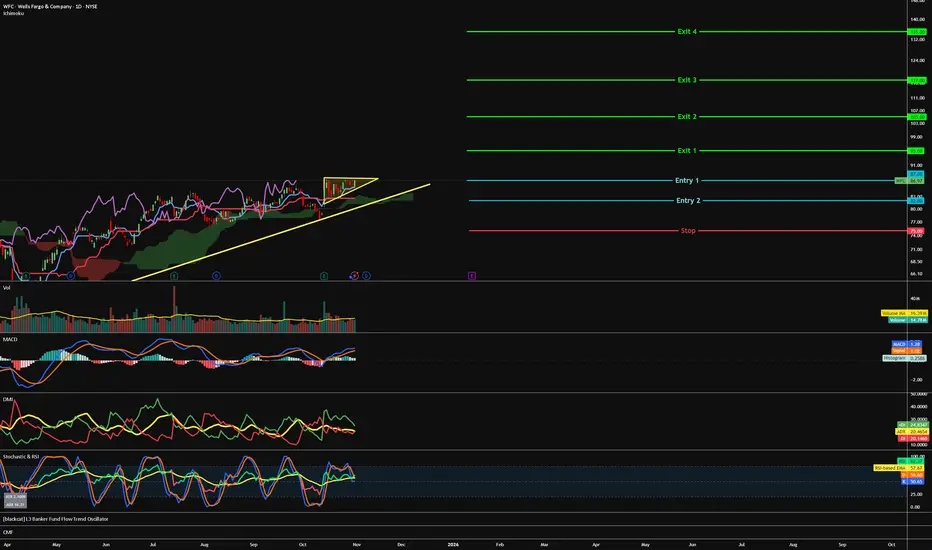
WFC - Ascending to the top=======
Volume
=======
- Neutral
==========
Price Action
==========
- Ascending triangle
- Supported on uptrend line
=================
Technical Indicators
=================
- Ichimoku
>>> price above cloud
>>> Green kumo expanding
>>> Tenken - Above clouds & Lagging & pointing up
>>> Chiku -
US banks on shaky ground Macro conditions are turning hostile. The commercial real estate market, especially office, is structurally impaired in certain segments. Vacancy rates in major US metros are above 20%. Office prices are down 30–40% from their 2022 peaks. With over $1.2 trillion in CRE debt maturing by 2027, refinan

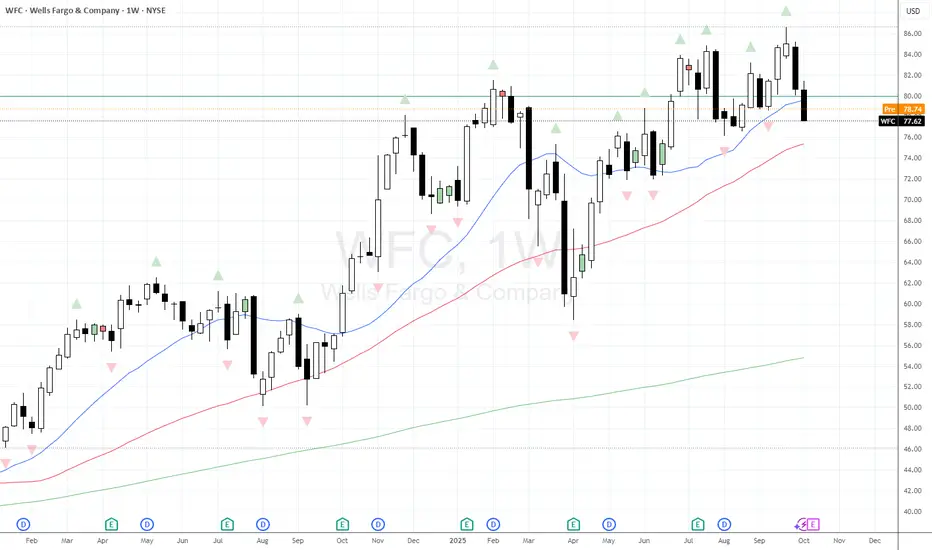
$WFC following through on weekly evening starLike other financial companies the sheen has come off #WFC recent chart. Even before Fridays market tantrums we saw price printing a weekly bearish evening star, and then last week we closed beneath the Weekly 20MA. Will WFC earning tomorrow provide fuel for a move lower, or rescue this decline? Wat
$WFC🚨 Now that the Fed has lifted Wells Fargo’s asset cap, we might see more liquidity enter the markets.
This move could unlock growth & spark bullish momentum for the stock. 📈💵

Wells Fargo Beat the S&P 500 Over 12 Months. What Its Chart SaysWells Fargo NYSE:WFC will report earnings next week at a time when the banking giant's stock recently hit an all-time high and is beating the S&P 500 SP:SPX on a one-year and five-year basis, but trailing more recently. What does the stock's technical and fundamental analysis show?
Let's check

$WFC Call Alert – Oct 31 ’25 $80 Calls | 57% ROI PotentialEnter: NYSE:WFC OCT 31 2025 $80 CALLS
Buy in Price: $2.78 - $2.80
Take Profit: $4.36
Stop Bleeding: $2.45
ROI Potential: 57%
Exit Within: 311 Minutes

See all ideas
Summarizing what the indicators are suggesting.
Oscillators
Neutral
SellBuy
Strong sellStrong buy
Strong sellSellNeutralBuyStrong buy
Oscillators
Neutral
SellBuy
Strong sellStrong buy
Strong sellSellNeutralBuyStrong buy
Summary
Neutral
SellBuy
Strong sellStrong buy
Strong sellSellNeutralBuyStrong buy
Summary
Neutral
SellBuy
Strong sellStrong buy
Strong sellSellNeutralBuyStrong buy
Summary
Neutral
SellBuy
Strong sellStrong buy
Strong sellSellNeutralBuyStrong buy
Moving Averages
Neutral
SellBuy
Strong sellStrong buy
Strong sellSellNeutralBuyStrong buy
Moving Averages
Neutral
SellBuy
Strong sellStrong buy
Strong sellSellNeutralBuyStrong buy
Displays a symbol's price movements over previous years to identify recurring trends.