$XOM with a neutral outlook following its earnings #Stocks The PEAD projected a neutral outlook for $XOM after a positive under reaction following its earnings release placing the stock in drift A
If you would like to see the Drift for another stock please message us. Also click on the Like Button if this was useful and follow us or join us.
Exxon Mobil Corp Shs Cert Deposito Arg Repr 0.1 Shs
No trades
Trade ideas


XOM (NYSE) - BullishGreetings
Humbled, we would like to thanks for your support who has already liked, commented and followed us. Your support, strengthens us, to help in analyzing the market. If you have any questions, do not be hesitant to send us message (inbox). Our Service : Signal recomendation, Trading Course, Portofolio Consultation for multi asset such as Stock, FX, Derivative, Crypto, etc. If u are newbie on the stock market, do not be hesitant to contact me at Private Message. Our Job is to make u Prof trader and proftable trader.
Strategy
- Please care for Money Management
- Have a good psychology
- Do not be hurry to open position
- Evaluate and upgrade your trading plan
XOM (NYSE) - Bullish

XOM position maybe closed todayAfter a good run in my portfolio it may be time to switch horses back from XOM in some of the Tech Stocks coming back again.
Trying to sell and switching to more promising stocks next week.

Exxon Short and Long Term ChannelLong term bullish channel, with inside short term channel tracking.

$XOM Leap play $XOM Leap play that I am in
Huge block orders were coming in with some great long term UOA as well as very bullish inside buys. Loved the chart and figured money would start to transfer out of treasury bonds due to high rates and into blue chip dividend stocks.

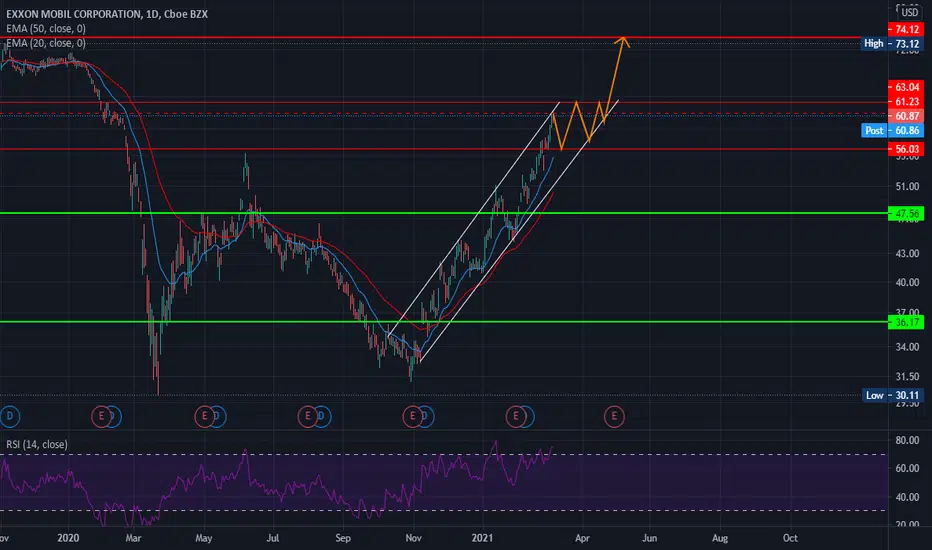
XOM, XOM, XOMWill XOM first do a little consolidation here in the channel before breakout, or will first make breakout and retesting before "touch the sky" on approx. 74,12 is up to see.
Time will show the right way.
* Support and resistance level are on monthly chart.
:)
NYSE:XOM
Exxon Mobil broke out of the double bottom pattern with volumeNYSE:XOM broke out of the double bottom pattern. Any pullback is a buying opportunity, the stock is now targeting 79.76$, stop daily close below 50 MA.
Hit the like button and follow if you find this useful :)
This is only my own view and not financial advice, do your own analysis before buying or selling
Happy Trading!

Exxon could be on for a big move given oil's big movementExxon has been moving a lot nicer then the asx stocks, and with oil punching above and closing above $66 on the weekly, oil share prices could be in for a decent move next week. Coincide this with the 1.9 trillion stimulus, i feel like a lot of money will be moved into commodities, especially oil. *as well as bitcoin, because its the future.* ;)
Ive never bought anything other then asx stocks, but i feel this could be a safe bet for the next few months with a stop loss at $54.

Quite the Run on XOMNot saying this one is "special" to me, but I think I will always remember the day on March 20 (three days before bottom) when I bought my first 9 shares of XOM at near 30$. Not sure where it goes, but I can see myself continuing to hodl my now 100 shares for a while. As always, I should have bought more while down there, but DCA as we've gone up and down has worked out to make this part of my portfolio. Fairly nice yield also at the prices that I've purchased.

Upward momentumIt seems large-cap grey beards are sustaining runs during this sell-off. Plausible third green day and breakout of the long-term upward wedge. 3/5 61 or 62c.


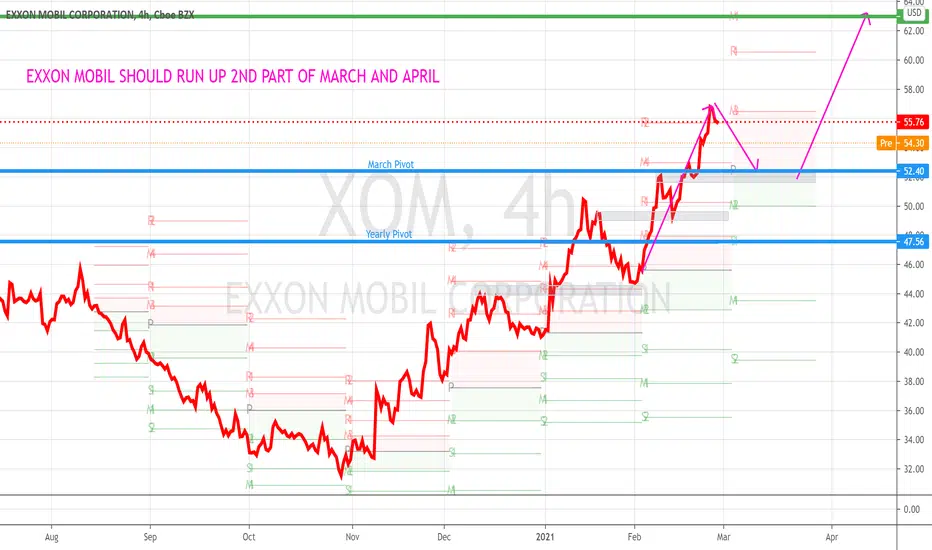
XOM Seasonal advanceOil is undervalued.
XOM is relatively strong compared to SHELL & BP.
XOM did not make a LL while SHELL & BP did.
Chevron is strongest and leading the way.
End March and April are seasonally bullish months for XOM.


head and shoulders bottomTrading an Inverse Head and Shoulders Conservatively
An investor can wait for the price to close above the neckline; this is effectively waiting for confirmation that the breakout is valid. Using this strategy, an investor can enter on the first close above the neckline. Alternatively, a limit order can be placed at or just below the broken neckline, attempting to get an execution on a retrace in price. Waiting for a retrace is likely to result in less slippage; however, there is the possibility of missing the trade if a pullback does not occur.

