XOM short : back to the supportXOM has been tackled by Morgan Stanley (versus Chevron), I claim the stock will go down to its las support
Exxon Mobil Corp Shs Cert Deposito Arg Repr 0.1 Shs
No trades
Trade ideas

$XOM C&H Breakout / Golden Cross$XOM C&H Breakout / Golden Cross. Looking for a close above $82.00 for confirmation. Note upcoming ER late April.
See chart for possible near term targets.
Note: Informational, not investment advice.


Dividend Capture Strategy for easy cash flowDividend Capture strategy for easy cash flow on XOM
Exxon Mobil pays .82 per share quarterly and the ex-dividend date is this Friday (2/8/2019) the dividend pay date is on 3/11/19. So yearly Will get $3.28 (.82x4)for a dividend yield of 4.4% not bad.
But by selling the ATM Put for $1.02 I will increase the premium plus dividend paid for the year to $4.30 and increase the yield to 5.77%. That alone is an improvement of 31%.
If I don't get assigned I get to keep the premium and make over $500 in a couple of days and if I do get assigned then I will sell some calls to keep reducing my basis and improve my yield even more.
The Trade: XOM
Sold 5 ATM Puts @ 74.5 for $1.02
4 days to expiration

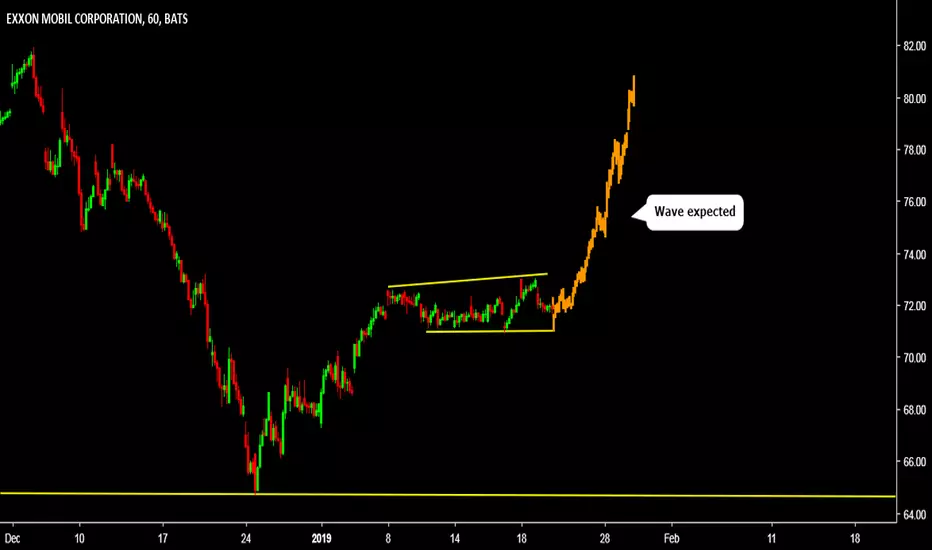
Elliott Wave View Expects Exxon Mobil To RallyElliott Wave view in Exxon Mobil (ticker: XOM) suggests that the rally from December 26, 2018 low ($64.65) is unfolding as Elliott Wave zigzag. The first leg of the zigzag ended at $73.33 on January 18, 2019 high as wave A. A zigzag is a 5-3-5 structure and wave A should unfold in 5 waves in impulse or diagonal. We can see in the chart below that wave ((iii)) of A ended at $73, wave ((iv)) of A ended at $71.95, and wave ((v)) of A ended at $73.33.
The stock then pullback in wave B with the internal as a zigzag Elliott Wave structure as well. Down from $73.33, wave ((a)) ended at $70.64, wave ((b)) ended at $72.27, and wave ((c)) ended at $70.37. Wave C rally has started and the stock is expected to break above wave A at $73 and could see as high as $79 when wave A = C. To gain confirmation for this view, the stock still needs to break above $73. Otherwise, technically we still can’t rule out a double correction in wave B. Near term, while pullback stays above $73.33, expect Exxon Mobil to extend higher.


A huge short opportunity if resistance fail $XOM$XOM has retraced some of it's loses but is facing a strong upside resistance, downside support Rejection from here is opening a huge profit space.

XOM BUY (EXXON MOBIL CORPORATION)Hi there. Price is forming a continuation pattern to the upside. Wait for the price to hit the bottom of the pattern and watch strong price action for buy.

EXXON MOBIL CORPORATION (XOM): A Reversal Is On The Way?Find Winning Trades In Seconds >> efcindicator.com (Special Discount)
The last three candles indicate the formation of a morning star, a strong bull flag. A breakout at the pivot level (P) is required.

XOM RISING WEDGEAnother opportunity where the rising wedge should be touching resistance and preparing to break.
Order placed - currently unfilled
$71.65 Entry
$73.55 SL
$56.02 TP
Take Profit is fairly deep so I will be watching closely and adjusting prices accordingly.
