XOM Put OptionLooking for downside risk on XOM for the week.
Have outlined what i will be watching for early on in the week and expecting entry early in week.
Trade ideas

This is the price zone you want to watch XOM price is stretched.
The stock price recently broke all-time highs
RSI signals that it is overbought.
With geopolitical tension rising, it is risking to short the energy sector, but if you are looking to short XOM pay attention the weekly structure I marked on the chart.
A close below this structure could signal a weekly false breakout and trigger shorts.

Exxon Mobil Corporate cup and handlePossibile break out of a cup and handle pattern on Exxon Mobil Corporation EXO .
Max target at 153.30 , Mid target at 137.30 Fib Ext Lev .
Rsi seem overbought so it remains difficult for me to identify a stop loss that I will place below the first fibonacci level .
Any suggestion is welcome !

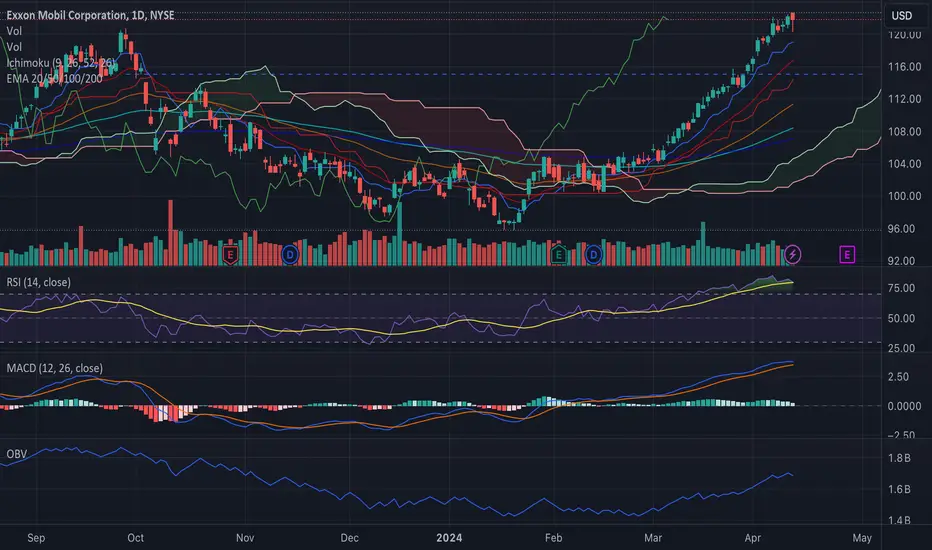
Exxon Mobil Corporation Technical Analysis and OutlookAs of the latest close, Exxon Mobil Corporation (NYSE: XOM) exhibited a commendable performance, with its stock price anchoring at $119.72 and showing a slight uptick in after-hours trading to $120.29. A review of the recent price trajectory reveals a consistent bullish pattern, sustained by a robust upward momentum that bodes well for the prospective investor.
Key Technical Indicators:
Ichimoku Clouds: The price is trading above the Ichimoku cloud, indicating a bullish trend. The cloud's span is widening, which typically suggests strengthening momentum.
Moving Averages: The stock is currently well above its key exponential moving averages (EMAs) — 20, 50, 100, and 200-day lines. The 20-day EMA acting as dynamic support suggests the near-term trend remains decidedly positive.
Relative Strength Index (RSI): The RSI is hovering just below the overbought threshold of 80, marking high enthusiasm among buyers. Yet, investors should be cautious about potential retracement from these levels.
Moving Average Convergence Divergence (MACD): The MACD line is above the signal line and trending upward, reinforcing the bullish sentiment. Notably, the histogram reflects growing buying pressure.
On-Balance Volume (OBV): A steady incline in the OBV underpins the upward price movement, indicating volume is confirming the trend.
Technical Patterns:
Bullish Engulfing Candlestick: The latest candle forms a bullish engulfing pattern, suggesting buyers are overtaking sellers and a continuation of the uptrend may ensue.
Support and Resistance: Immediate support is identified at the $115 mark, while resistance looms near the $122 zone. A breach above resistance could clear the path towards higher valuations.
Market Sentiment and News Integration:
The positive adjustment in earnings forecasts by Zacks Research, now pegging Q2 earnings at $2.40 per share, indicates a stronger financial underpinning that could propel further price appreciation. The upgrade, although modest, may bolster investor confidence and act as a catalyst for continued upward movement.
Moreover, the company's unyielding dividend policy is a testament to its financial health and commitment to shareholder returns, potentially attracting dividend-seeking investors and adding to the buying pressure.
Outlook and Speculative Price Target:
Integrating the fundamental news with our technical standpoint, the landscape for Exxon Mobil is optimistic, with analysts exhibiting a "Moderate Buy" consensus. With the most bullish analyst projecting a price target of $150.00, it suggests a considerable upside potential. Bearing in mind the technical strength and analyst sentiment, we could posit a speculative price target of $135 in the medium term, contingent on market stability and the continuation of the current trend.
Investor Considerations:
While the technical indicators and analyst optimism warrant a bullish outlook, investors must stay vigilant for signs of trend exhaustion or reversal. The pursuit of lower-emission energy solutions showcases Exxon Mobil's adaptability, but regulatory shifts and the pivot to renewable energy sources present variables that could affect future performance.
In conclusion, Exxon Mobil Corporation appears poised to continue its ascent, bolstered by strong technicals, favorable analyst revisions, and a sound dividend policy. As always, investors should maintain a balanced perspective, aligning their strategies with market dynamics and broader economic indicators.
Distance from AvgsHere we have combined a short/long term view of momentum via the Distance from Avg indicator. Explanation and settings noted on chart.
One add'l thought not noted on chart - the "Dots" may show divergence versus price closes, and one can take this into consideration if desired.

XOM bearI am short on XOM recently it touched an all-time high and made a weak high there. In my opinion, XOM needs to consolidated

EXXON MOBIL | Tripple Top Breakout!!EXXON MOBIL has submitted a breakout above its recent resistance of $120.
For the first time on weekly scale, XOM is trading above 120 level as previous week closed above the said resistance.
Manage your risk accordingly. Upside looks promising for target of $143

XOM Breaks out with rising USOILXOM looks to be breaking out from a supply level that has been holding since Nov 2023.
RSI over 60, rising 55D SMA.
Stop Loss: 102.65
Target 119.92, 120.69
Note: This analysis is for educational purposes only and is not a buy/sell recommendation.

Exxon. looking backhigh probability entries. using macd, BB (20wma) and trend line secrets. cycles in the back.
leaving this for fun, for future reference.

Exxon Mobil Signals Profit Dip Amidst Weak Oil and Gas PricesExxon Mobil ( NYSE:XOM ) faces turbulent seas ahead as it braces for a dip in first-quarter operating results, signaling a departure from the record-breaking profits of yesteryears. With weaker oil and gas prices, coupled with significant losses in fuel derivatives, Exxon ( NYSE:XOM ) finds itself navigating through challenging terrain after two years of unprecedented prosperity.
Navigating Market Volatility:
The once-profitable energy giant now grapples with the impact of fluctuating natural gas prices and fuel derivatives, marking a stark reversal from the buoyant market conditions of previous quarters. Despite its efforts to weather the storm, Exxon's operating profit for the quarter is projected to plummet, underscoring the harsh realities of a volatile market environment.
Profit Projections and Investor Sentiment:
Investors brace for a downturn in Exxon's fortunes, with adjusted per-share profit expected to fall short of previous benchmarks. Financial firm LSEG's consensus estimate paints a sobering picture, reflecting a decline in profitability compared to the company's robust performance in the year-ago period. As Exxon's profitability wanes, investor confidence faces a stern test amidst mounting uncertainties.
Factors Contributing to Profit Erosion:
The erosion of Exxon's profits can be attributed to a confluence of factors, including plummeting natural gas prices and adverse movements in fuel derivatives. The company's bottom line takes a hit as refining maintenance costs surge, exacerbating the financial strain caused by weakened market conditions. Against this backdrop, Exxon grapples with the formidable task of mitigating losses and safeguarding shareholder value.
Strategic Moves Amidst Adversity:
In the face of adversity, Exxon ( NYSE:XOM ) remains proactive in its pursuit of strategic opportunities to bolster its position in the market. From all-stock deals with U.S. shale oil producers to assertive claims over prized assets, Exxon ( NYSE:XOM ) demonstrates resilience in the face of market headwinds. However, the path forward remains fraught with challenges as the company navigates a rapidly evolving energy landscape.
Technical Outlook
Exxon Mobil ( NYSE:XOM ) stock is trading above the 200, 100, and 50-day Moving Averages respectively with a Relative Strength Index (RSI) of 85.21 indicating an overbought position for the stock. NYSE:XOM 's 1-day chart shows a cup and handle pattern indicting the potential for a downturn at any moment.

Lookin bullish immediately on XOM!🔉Sound on!🔉
Thank you as always for watching my videos. I hope that you learned something very educational! Please feel free to like, share, and comment on this post. Remember only risk what you are willing to lose. Trading is very risky but it can change your life!

Exxon Mobil - Increased probability of appreciationInterpretation:
Previously disorganized Fibo clouds have gradually lined up giving favorable support to the evolution of the candles. The compacting of fibo clouds from different timeframes signals direction and strength towards the first target to be reached
Reaching the first target makes it necessary to move the stop loss to the position where the entry was made. The purpose of this action is to protect the result that has been achieved and to ensure that there is plenty of time to search for the remaining targets with a reduced risk of losing the trade.
The use of risk management, an integral part of this method, has been fundamental in achieving planned results.
Risk Return Ratio 3

XOM is on a Slippery SlopeXOM near ATH. With Bearish Divergence on the Monthly, I’m expecting a break out and rejection. Once the shooting star candle forms on the weekly, enter below the close with a 5M time horizon. I’m eyeing the 105P or 100P for September. Judging by Volume and Open Interest, I’m expecting a large move down in conjunction of an economic event.


XOMExxon Mobil. Dividend aristocrat.
Dividend stocks, when you look at historical data, have performed well since the last rate hike in the cycle.
Finish correction.
tp1 117
tp2 133

Exxon Mobil Is On The Way HigherExxon Mobil with ticker XOM is back in the uptrend after a completed (A)-(B)-(C) irregular flat correction for wave 4. It's in strong rally away from projected support for wave 4, so wave 5 can be now in progress, which should be completed by a five-wave cycle of the lower degree. It can easily send the price towards all-time highs, just be aware of subwave (4) pullback. At the same time Crude oil could be headed to 85-90, maybe even 100 area.

Buy XOM - Triple tree corrective wave doneThe triple three corrective wave of NYSE:XOM is done and is likely seeing further upside. We are likely on a strong impulse wave

Exxon Mobil Exxon Mobil is going up strong to the all time high,
Expecting strong reaction from that area,
Volume is going down in the last 2 3 weeks witch means bulls are getting weaker,
If we look into the valuation ratios , the company is getting overvalued,
If we look at the 10 Ma on weekly we can see that price is getting away from MA fast witch indicates that the company is getting overvalued quickly,
It will be interesting to see how price will react from that area when it goes up, But overall trend is bullish,

EXXON MOBIL This sell signal will take it to $105.00 minimum.Exxon Mobil (XOM) has been on a tremendous since the January 18 bottom and even more so since the start of this month (March). We are about to form a Golden Cross on the 1D time-frame and last time this pattern emerged (September 20 2023), the market top was formed a week after.
In fact all Tops since November 2022 where formed on a Higher High sequence, confirmed by a 1D MACD Bearish Cross. As a result, we are waiting for the ideal sell opportunity on Exxon's next High and we will enter it after the MACD forms a Bearish Cross. All previous 3 corrective waves have hit at least the 0.618 Fibonacci retracement level. That gives us a medium-term Target of $105.00.
-------------------------------------------------------------------------------
** Please LIKE 👍, FOLLOW ✅, SHARE 🙌 and COMMENT ✍ if you enjoy this idea! Also share your ideas and charts in the comments section below! This is best way to keep it relevant, support us, keep the content here free and allow the idea to reach as many people as possible. **
-------------------------------------------------------------------------------
💸💸💸💸💸💸
👇 👇 👇 👇 👇 👇

Exxon Mobil - XOM - Bullish 5th wave?After correcting for nearly a year is this stock (and energy along with it) starting to make it's move? According to this count, the wave 2 correction was deep so the wave 4 may be shallow. A decent break above the 120 level may lend a bit more weight to this count. The alternative red count is perhaps even more bullish. Watch this space

XOM Potential Buy setupReasons for bullish bias:
- Safe entry at breakout for confirmation
- Price bounced from strong support
- SL below support
Entry Level (Buy Stop): 105.36
Stop Loss Level: 95.40
Take Profit Level 1: 115.32

Exxon Mobil: On the Brink of a Collapse?Having not reviewed Exxon Mobil for a while, it's important to note its strong correlation with oil prices, on which we're currently positioned in a short trade. Accordingly, we also anticipate a downward trend for Exxon Mobil that has yet to conclude. The construction of Wave E or overarching Wave (A) peaked at approximately $96. The critical question now is whether we're forming a Flat in the form of either a Regular or Expanded Flat.
We'll observe how this unfolds without making speculative judgments due to the unusual nature of witnessing an ABCDE movement towards Wave (A). Over the next year, we expect Exxon Mobil to decline, targeting a retracement between $75 and $50 as the maximum. Any level within this range presents a solid buying opportunity for a long-term investment, anticipating a robust Wave III.

Exxon - Quarterly Chart - LongExxon is currently one of the largest positions in my portfolio. My price target for this stock is 262, but I am also keeping a stop loss at 80. The stock has been consolidating since 2006, but it appears to be breaking out now. In my opinion, this is just the beginning of a potentially lucrative trend.
