ZM | Long Setup | Re-Rate on AI UCaaS/CCaaS Pivot | Nov 24, 2025ZM | Long Setup | Range-to-Trend Re-Rate on AI UCaaS/CCaaS Pivot | Nov 24, 2025
🔹 Thesis Summary
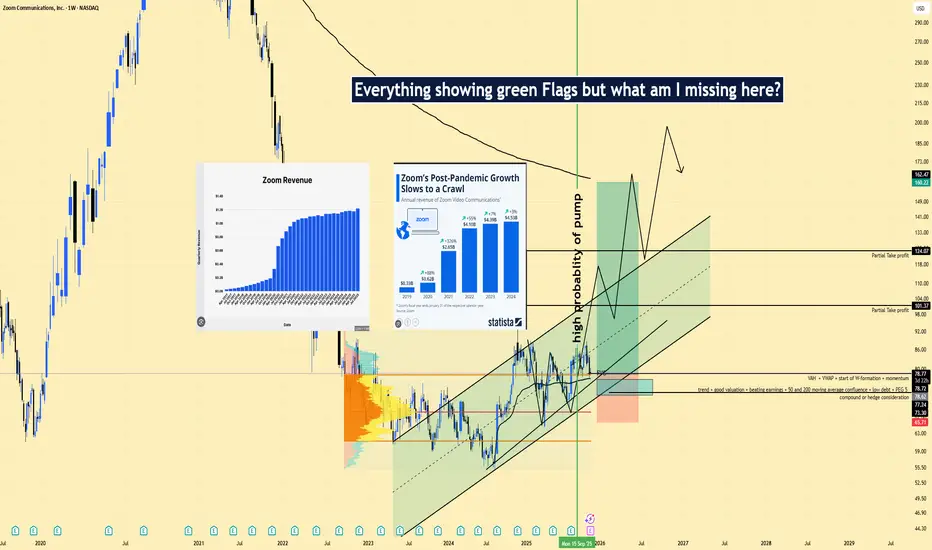
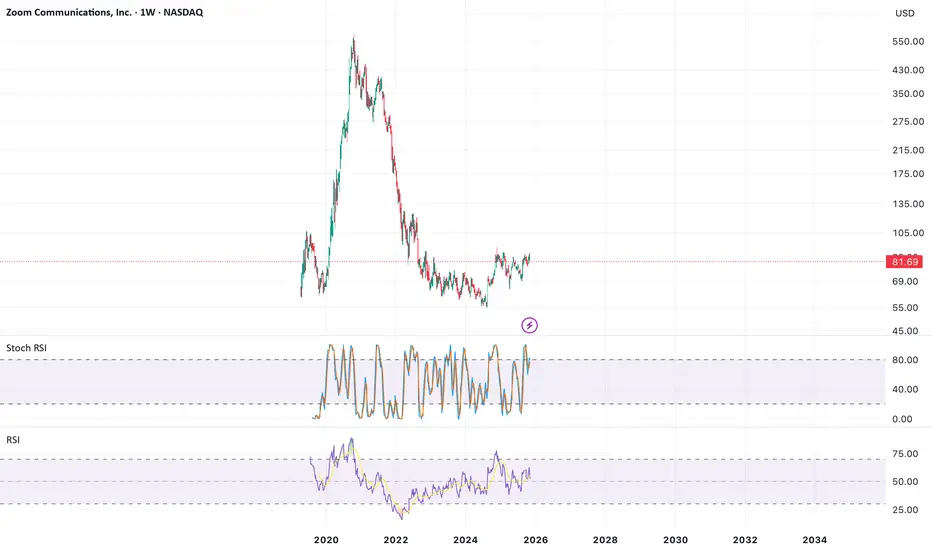
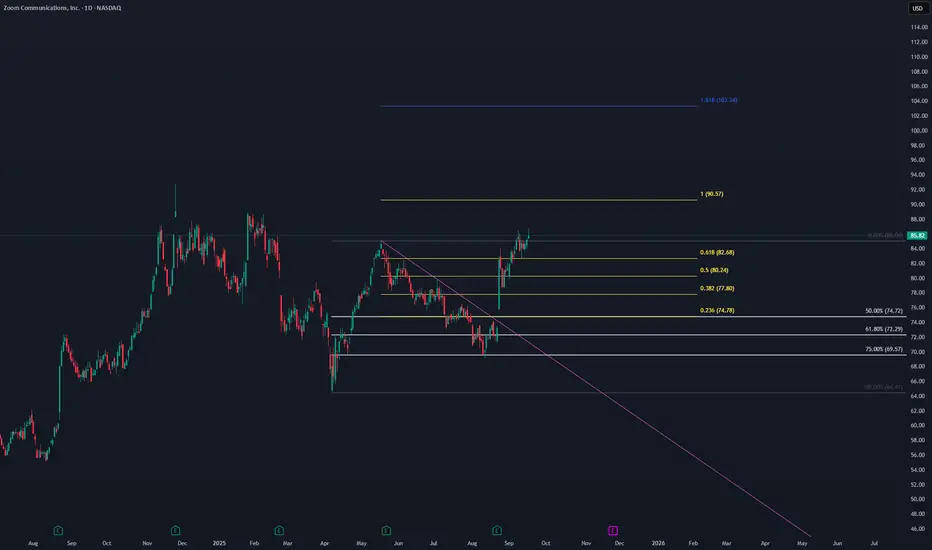
Zoom is exiting a two-year base and riding a rising channel as the mix shifts from “meetings” to a broader AI-enabled UCaaS/CCaaS stack. If growth stabilizes and margins hold, a multiple re-rate from ~1
0.095 USD
898.00 M USD
4.15 B USD
About Zoom Communications, Inc.
Sector
Industry
CEO
Eric S. Yuan
Website
Headquarters
San Jose
Founded
2011
ISIN
ARBCOM4603B2
Zoom Communications, Inc. engages in the provision of a communications and collaboration platform. It operates through the following geographical segments: Americas, Asia Pacific, and Europe, Middle East, and Africa. The company was founded by Eric S. Yuan in 2011 and is headquartered in San Jose, CA.
Related stocks
Zoom Is Down 85% Since 2020. Here's Its Chart Ahead of EarningsZoom Communications NASDAQ:ZM sort of saved our jobs during COVID-19 (and saw its share price rise some 660% in the process), but the stock has fallen some 85% from its 2020 peak and is down year to date. Let's see what Zoom's chart and fundamental analysis say as the video-conferencing firm heads

Short ZMNASDAQ:ZM
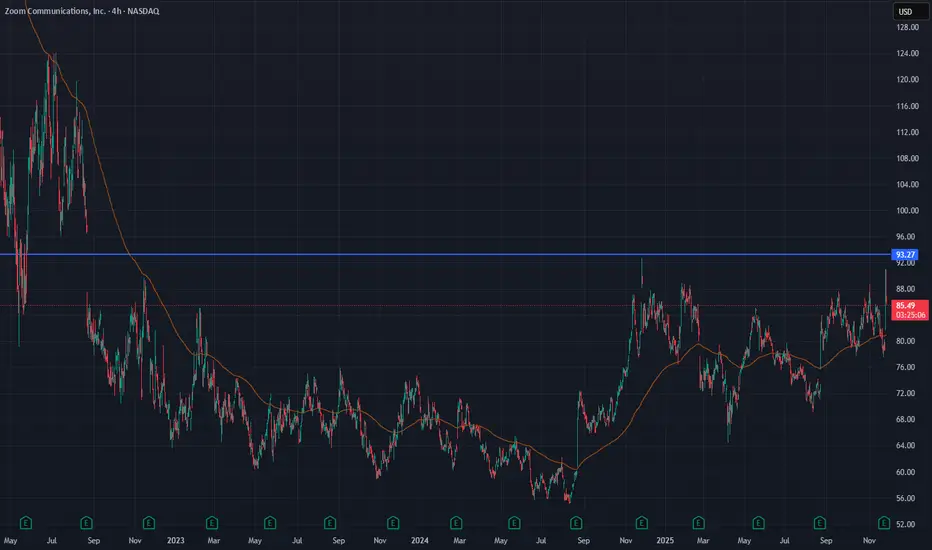
Zoom Video (ZM) was one of the major winners during the pandemic period. However, since August 2022 the stock has consistently failed to break above the $93 resistance, and it is increasingly unlikely to do so in a market where more alternatives now offer services similar to Zoom.
A sol
ZM Earnings Alert — QuantSignals V3 Call RecommendationZM Earnings (QuantSignals V3 | 2025-11-24)
Direction: BUY CALLS
Confidence: 58%
Expiry: 2025-11-28 (4 days)
Strike Focus: $80.00
Entry Range: $2.82 – $3.05 (mid: $2.93)
Target 1: $4.23 (50% gain)
Target 2: $5.49 (95% gain)
Stop Loss: $2.05 (30% loss)
Position Size: 2.5% of portfolio
Implied Move: $
Zoom Video oversold before earnings could fuel rebound this weekCurrent Price: $78.63
Direction: LONG
Confidence Level: 55% (Limited but notable oversold signal and potential earnings catalyst from professional trader sentiment)
Targets:
- T1 = $80.00
- T2 = $82.00
Stop Levels:
- S1 = $77.00
- S2 = $76.00
**Wisdom of Professional Traders:**
Several profess

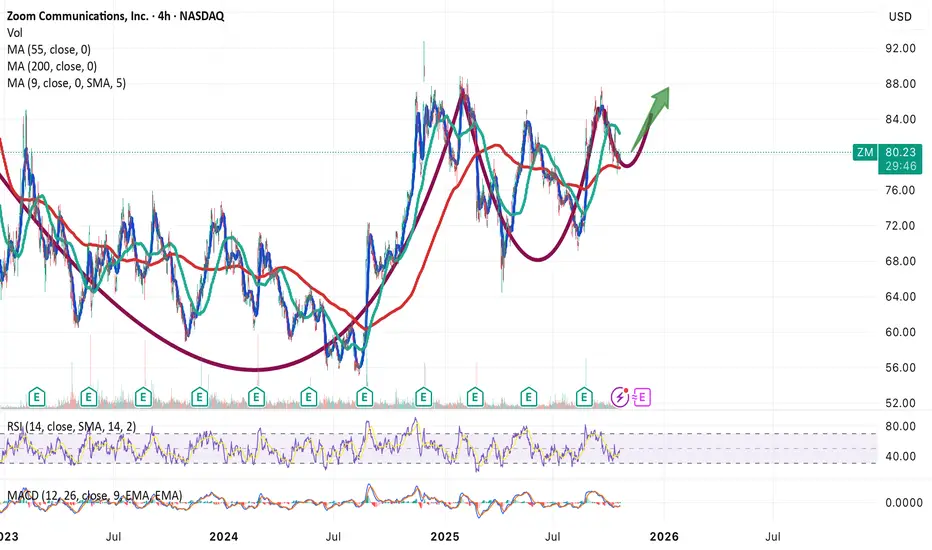
ZM Long📈 ZM Stock Update (Zoom Video)
ZM is forming a classic Cup and Handle pattern — a bullish continuation setup that often signals a potential breakout ahead.
✅ The cup reflects a strong recovery and accumulation phase.
✅ The handle is forming with light consolidation, indicating reduced selling pres
Buy Opportunity Look at these lows! You might be a bag holder for a little while, but this is a definite 50% in the next 18-24 months.
ZOOM : go LONG
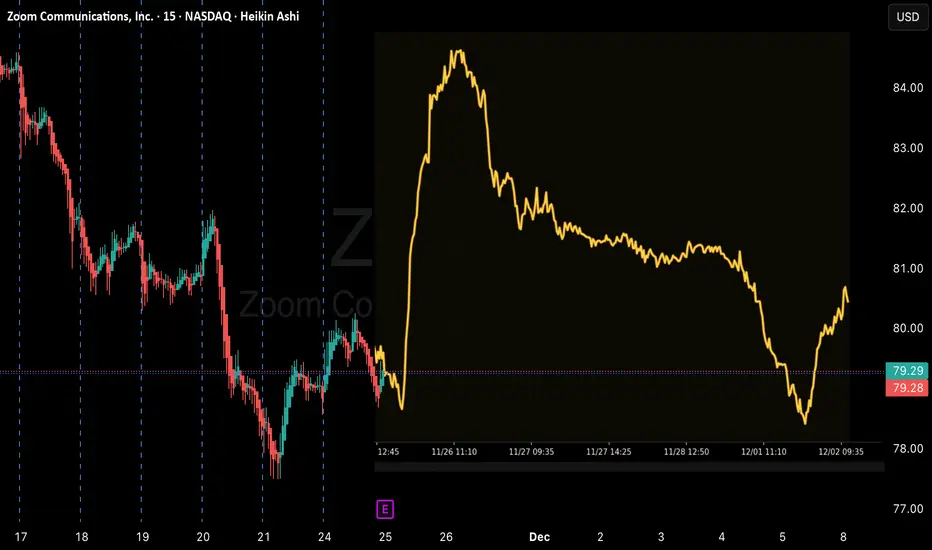
1. Technical Analysis (Based on the Heikin Ashi Chart)
The Heikin Ashi chart is used to smooth out price fluctuations, making it easier to identify market trends.
* Strong Bullish Reversal Signal:
* Following a period of consolidation or slight correction (late September to mid-October), the ch

Accumulation complete; breakout is just days away !Over the past 10 months Zoom has formed an inverse head and shoulders bottoming pattern. These are clear signs of accumulation before the start of a markup phase.

Zoom Update. Near ObjectiveLike previous analysis ZM is near to reach the objective.
FIB RETRACEMENT⮕PRICE RETRACEMENT⮕TRENDLINE CROSSING⮕FIB EXTENSION⮕TARGET THE OBJECTIVE
See all ideas
Summarizing what the indicators are suggesting.
Oscillators
Neutral
SellBuy
Strong sellStrong buy
Strong sellSellNeutralBuyStrong buy
Oscillators
Neutral
SellBuy
Strong sellStrong buy
Strong sellSellNeutralBuyStrong buy
Summary
Neutral
SellBuy
Strong sellStrong buy
Strong sellSellNeutralBuyStrong buy
Summary
Neutral
SellBuy
Strong sellStrong buy
Strong sellSellNeutralBuyStrong buy
Summary
Neutral
SellBuy
Strong sellStrong buy
Strong sellSellNeutralBuyStrong buy
Moving Averages
Neutral
SellBuy
Strong sellStrong buy
Strong sellSellNeutralBuyStrong buy
Moving Averages
Neutral
SellBuy
Strong sellStrong buy
Strong sellSellNeutralBuyStrong buy
Displays a symbol's price movements over previous years to identify recurring trends.
Curated watchlists where ZMD is featured.


