Bitcoin Cash: Signs Of A Potential Bottom FormingBitcoin Cash (BCH) appears to be in the final stages of a higher-degree A-B-C irregular flat correction, labeled as wave (2) on the daily chart. Price recently tested a strong support zone and responded with a sharp rebound, suggesting that corrective pressure may be fading and that wave (2) could a

BCH long top $553 today Just scaled into CRYPTOCAP:BCH
long that i took last night. Good enough for an entry here if anyone interest for potential 2rr. Anticipating a spike of prior daily LH area before likely continuation down
Sl: $512
Tp: $553 area

BCH/USDT Long Set-up— Entry: $517— market buy order
— Stop: $490
— Target: $650
Risk per trade: 1% of total equity
Position size: 20% of total equity
RR: 1:5

BCH long to $543.47Just recently opened a new long on CRYPTOCAP:BCH after closing hype. Was monitoring earlier. Expecting a spike higher before any major downside
🛑sl: 519 or lower
🎯Tp: $543.47

BCH/SOL 32% STILL TO GO THEN SCALE OUT?BCH/SOL 32% STILL TO GO THEN SCALE OUT. Not much more to say, BCH looks strong could even out pace the metals

BCHUSD (4H) - Zigzag correction into 50–61.8% retracement1) Chart & context
I removed unnecessary indicators to keep the chart focused on structure. I’m tracking waves + Fibonacci and waiting for a high-probability formation.
2) Structure (Elliott Wave read)
• BCHUSD appears to have completed a 5-wave decline from ~687 to ~424.
• Price is now forming

BCH 1H — Rising Wedge Warning, Rejection Incoming?BCH 1H — Rising Wedge Warning, Rejection Incoming?
📌BCH is currently forming a rising wedge pattern on the 1H timeframe, which is typically a bearish structure in the short term ✅
📌Previously, price touched this rising trendline and faced a strong rejection, leading to a sharp dump from the same z

BCHUSD H1 | Could we see a a reversal from here?Based on the H1 chart analysis, we can see that the sell entry level is at 510.97, which is a pullback resistance.
Our stop loss is set at 535.48, which is a pullback resistance.
Our take profit is set at 467.84, which is a pullback support that aligns with the 61.8% Fibonacci retracement.
High R

BCH/GOLD trend lineWill the price stay strong for BCH against Gold trend break but price back to test trend line

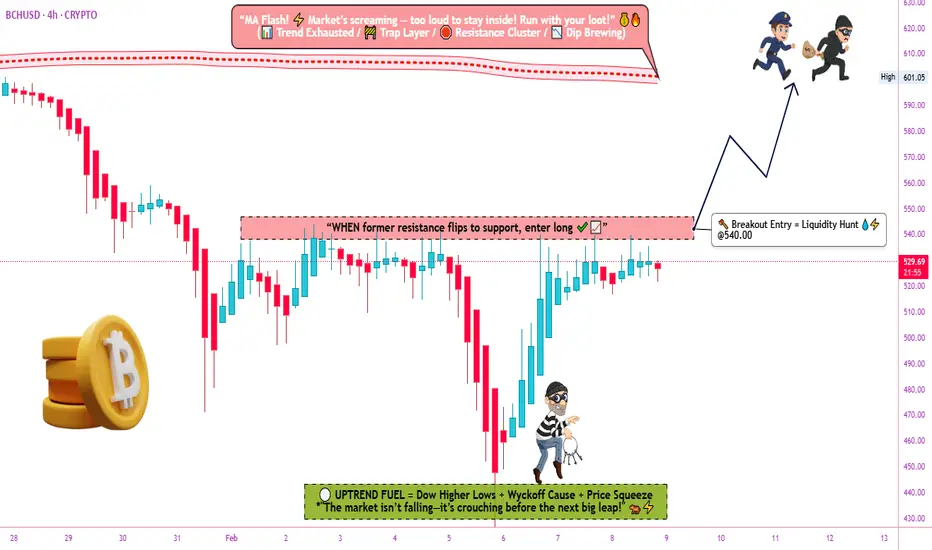
BCH/USD Momentum Shift — Buyers Take Control🚀 BCH/USD Bullish Breakout Setup | Smart Money Momentum Play
Asset: BCH/USD — Bitcoin Cash vs U.S. Dollar
Market: Crypto
Timeframe: Day / Swing Trade
Bias: 📈 Bullish Continuation
🧠 Trade Plan Overview
Bitcoin Cash is showing strength after prolonged consolidation, and price is now attacking a majo
See all ideas
Summarizing what the indicators are suggesting.
Oscillators
Neutral
SellBuy
Strong sellStrong buy
Strong sellSellNeutralBuyStrong buy
Oscillators
Neutral
SellBuy
Strong sellStrong buy
Strong sellSellNeutralBuyStrong buy
Summary
Neutral
SellBuy
Strong sellStrong buy
Strong sellSellNeutralBuyStrong buy
Summary
Neutral
SellBuy
Strong sellStrong buy
Strong sellSellNeutralBuyStrong buy
Summary
Neutral
SellBuy
Strong sellStrong buy
Strong sellSellNeutralBuyStrong buy
Moving Averages
Neutral
SellBuy
Strong sellStrong buy
Strong sellSellNeutralBuyStrong buy
Moving Averages
Neutral
SellBuy
Strong sellStrong buy
Strong sellSellNeutralBuyStrong buy
Displays a symbol's price movements over previous years to identify recurring trends.