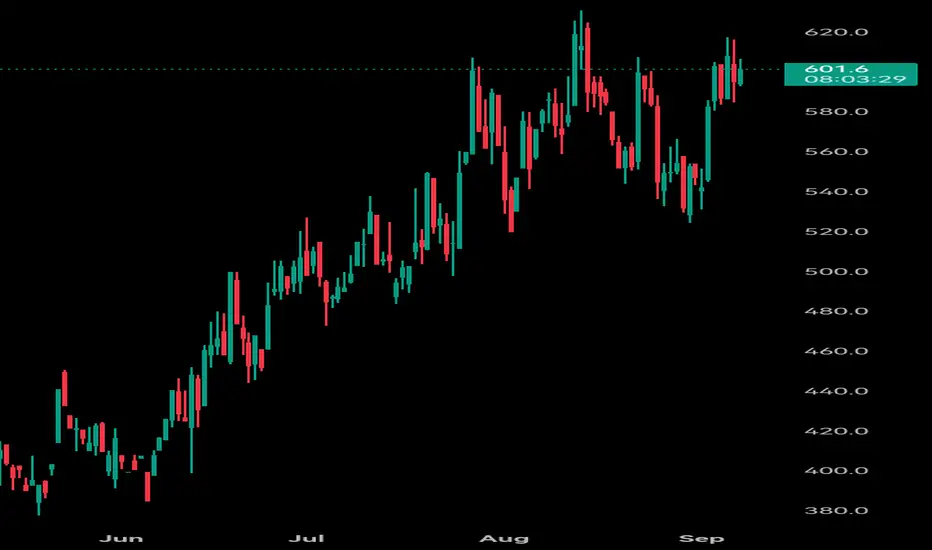
The Bitcoin Cash bull runBitcoin Cash began its bull run in June of 2023, we are currently only 20% of the way through the bull run.
I think the bull run will end around the end of 2026.
Long entry: 590 USD
Take profit: between 0,4 million and 2,4 million USD
In my opinion there is a high probability that it will reach between 1 and 2.5 million, 1.2 million could be a likely target.
This is my personal opinion and this is not a financial advice! Good trading!
BCHUSD.P trade ideas

BCH LongThe Shark harmonic pattern indicates a strong upward trend for BCHUSD, starting at $520 and aiming for potential target points at TP1 .. TP3.

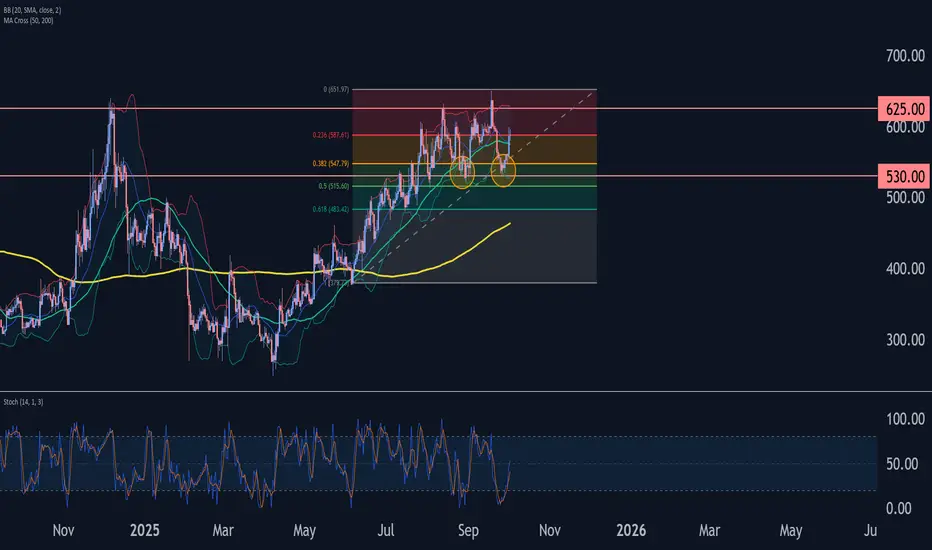
BitcoinCash Wave Analysis – 2 October 2025- BitcoinCash reversed from support zone
- Likely to rise to resistance level 0.936
BitcoinCash cryptocurrency recently reversed up from the strong support zone between the pivotal support level 530.00 (which has been reversing the price from the start of August) and the lower daily Bollinger Band.
The support zone was further strengthened by the 38,2% Fibonacci correction of the earlier sharp upward impulse wave from June.
Given the strong daily uptrend, BitcoinCash cryptocurrency can be expected to rise in the active impulse wave 3 to next resistance level .00 (which stopped earlier waves (1) and 1).
BCHUSD H4 | Bullish Momentum BuildingBCH/USD has bounced off the buy entry which is a pullback support, and could rise to the take profit.
Buy entry is at 574.48, which is a pullback support.
Stop loss is at 548.19, which is a pullback support.
Take profit is at 623.52, which is a pullback resistance that aligns with the 78.6% Fibonacci retracement.
High Risk Investment Warning
Trading Forex/CFDs on margin carries a high level of risk and may not be suitable for all investors. Leverage can work against you.
Stratos Markets Limited (tradu.com ):
CFDs are complex instruments and come with a high risk of losing money rapidly due to leverage. 65% of retail investor accounts lose money when trading CFDs with this provider. You should consider whether you understand how CFDs work and whether you can afford to take the high risk of losing your money.
Stratos Europe Ltd (tradu.com ):
CFDs are complex instruments and come with a high risk of losing money rapidly due to leverage. 66% of retail investor accounts lose money when trading CFDs with this provider. You should consider whether you understand how CFDs work and whether you can afford to take the high risk of losing your money.
Stratos Global LLC (tradu.com ):
Losses can exceed deposits.
Please be advised that the information presented on TradingView is provided to Tradu (‘Company’, ‘we’) by a third-party provider (‘TFA Global Pte Ltd’). Please be reminded that you are solely responsible for the trading decisions on your account. There is a very high degree of risk involved in trading. Any information and/or content is intended entirely for research, educational and informational purposes only and does not constitute investment or consultation advice or investment strategy. The information is not tailored to the investment needs of any specific person and therefore does not involve a consideration of any of the investment objectives, financial situation or needs of any viewer that may receive it. Kindly also note that past performance is not a reliable indicator of future results. Actual results may differ materially from those anticipated in forward-looking or past performance statements. We assume no liability as to the accuracy or completeness of any of the information and/or content provided herein and the Company cannot be held responsible for any omission, mistake nor for any loss or damage including without limitation to any loss of profit which may arise from reliance on any information supplied by TFA Global Pte Ltd.
The speaker(s) is neither an employee, agent nor representative of Tradu and is therefore acting independently. The opinions given are their own, constitute general market commentary, and do not constitute the opinion or advice of Tradu or any form of personal or investment advice. Tradu neither endorses nor guarantees offerings of third-party speakers, nor is Tradu responsible for the content, veracity or opinions of third-party speakers, presenters or participants.

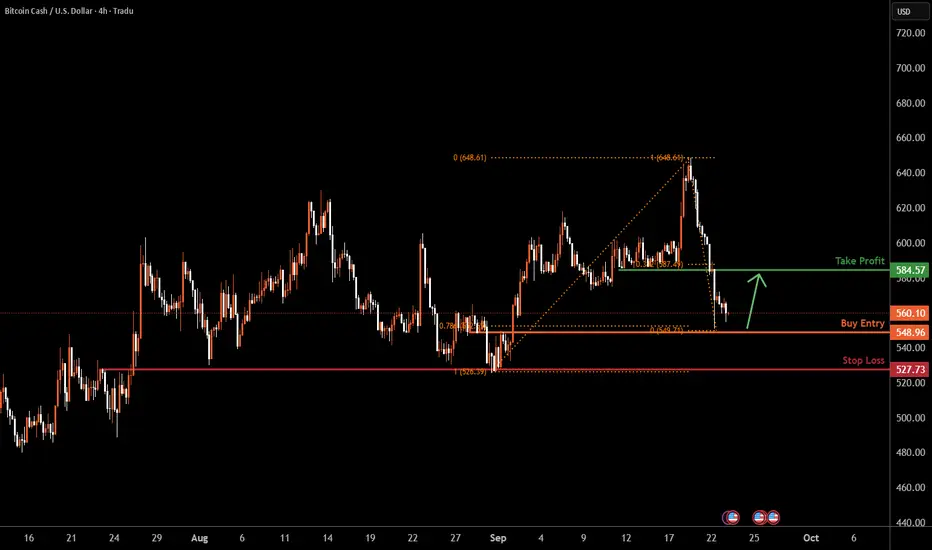
BCHUSD H4 | Bullish reversalBCH/USD is falling towards the buy entry which is a pullback support that lines up with the 78.6% Fibonacci retracement and oculd bounce from this level to the take profit.
Buy entry is at 548.20, which is a pullback support that lines up with the 78.6% Fibonacci retracement.
Stop loss is at 527.73, which is an overlap support.
Take profit is at 584.57, which is a pullback resistance that aligns with the 38.2% Fibonacci retracement.
High Risk Investment Warning
Trading Forex/CFDs on margin carries a high level of risk and may not be suitable for all investors. Leverage can work against you.
Stratos Markets Limited (tradu.com ):
CFDs are complex instruments and come with a high risk of losing money rapidly due to leverage. 65% of retail investor accounts lose money when trading CFDs with this provider. You should consider whether you understand how CFDs work and whether you can afford to take the high risk of losing your money.
Stratos Europe Ltd (tradu.com ):
CFDs are complex instruments and come with a high risk of losing money rapidly due to leverage. 66% of retail investor accounts lose money when trading CFDs with this provider. You should consider whether you understand how CFDs work and whether you can afford to take the high risk of losing your money.
Stratos Global LLC (tradu.com ):
Losses can exceed deposits.
Please be advised that the information presented on TradingView is provided to Tradu (‘Company’, ‘we’) by a third-party provider (‘TFA Global Pte Ltd’). Please be reminded that you are solely responsible for the trading decisions on your account. There is a very high degree of risk involved in trading. Any information and/or content is intended entirely for research, educational and informational purposes only and does not constitute investment or consultation advice or investment strategy. The information is not tailored to the investment needs of any specific person and therefore does not involve a consideration of any of the investment objectives, financial situation or needs of any viewer that may receive it. Kindly also note that past performance is not a reliable indicator of future results. Actual results may differ materially from those anticipated in forward-looking or past performance statements. We assume no liability as to the accuracy or completeness of any of the information and/or content provided herein and the Company cannot be held responsible for any omission, mistake nor for any loss or damage including without limitation to any loss of profit which may arise from reliance on any information supplied by TFA Global Pte Ltd.
The speaker(s) is neither an employee, agent nor representative of Tradu and is therefore acting independently. The opinions given are their own, constitute general market commentary, and do not constitute the opinion or advice of Tradu or any form of personal or investment advice. Tradu neither endorses nor guarantees offerings of third-party speakers, nor is Tradu responsible for the content, veracity or opinions of third-party speakers, presenters or participants.
BCH/USDShort term Bullish bias after huge drop.
Buy Entry: 553.13 - 545.20
SL: 535.04
TP: 607.48
If you like no manage risk. LOL

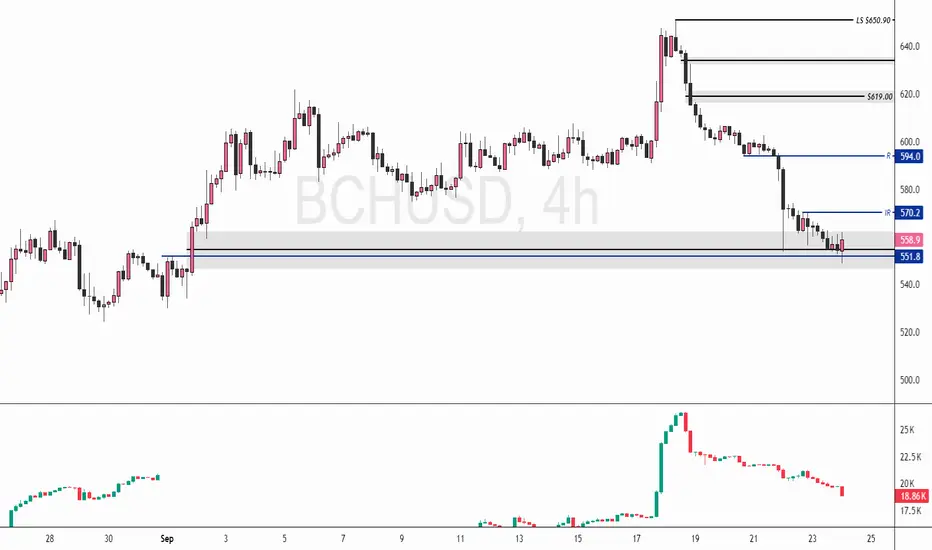
BCH: Cumulative Volume Delta Signals Potential UpsideFenzoFx—Bitcoin Cash (BCH) is consolidating within the bullish fair value gap, supported at $551.80 and trading at $560.00, up 0.48% today. Despite a new lower low, volume remains bullish, suggesting the current bearish momentum may be consolidation rather than a downtrend.
Immediate resistance is at $570.20. If price closes and stabilizes above this swing high, BCH/USD could form a bullish wave toward $594.00.
BCHUSD H4 | Bearish drop offBCH/USD is reacting off the sell entry which is a pullback resitance that ailgns with the 23.6% Fibonacci retracement and oculd drop from this level to tour take profit.
Sell entry is at 559, whic is a pullback resistance that aligsn with the 23.6% Fibonacci retracement.
Stop loss is at 576.77, which is a pullback resitance that lines up with the 38.2% Fibonacci retracement.
Take profit is at 526.72, which is a pullback support.
High Risk Investment Warning
Trading Forex/CFDs on margin carries a high level of risk and may not be suitable for all investors. Leverage can work against you.
Stratos Markets Limited (tradu.com ):
CFDs are complex instruments and come with a high risk of losing money rapidly due to leverage. 65% of retail investor accounts lose money when trading CFDs with this provider. You should consider whether you understand how CFDs work and whether you can afford to take the high risk of losing your money.
Stratos Europe Ltd (tradu.com ):
CFDs are complex instruments and come with a high risk of losing money rapidly due to leverage. 66% of retail investor accounts lose money when trading CFDs with this provider. You should consider whether you understand how CFDs work and whether you can afford to take the high risk of losing your money.
Stratos Global LLC (tradu.com ):
Losses can exceed deposits.
Please be advised that the information presented on TradingView is provided to Tradu (‘Company’, ‘we’) by a third-party provider (‘TFA Global Pte Ltd’). Please be reminded that you are solely responsible for the trading decisions on your account. There is a very high degree of risk involved in trading. Any information and/or content is intended entirely for research, educational and informational purposes only and does not constitute investment or consultation advice or investment strategy. The information is not tailored to the investment needs of any specific person and therefore does not involve a consideration of any of the investment objectives, financial situation or needs of any viewer that may receive it. Kindly also note that past performance is not a reliable indicator of future results. Actual results may differ materially from those anticipated in forward-looking or past performance statements. We assume no liability as to the accuracy or completeness of any of the information and/or content provided herein and the Company cannot be held responsible for any omission, mistake nor for any loss or damage including without limitation to any loss of profit which may arise from reliance on any information supplied by TFA Global Pte Ltd.
The speaker(s) is neither an employee, agent nor representative of Tradu and is therefore acting independently. The opinions given are their own, constitute general market commentary, and do not constitute the opinion or advice of Tradu or any form of personal or investment advice. Tradu neither endorses nor guarantees offerings of third-party speakers, nor is Tradu responsible for the content, veracity or opinions of third-party speakers, presenters or participants.

BCHUSD H4 | Bearish drop offBCH/USD is rising towards the sell entry which is a pullback resistance and could drop from this level to the downside.
Sell entry is at 560.20, which is a pullback resistance.
Stop loss is at 576.77, which acts as a pullback resistance.
Take profit is at 526.72, which is a swing low support.
High Risk Investment Warning
Trading Forex/CFDs on margin carries a high level of risk and may not be suitable for all investors. Leverage can work against you.
Stratos Markets Limited (tradu.com ):
CFDs are complex instruments and come with a high risk of losing money rapidly due to leverage. 65% of retail investor accounts lose money when trading CFDs with this provider. You should consider whether you understand how CFDs work and whether you can afford to take the high risk of losing your money.
Stratos Europe Ltd (tradu.com ):
CFDs are complex instruments and come with a high risk of losing money rapidly due to leverage. 66% of retail investor accounts lose money when trading CFDs with this provider. You should consider whether you understand how CFDs work and whether you can afford to take the high risk of losing your money.
Stratos Global LLC (tradu.com ):
Losses can exceed deposits.
Please be advised that the information presented on TradingView is provided to Tradu (‘Company’, ‘we’) by a third-party provider (‘TFA Global Pte Ltd’). Please be reminded that you are solely responsible for the trading decisions on your account. There is a very high degree of risk involved in trading. Any information and/or content is intended entirely for research, educational and informational purposes only and does not constitute investment or consultation advice or investment strategy. The information is not tailored to the investment needs of any specific person and therefore does not involve a consideration of any of the investment objectives, financial situation or needs of any viewer that may receive it. Kindly also note that past performance is not a reliable indicator of future results. Actual results may differ materially from those anticipated in forward-looking or past performance statements. We assume no liability as to the accuracy or completeness of any of the information and/or content provided herein and the Company cannot be held responsible for any omission, mistake nor for any loss or damage including without limitation to any loss of profit which may arise from reliance on any information supplied by TFA Global Pte Ltd.
The speaker(s) is neither an employee, agent nor representative of Tradu and is therefore acting independently. The opinions given are their own, constitute general market commentary, and do not constitute the opinion or advice of Tradu or any form of personal or investment advice. Tradu neither endorses nor guarantees offerings of third-party speakers, nor is Tradu responsible for the content, veracity or opinions of third-party speakers, presenters or participants.

BITCOIN Cash last Sells!I've already Broken even on all trades.
I think it's hard for Bitcoin-Cash to go lower because Bitcoin is bullish for the past weeks.
Let's see how it goes

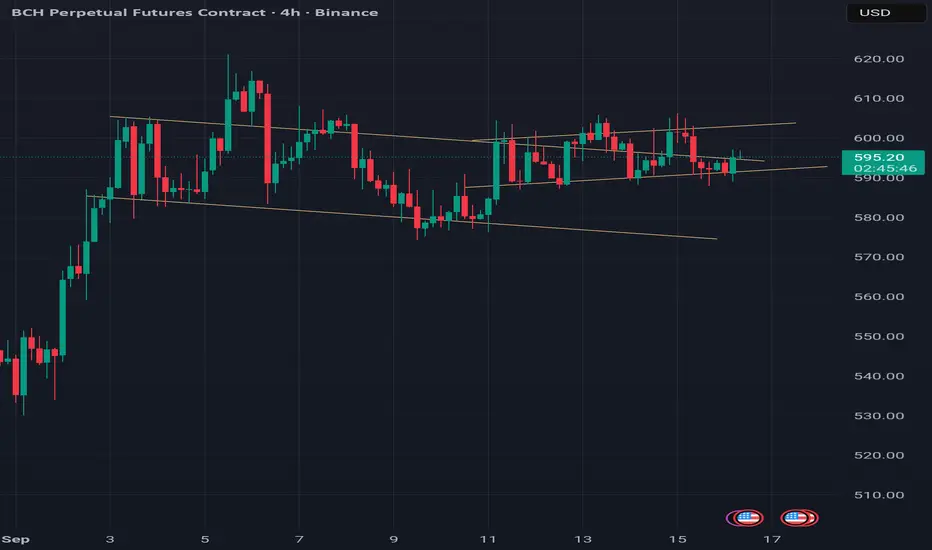
BCH chart pattern Price is still maintaining primary trend line and secondary trend. All having bullish flag and waiting for breakout or breakdown.
Here is a scalp and swing long entry
Scalp entry
entry 1 592.4
Entry 2 582
Stop loss:579
Tp
596
600
614
Swing
Entry 1 592
Entry 2 572
Stop loss: 567
Tp
600
614
626
Bitcoin Cash Holds Bullish StructureFenzoFx—Bitcoin Cash is consolidating near $592.00 after sweeping liquidity above $607.60. Price is declining toward a bullish fair value gap, with support at $507.00 still holding the bullish outlook intact.
Immediate resistance is at $600.5. A close above this level could extend the bullish rally toward $626.00. The inverted FVG left after crossing $507.00 reinforces the bias.
Note: The bullish scenario should be invalidated if price flips below $570.00.

BCHUSD LongThe Crab harmonic pattern indicates a strong upward trend for BCHUSD, starting at $573 and aiming for potential target points at TP1 and TP2.

BCHUSD H1 | Bearish reversalBCH/USD has rejected off the sell entry, which is a pullback resistance that aligns with the 50% Fibonacci retracement and could drop from this level to the downside.
Sell entry is at 595.66, which is a pullback resistance that aligns with the 50% Fibonacci retracement.
Stop loss is at 613.25, which is a swing high resistance.
Take profit is at 571.96, which is a pullback support.
High Risk Investment Warning
Trading Forex/CFDs on margin carries a high level of risk and may not be suitable for all investors. Leverage can work against you.
Stratos Markets Limited (tradu.com ):
CFDs are complex instruments and come with a high risk of losing money rapidly due to leverage. 65% of retail investor accounts lose money when trading CFDs with this provider. You should consider whether you understand how CFDs work and whether you can afford to take the high risk of losing your money.
Stratos Europe Ltd (tradu.com ):
CFDs are complex instruments and come with a high risk of losing money rapidly due to leverage. 66% of retail investor accounts lose money when trading CFDs with this provider. You should consider whether you understand how CFDs work and whether you can afford to take the high risk of losing your money.
Stratos Global LLC (tradu.com ):
Losses can exceed deposits.
Please be advised that the information presented on TradingView is provided to Tradu (‘Company’, ‘we’) by a third-party provider (‘TFA Global Pte Ltd’). Please be reminded that you are solely responsible for the trading decisions on your account. There is a very high degree of risk involved in trading. Any information and/or content is intended entirely for research, educational and informational purposes only and does not constitute investment or consultation advice or investment strategy. The information is not tailored to the investment needs of any specific person and therefore does not involve a consideration of any of the investment objectives, financial situation or needs of any viewer that may receive it. Kindly also note that past performance is not a reliable indicator of future results. Actual results may differ materially from those anticipated in forward-looking or past performance statements. We assume no liability as to the accuracy or completeness of any of the information and/or content provided herein and the Company cannot be held responsible for any omission, mistake nor for any loss or damage including without limitation to any loss of profit which may arise from reliance on any information supplied by TFA Global Pte Ltd.
The speaker(s) is neither an employee, agent nor representative of Tradu and is therefore acting independently. The opinions given are their own, constitute general market commentary, and do not constitute the opinion or advice of Tradu or any form of personal or investment advice. Tradu neither endorses nor guarantees offerings of third-party speakers, nor is Tradu responsible for the content, veracity or opinions of third-party speakers, presenters or participants.

BCH/USD – Rejected at SMA200🔴 SHORT below $595 – target $579
Bitcoin Cash trades at $584, rejected under SMA200 ($595). Resistance: $589–595, support: $579. RSI weak at 44, pointing to bearish momentum. Bears remain in control unless $595 breaks cleanly.
📖 Keywords: #BCHUSD #BitcoinCash #CryptoSelloff #AltcoinBearish #ShortSetup

Bitcoin-CashB setup. Potential Market Structure Shift after resistance mitigation
Manage risk efficiently

**Technical Analysis** **Current Trend (requires interpretation**Technical Analysis**
**Current Trend (requires interpretation with real-time charts):**
The price of BCH is currently at a critical level. Looking at the daily chart, it may be testing a **key support level** (such as a previous low or a crucial moving average, like the 200-day moving average). If it breaks below this level on high volume, it could initiate a new downward trend, potentially targeting the next major support level.
Conversely, if it finds strong support at this level accompanied by increased trading volume, it might form a short-term bottom and attempt to challenge the nearest resistance level (such as a previous high or the 50-day moving average).
**Key Indicator Signals:**
* **Volume:** Whether recent price increases are supported by high volume or declines occur on low volume is crucial for determining momentum strength.
* **RSI (Relative Strength Index):** If it is in the oversold zone below 30 and forms a bullish divergence, it might suggest an impending rebound. If it is in the overbought zone above 70, be cautious of a potential pullback.
* **MACD:** Watch for whether the DIF and DEA lines form a golden cross below the zero axis, which is one of the short-term bullish signals.
**Conclusion:**
BCH is nearing a short-term directional decision. It is essential to closely monitor its breakthrough of key support/resistance levels. The overall trend is still influenced by the broader Bitcoin market. When trading, strictly control risks and wait for high-volume confirmation of directional signals.
bullish on $BCHidk ts just look good maybe ever1 bearish and TOTAL3 going up but all the coins people talk about = they hold the wrong shit which means this one the right shit which mean when alts moon (the select few) every1 offside and ape in

BCH/USD — Triangle Long: 599Entry (buy):
Aggressive: When price breaks the triangle top and closes above the yellow line ~$588.10 (enter $588.20–$588.60).
Conservative: Wait for a 30-min close above $593.14 (red). Enter $593.20–$593.50.
Stop-loss:
Place below the white support at $583.78 → set $583.40 to avoid wick hunts.
(If you use the conservative entry, you can trail the stop to just under $588 after a clean close above $593.)
Take-profits:
TP1: $593.14 (first resistance; take partials or tighten stop)
TP2: $599.20 (green line)
TP3 (extension): $605–$606 if momentum persists after $599.20

Bitcoin Cash Holds Bullish StructureFenzoFx—Bitcoin Cash slipped nearly 3.00% after approaching $607.60, now trading around $586.00.
The bullish outlook holds while BCH stays above the inverted fair value gap, with key support at $568.00.
Consolidation near or within the FVG is expected before a potential rebound. If the mean threshold holds, BCH could aim for $626.00.
A drop below $568.00 would invalidate the bullish scenario.

BCHUSD H4 | Bearish momentum buildingBased on the H4 chart analysis, we can see that the price has rejected the sell entry, which is a pullback resistance and could drop from this level to the downside.
Sell entry is at 604.79, which is a pullback resistance.
Stop loss is at 629.95, which acts as a swing high resistance.
Take profit is at 561.29, a pullback support that is slightly above the 61.8% Fibonacci retracement.
High Risk Investment Warning
Trading Forex/CFDs on margin carries a high level of risk and may not be suitable for all investors. Leverage can work against you.
Stratos Markets Limited (tradu.com ):
CFDs are complex instruments and come with a high risk of losing money rapidly due to leverage. 65% of retail investor accounts lose money when trading CFDs with this provider. You should consider whether you understand how CFDs work and whether you can afford to take the high risk of losing your money.
Stratos Europe Ltd (tradu.com ):
CFDs are complex instruments and come with a high risk of losing money rapidly due to leverage. 66% of retail investor accounts lose money when trading CFDs with this provider. You should consider whether you understand how CFDs work and whether you can afford to take the high risk of losing your money.
Stratos Global LLC (tradu.com ):
Losses can exceed deposits.
Please be advised that the information presented on TradingView is provided to Tradu (‘Company’, ‘we’) by a third-party provider (‘TFA Global Pte Ltd’). Please be reminded that you are solely responsible for the trading decisions on your account. There is a very high degree of risk involved in trading. Any information and/or content is intended entirely for research, educational and informational purposes only and does not constitute investment or consultation advice or investment strategy. The information is not tailored to the investment needs of any specific person and therefore does not involve a consideration of any of the investment objectives, financial situation or needs of any viewer that may receive it. Kindly also note that past performance is not a reliable indicator of future results. Actual results may differ materially from those anticipated in forward-looking or past performance statements. We assume no liability as to the accuracy or completeness of any of the information and/or content provided herein and the Company cannot be held responsible for any omission, mistake nor for any loss or damage including without limitation to any loss of profit which may arise from reliance on any information supplied by TFA Global Pte Ltd.
The speaker(s) is neither an employee, agent nor representative of Tradu and is therefore acting independently. The opinions given are their own, constitute general market commentary, and do not constitute the opinion or advice of Tradu or any form of personal or investment advice. Tradu neither endorses nor guarantees offerings of third-party speakers, nor is Tradu responsible for the content, veracity or opinions of third-party speakers, presenters or participants.

BCHUSD Surges Past $580 Resistance, Eyes $715 BCHUSD has broken the significant trend line resistance $580 and holds above that level. The pair surged more than 15% in the past three days. It hit a high of $604.75 and is currently trading around $602.33.The overall trend is bullish as long as the support $440 holds.
The pair holds above the short-term (34 and 55-day EMA) and above the long-term moving average (200-day EMA).
The near-term resistance is around $625; any indicative breach above will take the pair to $640/$715. On the lower side, immediate support is $559, and any violation below targets $514/$490.
Indicators (4-hour chart)
CCI(50)- Bullish
Directional movement index - Bullish
It is good to buy on dips around $559 with SL around $500 for TP of $715.

BCHUSD H4 | Bearish reversalBased on the H4 chart analysis, we could see the price rise to the sell entry, which acts as a pullback resistance and could drop from this level to the downside.
Sell entry is at 560.88, which is a pullback resistance.
Stop loss is at 603.25, which is a pullback resistance.
Take profit is at 506.12, which is a pullback support that aligns with the 78.6% Fibonacci projection.
High Risk Investment Warning
Trading Forex/CFDs on margin carries a high level of risk and may not be suitable for all investors. Leverage can work against you.
Stratos Markets Limited (tradu.com ):
CFDs are complex instruments and come with a high risk of losing money rapidly due to leverage. 65% of retail investor accounts lose money when trading CFDs with this provider. You should consider whether you understand how CFDs work and whether you can afford to take the high risk of losing your money.
Stratos Europe Ltd (tradu.com ):
CFDs are complex instruments and come with a high risk of losing money rapidly due to leverage. 66% of retail investor accounts lose money when trading CFDs with this provider. You should consider whether you understand how CFDs work and whether you can afford to take the high risk of losing your money.
Stratos Global LLC (tradu.com ):
Losses can exceed deposits.
Please be advised that the information presented on TradingView is provided to Tradu (‘Company’, ‘we’) by a third-party provider (‘TFA Global Pte Ltd’). Please be reminded that you are solely responsible for the trading decisions on your account. There is a very high degree of risk involved in trading. Any information and/or content is intended entirely for research, educational and informational purposes only and does not constitute investment or consultation advice or investment strategy. The information is not tailored to the investment needs of any specific person and therefore does not involve a consideration of any of the investment objectives, financial situation or needs of any viewer that may receive it. Kindly also note that past performance is not a reliable indicator of future results. Actual results may differ materially from those anticipated in forward-looking or past performance statements. We assume no liability as to the accuracy or completeness of any of the information and/or content provided herein and the Company cannot be held responsible for any omission, mistake nor for any loss or damage including without limitation to any loss of profit which may arise from reliance on any information supplied by TFA Global Pte Ltd.
The speaker(s) is neither an employee, agent nor representative of Tradu and is therefore acting independently. The opinions given are their own, constitute general market commentary, and do not constitute the opinion or advice of Tradu or any form of personal or investment advice. Tradu neither endorses nor guarantees offerings of third-party speakers, nor is Tradu responsible for the content, veracity or opinions of third-party speakers, presenters or participants.
