Brent Crude bullish trend breakout ahead?The BRENT crude oil remains in a bullish trend, with recent price action showing signs of a breakout within the broader uptrend.
Support Zone: 6508 – a key level from previous consolidation. Price is currently testing or approaching this level.
A bullish rebound from 6508 would confirm ongoing ups
The Silence Before the $70 Storm in Brent OilThe Silence Before the $70 Storm in Brent Oil
Look at the chart.
The energy market is holding its breath.
We are witnessing a classic standoff in Brent Crude.
A battle between two massive forces. And right now, nobody is winning.
🤔 On one side, we have the bears. Look at the yellow line
Brent Oil M30 HTF Discount Reaction and Bullish Continuation📝 Description
BLACKBULL:BRENT crude oil has completed a corrective pullback after a strong impulsive rally and is now stabilizing above a key short-term demand zone. Price has reacted cleanly from the SSL and lower boundary of the recent range, suggesting buyers are defending this area and prepari
Oil is Boiling! 1/23/2026
After CRYPTOCAP:BTC ’s big run to $126K (now cooling off in corrective mode), Silver and Gold are pushing into new highs and closing in on their projected targets. Meanwhile, Oil popped +2.45% today and the chart is heating up — technically it looks primed for a major upside move.
With rising geo
BRENT Oil → Bullish Breakout | Capital Flow Confirmed🛢️ BRENT CRUDE OIL (UKOIL) - Energy Market Capital Flow Blueprint ⚡
Swing/Day Trade | Bullish Triangular Breakout Strategy
📊 ASSET OVERVIEW
Asset Ticker: BRENT CRUDE / UKOIL (ICE Futures Europe)
Current Price Zone: $64.12 USD/BBL (As of Jan 26, 2026)
Market Status: 📈 Bullish Formation Testing Resis
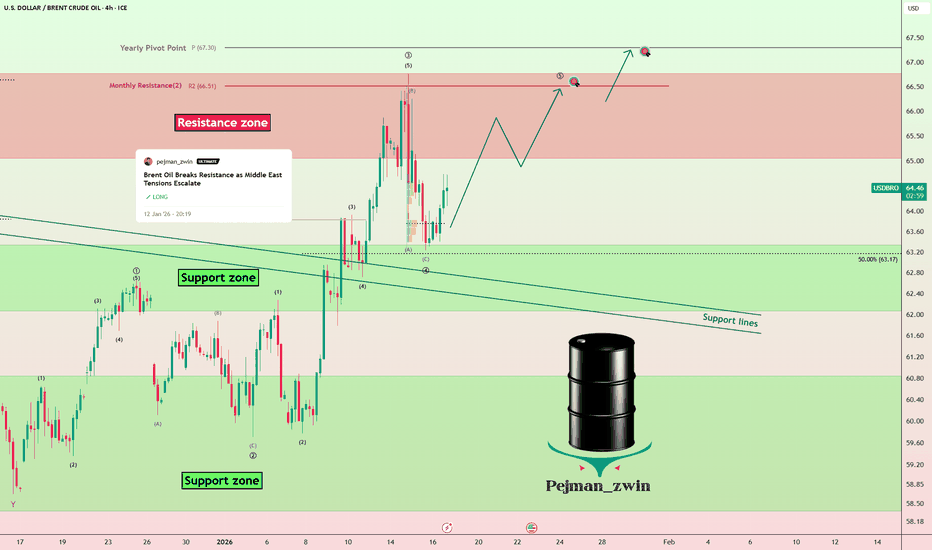
Middle East Risks Keep Brent Oil Bullish — Higher TargetsAs I expected in the previous idea , Brent Crude OIL( BLACKBULL:BRENT ) has risen and reached its targets, with a Risk-To-Reward: 2:01 (full target).
Brent Crude OIL is currently trading near the support zone($63.30-$62.00) and the support lines.
From an Elliott Wave perspective, it appears that
UKOIL/BRENT Chart Shows That OIL Can RallyI am using UKOIL/BRENT chart because there is a direct correlation between this and any other USOIL/WTI chart.
What we have are:
1. It has been falling in a wedge pattern and is coiling. Hence a breakout sooner or later is expected.
2. It has reached an FCO zone which is acting as a good support.
Brent Crude resistance at 6758The BRENT crude oil remains in a bullish trend, with recent price action showing signs of a breakout within the broader uptrend.
Support Zone: 6508 – a key level from previous consolidation. Price is currently testing or approaching this level.
A bullish rebound from 6508 would confirm ongoing ups
Brent Oil — H4 | Bullish Continuation ScenarioBrent Oil — H4 | Bullish Continuation Scenario
Price is holding above key support after a corrective pullback, with structure favoring continuation to the upside.
🧩 Technical Overview
• On the higher timeframe, the market is forming a potential 5th wave, indicating the final impulsive phase of th
See all ideas
Displays a symbol's price movements over previous years to identify recurring trends.


