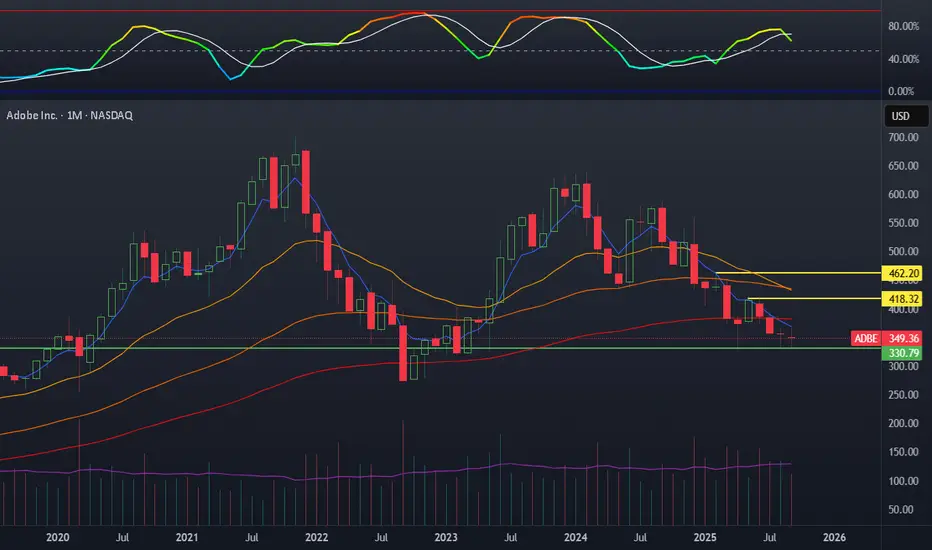
Adobe - The major triangle breakout!🎯Adobe ( NASDAQ:ADBE ) breaks out soon:
🔎Analysis summary:
For the past five years, Adobe has overall been consolidating within a bullish triangle pattern. This triangle seems to be quite similar to the triangle which we saw back in 2012. And with the current retest of the confluence of support, Adobe will now initiate the triangle breakout.
📝Levels to watch:
$360
SwingTraderPhil
SwingTrading.Simplified. | Investing.Simplified. | #LONGTERMVISION
ADBECL trade ideas

ADBE (Adobe Inc.) — 4H TF Pre-Earnings Setup (Buy-Stop)ADBE (Adobe Inc.) — 4H TF | Heikin Ashi
Adobe printed a heavy corrective downtrend, but recently price action broke structure (BOS) at $365 and is now consolidating just below resistance. This makes a pre-earnings breakout buy stop setup attractive if bullish momentum continues.
Earnings are scheduled for today (Sep 11, 2025) after market close — which means volatility will be explosive.
Previous Earnings (Jun 12, 2025):
EPS: $5.06 vs $4.97 est. ✅
Revenue: $5.87B vs $5.88B est. (slight miss)
Upcoming Earnings (Sep 11, 2025):
EPS est: $5.18
Revenue est: $5.92B
Strong beats in prior quarters usually lead to momentum continuation.
🔀 Trend & Setup Logic:
Primary Trend: Still bullish on higher timeframes, despite recent pullback
Short-Term: BOS confirms reversal from downtrend
Pre-Earnings Play: Buy stop above resistance to catch post-earnings breakout
🟩 Key Levels:
Buy Stop Entry: Above $366 → trigger on BOS retest
Stop Loss: $346.79 (below recent HL)
Take Profit: $423.23 (supply zone retest)
Risk/Reward: ~5.67R
🎯 Trade Plan: Pre-Earnings Buy Stop
Entry: $366.00 (pending buy stop order)
Stop Loss: $346.79
Take Profit: $423.23
Risk/Reward: ~5.6R
Max Risk: 1–2% capital (pre-earnings = high volatility risk)
🧭 Trade Management:
If earnings beat → breakout can gap over entry, monitor slippage
If earnings miss → stop could gap through SL (risk management crucial)
Consider reducing position size pre-earnings
Trail SL aggressively above $380 if breakout confirmed
“Trade the reaction, not the earnings.”
⚠️ Disclaimer:
This is not financial advice. Trading earnings events is high risk, especially with gap potential. Use reduced size or options strategies if possible.

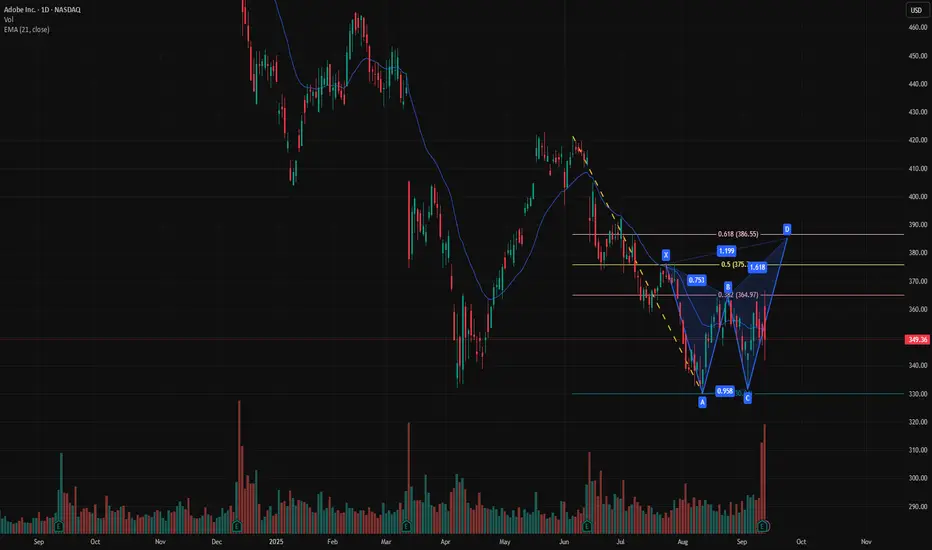
$ADBE Butterfly Harmonic Pattern indicates a bounce to $385NASDAQ:ADBE looks like a Bearish Butterfly Harmonic Pattern forming. D can extend to $385 to finish the pattern, indicating a short term bounce. $385 also ties into the 61.8% retracement resistance at $386.
Harmonics do not project time.
Adobe at major support - Target $603Adobe has been ranging for years to finally let the long term trend catch up. $603 is the target for and it will likely form support above there. Finally Adobe should break out of this range.
This is not a fast trade btw.
Good luck!

Adobe nearing to bottomWith bullish divergence, and spike in volume in last week is Adobe nearing a bottom?
Must hold above 274 for validation of this count.

ADBE gains? or Real gainsLook at this long term bounce from the low 300s to the mid 600s, everyone's been talking about this one and how cheap it is.
I have my own reservations, Competition/Figma/Google/AI ect they are taking it's desert and maybe lunch in the future.....??? Yeah this is probably a good price that could bounce again for some healthy gains. Although as a designer Adobe can suck it!

Adobe | ADBE | Long at $347.44Adobe NASDAQ:ADBE
Technical Analysis:
Trend is, overall, moving sideways. The price gap on the daily chart between $303.29 and $317.87 is likely to be closed in the near-term. The stock may reach the $280's to $290's to form a double bottom before a move up, so short-term investors should note the near-term risks. Long-term, however, if growth projections are accurate, all of those price gaps above the current price are likely to be filled...
Earnings and Revenue Growth
Expected annual revenue growth between 2025-2028 is ~41% (cumulative), growing from around $23.7 billion in 2025 to $33.3 billion in 2028.
EPS growth from $20.7 in 2025 to $26.2 in 2028.
www.tradingview.com
Health
Debt-to-Equity: 0.53x (very good)
Altman's Z-Score/Bankruptcy Risk: 10.2 (excellent/very low risk)
Quick Ratio/Ability to pay current bills: 1.02 (okay, but some risk)
Insiders
Warning: Selling heavily outweighs buying.
openinsider.com
Action
Due to the high-growth potential of NASDAQ:ADBE related to AI and its current "value" (compared purely to the rest of tech), solid health, etc., I am personally going long at $347.44. More shares will be gathered if the price reaches the low $300's or between $280-$300 and the fundamentals remain the same. Only major warning is the amount of insider selling.
Targets in 2028
$450.00 (+29.5%)
$645.00 (+85.6%)

ADBE Potential breakout 385-400 levels inboundAdobe consolidating nicely a break above 363 could see 385-400 levels
Option Market has been supporting the bias with large inflow of OTM bullish options over the past few weeks.

Adobe Trend is, overall, moving sideways. The price gap on the daily chart between $303.29 and $317.87 is likely to be closed in the near-term. The stock may reach the $280's to $290's to form a double bottom before a move up, so short-term investors should note the near-term risks. Long-term, however, if growth projections are accurate, all of those price gaps above the current price are likely to be filled...

ADOBE - $ADBE Starting to pack the bags Starting to like Adobe here. Adobe NASDAQ:ADBE looks more attractive now after approximately a 25% pullback, trading around $349 with a forward P/E in the high teens. The company just raised guidance on the back of strong Q3 results, and its subscription model provides steady cash flow. AI tools like Firefly could drive future growth, but competition from Canva, OpenAI, and others poses a real risk. Some consensus price targets showing near $460 (+30% upside), the stock offers reasonable value.
It’s hovering just above key support in the $340–345 range, which has held multiple times over the past year, while resistance sits near $380–390; a breakout above that level could confirm bullish momentum. The RSI is near neutral (mid-40s), showing consolidation rather than overbought/oversold extremes, and the 200-day moving average around $370 remains a pivot zone to watch.
From a value investor position, Adobe is a moderate buy—as always looking to DCA my way into this one here.

Adobe Earnings Lotto: 365C Targeting 200%+”
🚨 **ADBE Earnings Trade Setup (2025-09-11)** 🚨
🔥 **Play of the Day: Calls**
* 🎯 Strike: **365C**
* 💵 Entry: **11.65**
* 📅 Expiry: **2025-09-12**
* 📈 Confidence: **78% (Moderate Bullish)**
📊 **Targets & Risk**
* 🛑 Stop Loss: **5.83** (-50%)
* 🎯 Profit Target: **34.95** (+200%)
* 📏 Size: 1 contract (≈2% port)
* ⏰ Timing: **Pre-earnings close**
⚡ **Rationale:**
Adobe’s **AI catalysts + flawless 8-quarter beat streak** stack the odds for upside. Fundamentals (margins, FCF, growth) are 🔥, options chain shows liquidity at **365C**, and breakeven only needs \~6.4% move. Quick exit strategy to dodge IV crush.
📊 **Expected Move:** \~8.8%
📈 **IV Rank:** 0.75
💡 **Trade Idea:** Buy 365C @ 11.65 → Stop 5.83 / PT 34.95. Risk\:Reward \~1:4.

Adobe (NASDAQ: ADBE) – Potential Re-Accumulation & Upside Opport🚀 Idea: Adobe (NASDAQ: ADBE) – Accumulation Zone & AI Catalyst
🔍 Technical Analysis
Adobe is currently forming a base around $330–$360 on the weekly chart, which has been tested multiple times.
Supply zones: $550–$650, with a higher resistance near $700.
Momentum: Weekly RSI is showing a bullish divergence (lower lows in price vs. higher lows in momentum), signaling a possible reversal.
Projection: If support holds, price could re-test $550–$650 and potentially extend to $700+.
📊 Fundamentals & Catalysts
Q2 FY2025 Earnings: Revenue $5.87B (+11% YoY), EPS $5.06 vs. $4.48 YoY, with Digital Media ARR growing 12% YoY to $18.09B (Adobe, 2025a).
Digital Experience Segment: Expanded ~10% YoY, strengthening diversified revenue streams (Adobe, 2025a).
Raised Guidance: Full-year revenue outlook upgraded to $23.50-$23.60B and EPS to $20.50-$20.70 (Financial Modeling Prep, 2025).
AI Growth: Firefly and Acrobat AI Assistant adoption continues to drive ARR and premium feature upgrades (MarketWatch, 2025).
⚠️ Risks
Competitive threats from Canva, OpenAI, and other AI-driven platforms (Barron’s, 2025).
Slower enterprise adoption of premium AI features could weigh on margins.
Valuation remains elevated, requiring continued revenue and margin expansion.
📈 WaverVanir Trade Framework
Parameter Value
Entry Zone $330–$360
Stop Loss Below ~$300 (10–12% downside risk)
Target 1 $550–$650
Target 2 $700+
Time Horizon 3–6 months
R/R Potential ~2–3x if support holds
📌 Conclusion
Adobe sits at a critical accumulation level. If support holds, earnings strength + AI adoption momentum could propel price toward $550–$700. A failure to hold $330–$360 support would shift bias bearish toward $300.
#Adobe #ADBE #AI #DigitalMedia #WaverVanir #InstitutionalTrading
References
Adobe. (2025a). Q2 FY2025 financial results. Adobe Investor Relations.
Barron’s. (2025). Adobe earnings and competitive risks. Barron’s.
Financial Modeling Prep. (2025). Adobe raises full-year guidance as AI demand fuels growth.
MarketWatch. (2025). Adobe stock performance and AI catalyst outlook.
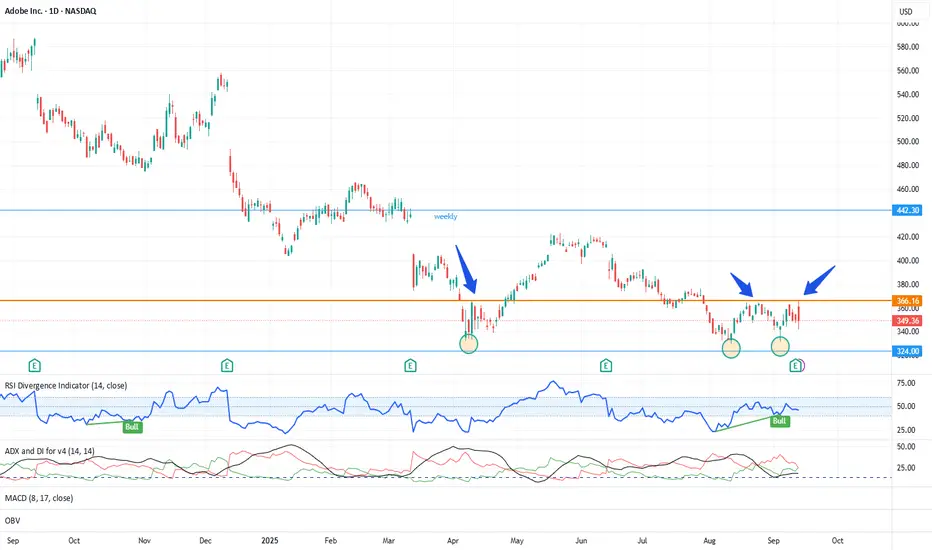
ADBE may surprise you with a recovery moveADBE has been in a downtrend since February 2024 and has been struggling to stay above $550. From April 2025, it has found a decent support near $332 levels and formed a sort of triple bottom (the latest one on 4th Sep. 2025) and confirmed by RSI 40 support. It needs to give a daily closing above $367 for the possible targets of 380, 400 and 420. (For educational purposes only)
Adobe (ADBE) BUYAdobe (ADBE) has embraced generative AI with tools like Firefly, which create text, images, and video. With a huge creative customer base, Adobe has the potential to monetize AI quickly.

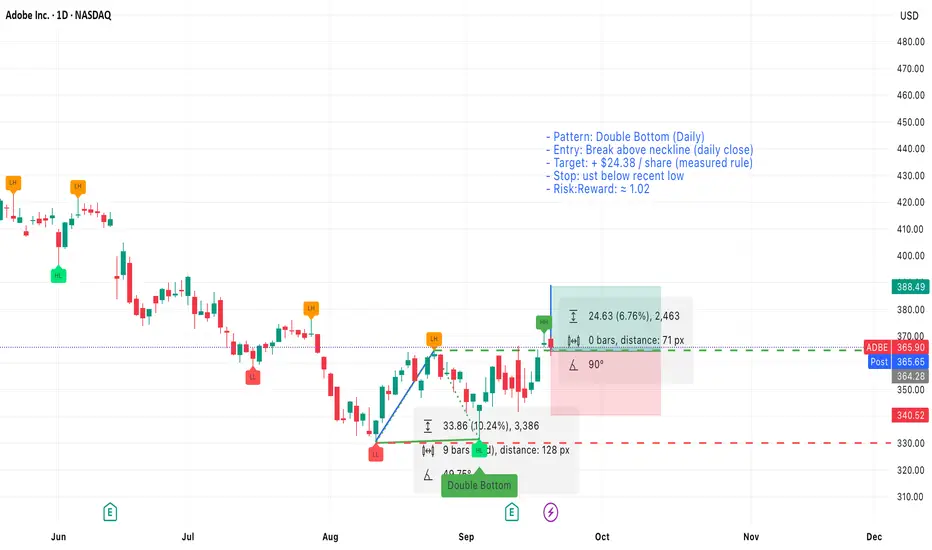
Adobe (ADBE) — Daily — Double BottomSetup
Pattern: Double bottom on the daily chart with two clear lows and a visible neckline.
Timeframe: Daily
Measuring rule (target)
Measure the vertical distance from the bottoms to the neckline and add it to the breakout point. Using this method the measured target equals +$24.38 per share from the breakout.
Entry & trigger
- Enter long on a confirmed close above the neckline (daily close above neckline).
- If you prefer an earlier entry, a volume-backed intraday break above the neckline can be used, but prefer a daily close for confirmation.
Stop loss
- Place stop loss just below the recent low (the second bottom). Use a few cents/pips buffer below that low to avoid noise.
Position sizing & risk
- Risk per share = entry price − stop loss price.
- With the stop placed just below the recent low, risk per share is small and gives a risk/reward ratio ≈ 1.02 .
Given the measured target of +$24.38, ensure your entry and stop sizing produce the stated R:R — example calculations below.
Notes & trade management
- Prefer a daily close above the neckline with increased volume for higher probability.
- If price returns to retest the neckline, consider adding only if support holds and risk remains acceptable.
- Trail stop to breakeven after a significant portion of the measured move is achieved (for example, after +50% of the $24.38 move).
ADBE macro updateADBE pivot time is now or never. I already had a position a few weeks ago and added to a shorter length position this past week. ADBE is in the monthly demand zone. Before earnings, we sat at a PE of 16, and the company bought back 4% of shares in the year. Their growth is picking back up, and revenue remains strong. Their AI products help the business, so the Abode is dead, and the narrative may end. This reminds me of the death of Amazon, Netflix, Google, Microsoft, and countless others that the market was wrong about. Volume is rising on the monthly timeframes.
My plan:
Earlier position: 400$ June calls
New position: 400$ November calls
I choose the more risky bet on this pivot as I am starting to note a lot of intelligent investors mentioning the stock is undervalued. Meanwhile the rest of the market is a bit overheated, people will be looking for value and yield on return. The Free cashflow yield on this stock is the highest its been in a decade.
BTDUSD 1W Chatt in Mar 2020 & ADBE 1W Chart as of 19 Sep 2025Hello friends,
Will ADBE rally like BTC did. This is a question for everyone, but in my opinion it is very well set to continue trending up. what are your thoughts?
If you like my ideas, please hit the like, and follow button.
thank you

Adobe - This triangle breaks now!🪄Adobe ( NASDAQ:ADBE ) just repeats patterns:
🔎Analysis summary:
Back in 2012 we witnessed a major triangle breakout on Adobe. The following bullrun ended in 2021 and Adobe has been consolidating ever since. But now, we are able to see a pattern repetition, with the same bullish triangle forming, which we saw about one decade ago.
📝Levels to watch:
$350, $500
SwingTraderPhil
SwingTrading.Simplified. | Investing.Simplified. | #LONGTERMVISION

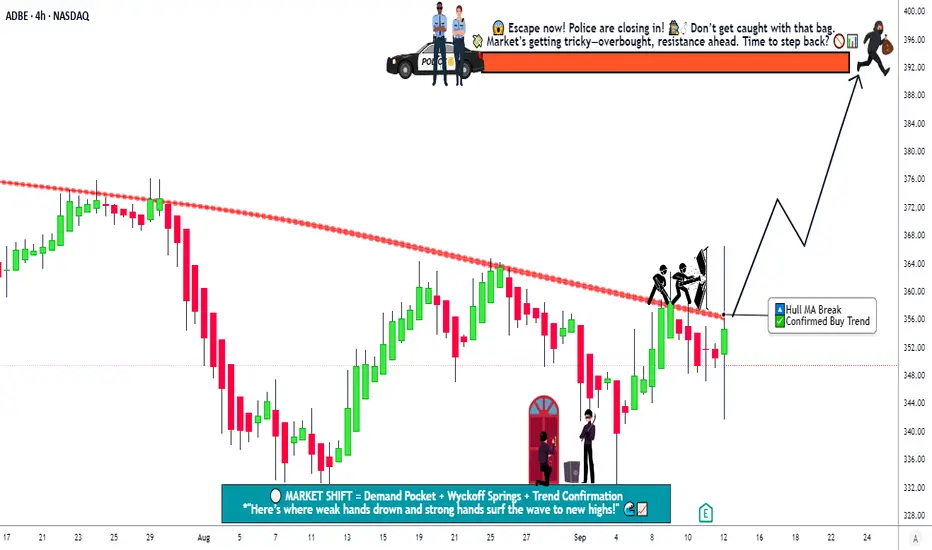
Adobe Technical Analysis! Swing/Day Trade Levels & Strategy🎯 ADBE Stock: The Great Money Heist Plan (Swing/Day Trade) 🤑💰
🚨 Ladies and Gentlemen, Welcome to the Ultimate ADBE (Adobe Inc.) Bullish Breakout Caper!
🚨Get ready to join the Thief OG Crew for a slick, calculated swing/day trade on $ADBE. This is a polished, TradingView-friendly plan designed to maximize views, likes, and potentially catch the Editor’s Pick spotlight! Let’s break it down with a fun yet professional vibe, all while respecting TradingView’s House Rules. 😎
📊 The Setup: Bullish Breakout Pending Order!
✅ Asset: NASDAQ:ADBE (Adobe Inc.)✅ Market Mood: Bullish breakout Pending with the Hull Moving Average crossing at $360.00! 📈✅ Timeframe: Swing/Day Trade (your choice, OG Thieves!)
The Hull Moving Average has flashed a green light 🚦, signaling a breakout. NASDAQ:ADBE is ready to run, and we’re here to grab the loot before the Police Barricade (resistance) stops us! 💪
🕵️♂️ The Thief Strategy: Layered Limit Orders
This is no ordinary trade — it’s a sneaky layered entry plan to maximize your chances of snagging profits. Here’s how we roll:
Entry Levels: Place multiple buy limit orders at these strategic price points to layer your entries like a master thief:
💰 $352.00
💰 $355.00
💰 $360.00
💰 $365.00
Pro Tip: Feel free to add more limit layers based on your risk appetite and market conditions! Be flexible, but stay sharp. 🔍
Why Layering? This strategy lets you scale into the trade, reducing risk if the breakout pulls back slightly before blasting off. It’s like planting multiple traps for the market to fall into! 🕸️
Note: You can enter at any price level that suits your style, but these levels are primed for action. Always confirm with your own analysis, OG Thieves! 🧠
🛑 Stop Loss: Protect Your Loot!
Thief Stop Loss: Set a stop loss at $345.00 after the breakout confirmation at $360.00.
Why? This level keeps you safe from unexpected reversals while giving the trade room to breathe.
Customize It: Adjust your stop loss based on your risk tolerance and strategy.
Dear Ladies & Gentlemen (Thief OG’s), this is your heist — set your SL to match your vibe! ⚠️
Disclaimer: I’m not here to dictate your stop loss. It’s your money, your risk, your rules. Trade responsibly! 😇
🎯 Target: Escape Before the Police Barricade!
Profit Target: Aim for $392.00, where a Police Barricade (strong resistance) awaits, combined with overbought conditions and a potential trap. 🏦
Why $392.00? This level aligns with historical resistance and RSI overbought signals. Grab your profits and escape before the market catches you! 🏃♂️
Disclaimer: Don’t feel locked into my target. Set your own profit goals based on your strategy and risk management. Take the money and run when you’re ready! 💸
🔗 Related Pairs to Watch (and Why!)
To make this heist even smoother, keep an eye on these correlated assets (all in USD):
NASDAQ:MSFT (Microsoft): Adobe and Microsoft move in sync due to their tech sector overlap. If NASDAQ:MSFT is pumping, NASDAQ:ADBE might follow. Watch its price action for confirmation. 📈
NYSE:CRM (Salesforce): Another tech giant with similar market drivers. A bullish move in NYSE:CRM could signal strength in $ADBE. 🧩
AMEX:SPY (S&P 500 ETF): The broader market index often dictates tech stock momentum. If AMEX:SPY is green, it’s a tailwind for $ADBE. 🌍
Key Correlation Point: These assets share exposure to tech sector trends and macroeconomic factors like interest rates or earnings seasons. If they’re trending up, it’s a good sign for our NASDAQ:ADBE heist! 🕵️♀️
📝 Key Notes for Thief OG’s
Confirm the Breakout: Always double-check the Hull Moving Average crossover at $360.00 and volume spikes before jumping in. No reckless heists! 🧐
Risk Management: Layered entries and stop losses are your safes. Don’t risk more than you’re willing to lose. 💼
Escape Plan: Watch for overbought RSI or sudden volume drops near $392.00. That’s your cue to cash out and vanish! 🏃♀️
Stay Flexible: Market conditions change. Adapt your entries, stops, and targets as needed. You’re a thief, not a robot! 🤖
✨ “If you find value in my analysis, a 👍 and 🚀 boost is much appreciated — it helps me share more setups with the community!”
#ADBE #StockMarket #SwingTrading #DayTrading #BullishBreakout #TechnicalAnalysis #HullMovingAverage #TradingStrategy #MoneyHeist #InvestSmart
📢Disclaimer: This is a fun, strategic plan, but it’s not financial advice. Always do your own research and trade at your own risk, OG Thieves! 🙌
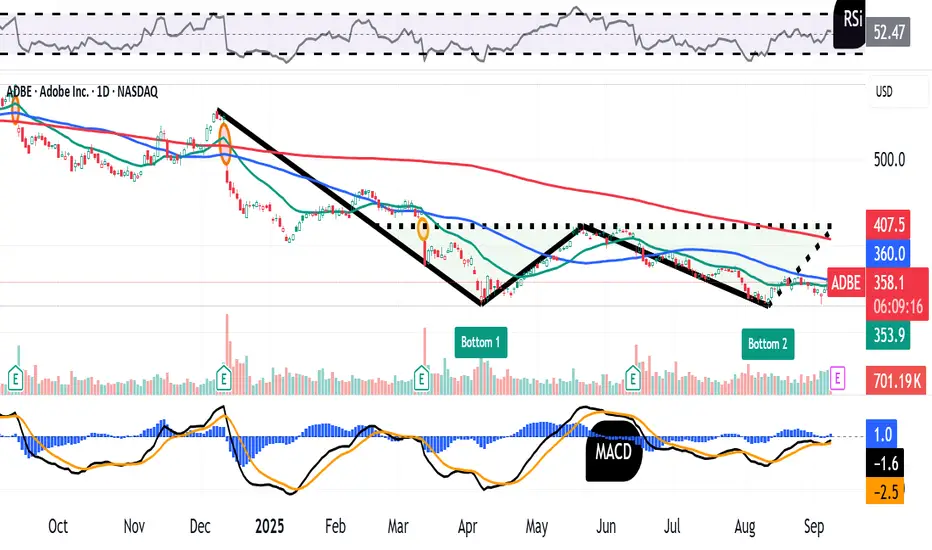
Adobe Has Been Falling For 19 Months. What Its Chart SaysAdobe NASDAQ:ADBE was once known as one the "Cloud Kings," but the 2020s haven't been kind the stock, which has fallen nearly 50% from its November 2021 peak. Let's see what ADBE's technical and fundamental analysis shows us heading into this week's earnings report.
Adobe's Fundamental Analysis
Adobe peaked intraday its current cycle back in February 2024 at $465.70, but has seen about a year and a half of share erosion since then.
The stock closed Monday at $358.66, down 23% from that February 2024 top and 48.7% from ADBE's $699.54 all-time intraday high of November 2021.
It's also been an up-and-down few weeks for Adobe fundamentally speaking.
First, Morgan Stanley named ADBE, Amazon NASDAQ:AMZN and Johnson Controls NYSE:JCI in early August as three stocks that might stand out as large-cap, high-quality adopters as AI plays a central role in their respective business strategies.
But some two weeks later, Dan Ives of Wedbush removed ADBE, C3.ai NYSE:AI , CyberArk NASDAQ:CYBR and Elastic NYSE:ESTC from his "IVES AI Revolution 30 list," replacing them with CrowdStrike NASDAQ:CRWD , Roblox NYSE:RBLX , GE Vernova NYSE:GEV and Nebius NASDAQ:NBIS .
Still, a day after that, Adobe launched its new AI-powered "Acrobat Studio" globally. The suite offers PDF Spaces, AI Assistant and Adobe Express Premium to customers starting at $24.99 a month.
All of these developments came just shortly ahead of Adobe's fiscal Q3 earnings, which the firm plans to release Thursday after the bell.
Wall Street is expecting Adobe to report $5.18 of adjusted earnings per share for the period on some $5.9 billion of revenue. That would represent an 11.4% gain from the $4.65 of adjusted EPS that Adobe saw in the same period last year, as well as about 9.2% growth from the firm's $5.4 billion in year-ago revenues.
That's a big deal because Adobe has a streak of seven consecutive quarters of double-digit percentages in annual revenue growth going, and a 9.2% y/y gain would break that.
That said, it's not like the Street is down on this stock. Of the 28 sell-side analysts that I can find that cover ADBE, 25 have revised their earnings estimates higher for the latest quarter since the period began. (One analyst cut their estimate, while two made no changes.)
Still, UBS analyst Karl Keirstead (who's rated at five stars out of a possible five by TipRanks), recently reduced his Adobe price target price to $400 from a previous $430. (Keirstead reiterated his hold-equivalent "Neutral" rating on the stock.)
However, Omar Sheikh of Redburn Atlantic last week reiterated his "Sell" rating and $280 target price on the stock. (TipRanks rates Sheik at four stars.)
Adobe's Technical Analysis
Now let's look at ADBE's one-year chart running through last Thursday:
Readers will notice something potentially disturbing in this chart.
On one hand, ADBE has been building up a "double-bottom" pattern of bullish reversal through all of 2025, as marked with the jagged black line and green boxes above.
This pattern's upside pivot would be the apex of the pattern's center, which is right around $422. That should be a positive set-up.
However, ADBE hit resistance on the way to this rally as the stock approached its 50-day Simple Moving Average (or "SMA," marked with a blue line) in late August. The stock then quickly gave back its 21-day Exponential Moving Average (or "EMA," denoted with a green line).
That apparently turned the swing crowd against Adobe and forced the stock's rally to fail.
Is the attempted rally out of this double bottom truly dead? Not quite -- at least not unless or until the stock makes a new cycle low.
But looking at Adobe's other technical indicators, it seems like there could be more traffic clogging the road ahead.
For instance, the stock's Relative Strength Index (the gray line at the chart's top) is in decline. While not technically oversold, it's been sub-neutral since early to mid-August.
Meanwhile, Adobe's daily Moving Average Convergence Divergence indicator (or "MACD," marked with black and gold lines and blue bars at the chart's bottom) looks quite bearish.
The histogram of the stock's 9-day EMA has moved back into negative territory after having spent a few weeks above the zero-bound.
Additionally, the 12-day EMA (the black line) has crossed back below the 26-day EMA (the gold line). It's typically quite a bearish signal when that happens and both of those lines stand below zero. In fact, both lines have been in negative territory since late June.
All in, this chart brings an old saying to mind: "Approach with caution."
(Moomoo Technologies Inc. Markets Commentator Stephen “Sarge” Guilfoyle had no position in ADBE at the time of writing this column, but did have a long position in CRWD.)
This article discusses technical analysis, other approaches, including fundamental analysis, may offer very different views. The examples provided are for illustrative purposes only and are not intended to be reflective of the results you can expect to achieve. Specific security charts used are for illustrative purposes only and are not a recommendation, offer to sell, or a solicitation of an offer to buy any security. Past investment performance does not indicate or guarantee future success. Returns will vary, and all investments carry risks, including loss of principal. This content is also not a research report and is not intended to serve as the basis for any investment decision. The information contained in this article does not purport to be a complete description of the securities, markets, or developments referred to in this material. Moomoo and its affiliates make no representation or warranty as to the article's adequacy, completeness, accuracy or timeliness for any particular purpose of the above content. Furthermore, there is no guarantee that any statements, estimates, price targets, opinions or forecasts provided herein will prove to be correct.
The Analyst Ratings feature comes from TipRanks, an independent third party. The accuracy, completeness, or reliability cannot be guaranteed and should not be relied upon as a primary basis for any investment decision. The target prices are intended for informational purposes only, not recommendations, and are also not guarantees of future results.
Moomoo is a financial information and trading app offered by Moomoo Technologies Inc. In the U.S., investment products and services on Moomoo are offered by Moomoo Financial Inc., Member FINRA/SIPC.
TradingView is an independent third party not affiliated with Moomoo Financial Inc., Moomoo Technologies Inc., or its affiliates. Moomoo Financial Inc. and its affiliates do not endorse, represent or warrant the completeness and accuracy of the data and information available on the TradingView platform and are not responsible for any services provided by the third-party platform.
$ADBE Buy the DIP! Solid earnings with double beat!- NASDAQ:ADBE had a strong quarter today and double beat. Market is discounting the scale at which they are operating.
- Free cash flow at these levels can consistently beat on EPS. They aren't fighting with AI but integrating with AI

Taking advantage of high option premium to sell putsthe premium from selling puts exp this Friday 09/12 will be used to finance buy-to-open calls exp 10.17
How Adobe Can Defend Its Business
A. Deepen Generative AI Leadership
• Expand Firefly and AI-driven features across all Creative Cloud apps, aiming for “AI first” workflows that outpace startups’ basic automation.
• Launch workflow automation modules that shorten time-to-publish by 40%, embedding AI into layout, color matching, and asset management.
B. Democratize Access Through Pricing Innovation
• Introduce a low-cost “Creative Essentials” tier (e.g., $9.99/month) tailored for emerging markets and hobbyists to counter Canva’s freemium appeal.
• Offer perpetual-license “classic” bundles on select apps to retain users resistant to subscriptions, defending against Corel and Affinity’s one-time-buy model.
C. Fortify Ecosystem and Integrations
• Open up APIs and SDKs to third-party developers, fueling a plug-in marketplace that rivals Figma’s community-built extensions and Boris FX’s visual-effects suite integration.
• Embed deeper connections between Creative Cloud, Experience Cloud, and Document Cloud to lock in enterprise clients pursuing unified marketing-to-sales-to-service pipelines.
D. Accelerate Mobile-First and Simplified UX
• Complete a full-featured mobile Photoshop and Illustrator with 80% of desktop capabilities, pre-empting mobile-only disruptors like Canva and Affinity Photo for iPad.
• Streamline UI learnability by introducing “beginner” and “pro” modes, reducing onboarding friction that drives users to simpler platforms.
E. Invest in Enterprise and Education Partnerships
• Bundle Creative Cloud Essentials with Salesforce and Microsoft 365 enterprise contracts, offering integrated licensing discounts to large accounts.
• Expand educational outreach by partnering with universities and online-learning platforms, making Adobe tools the de facto standard for students and new professionals.
F. Leverage M&A and Targeted Acquisitions
• Acquire or invest in AI-native startups specializing in mobile video editing, real-time collaboration, or niche generative-media innovations to stay ahead of agile challengers.
• Integrate acquired technologies quickly into the Adobe ecosystem, ensuring new capabilities amplify existing Creative Cloud and Experience Cloud value.

Adobe Wave Analysis – 8 September 2025- Adobe reversed from support zone
- Likely to rise to resistance level 380.00
Adobe recently reversed up from the support zone located between the key support level 335.00 (which has been reversing the price from April) and the lower daily Bollinger Band.
The upward reversal from this support zone stopped the previous short-term ABC correction ii from the end of August.
Given the strength of the support level 335.00 and the clear bullish divergence on the daily Stochastic indicator, Adobe can be expected to rise toward the next resistance level 380.00.
