NFLX Weekly Outlook (Oct 21–25): Bulls Regain Control Eyes on $1,267 Breakout 🚀
📆 Daily Chart — Macro Trend and Structure Overview
Market Structure:
Netflix (NFLX) printed a powerful rebound candle off the $1,134–$1,160 demand zone, signaling renewed buying interest. This level has acted as a structural support in multiple swing cycles. The daily chart shows a recent BOS (Break of Structure) after a series of CHoCH formations, suggesting that smart money may be repositioning long after liquidity was swept below October lows.
The move from $1,134 to $1,238 marks the first aggressive bullish displacement in weeks, shifting momentum back toward the mid-trend channel.
Supply & Demand / Order Blocks:
* Demand Zone: $1,134–$1,160 (major re-accumulation zone).
* Intermediate Supply Zone: $1,238–$1,267 (previous CHoCH and liquidity pocket).
* Macro Supply Zone: $1,310–$1,330 (upper liquidity target).
Indicator Confluence:
* 9 EMA > 21 EMA: Cross underway — bullish realignment possible by Tuesday.
* MACD: Momentum reversal confirmed with a fresh histogram cross above zero.
* Stoch RSI: Rising from 20 → 67 — strong mid-cycle momentum.
* Volume: Bullish expansion day, matching the most recent BOS in September.
The daily chart suggests that the $1,134 base is secure, and price may now aim to retest $1,267 before consolidating again.
⏱️ 1-Hour Chart — Short-Term Swing Setup
Market Structure:
The 1-hour chart shows clear transition from bearish to bullish structure with a CHoCH → BOS sequence near $1,200 and $1,240. Price broke out of the descending channel and is consolidating right below resistance at $1,245–$1,247, the zone of the most recent BOS.
Momentum remains strong, and any pullback toward $1,217–$1,225 should offer dip-buying opportunities if volume holds.
Supply & Demand / OB Zones:
* Demand Zone: $1,217–$1,225 (recent breakout OB).
* Supply Zone: $1,244–$1,267 (major liquidity resistance).
Indicator Confluence:
* 9 EMA > 21 EMA: Bullish continuation structure.
* MACD: Rising histogram — bullish volume expansion.
* Stoch RSI: Above 70, showing continuation with mild overbought stretch.
Trade Scenarios:
* Bullish Setup: Buy dips near $1,217 → Target $1,267 → Stop below $1,199.
* Bearish Setup: Rejection from $1,267 → Short to $1,217 → Stop above $1,280.
Bias favors upside while price holds above $1,217 — breaking $1,267 could trigger momentum extension toward $1,300.
🕒 15-Minute Chart — Intraday Scalping View
Market Structure:
The 15-min timeframe shows a clean ascending channel, with multiple BOS confirming short-term trend strength. The most recent CHoCH near $1,237 was defended quickly, proving that intraday buyers are actively holding higher lows.
The pattern shows minor compression under resistance, suggesting either a small consolidation before a push to $1,260+ or a quick retest of $1,230 support.
Supply & Demand / OB Levels:
* Demand Zone: $1,235–$1,238 (minor OB base).
* Supply Zone: $1,247–$1,255 (scalp resistance range).
Indicator Confluence:
* 9 EMA & 21 EMA: Strong uptrend alignment.
* MACD: Momentum fading slightly — potential micro pullback.
* Stoch RSI: Overbought (80+) — short-term pause likely.
Scalp Plan:
* Bullish Case: Buy retest at $1,235–$1,238 → Target $1,247 → Stop $1,230.
* Bearish Case: Fade $1,247–$1,250 → Target $1,235 → Stop $1,255.
Intraday trend remains bullish — buyers in control while above $1,230. Expect a range break toward $1,255–$1,267 if volume persists.
📊 GEX (Gamma Exposure) & Options Sentiment
NFLX’s GEX structure indicates a bullish gamma expansion zone between $1,220–$1,260. Dealer exposure favors stability near $1,240, creating a “magnet” effect that can accelerate upward once $1,247 breaks.
Key GEX Levels:
* Highest Positive GEX: $1,260 (major call resistance).
* 2nd Call Wall: $1,280 (extension target).
* Put Support: $1,160 (floor of dealer hedging zone).
* IVR: 37 — moderate, rising ahead of next catalyst.
* Call Flow: 29.1% — improving, consistent with accumulation behavior.
Dealers are currently neutral-to-positive gamma, supporting controlled bullish drift. Above $1,260, expect increased dealer hedging pressure to lift price further.
🎯 Closing Outlook
Netflix is showing strong signs of accumulation and breakout potential following a clean structure shift on both the daily and hourly timeframes. Volume confirmation and positive gamma support add confidence to the bullish scenario.
A sustained close above $1,247–$1,267 could trigger a measured move toward $1,300–$1,310.
If rejected, a controlled pullback to $1,217–$1,225 remains a healthy buy zone for continuation.
Disclaimer:
This analysis is for educational purposes only and does not constitute financial advice. Always perform your own due diligence before trading.
Trade ideas
Broker Platform Selection in the World MarketIntroduction
In the ever-evolving world of financial markets, broker platforms play a pivotal role as the primary gateway between investors and global trading opportunities. Whether an individual investor, institutional trader, or algorithmic system, the selection of a reliable broker platform determines not only the ease of trading but also the safety, cost-efficiency, and overall success of investment strategies. As financial globalization deepens and digital technology revolutionizes access to assets, understanding how to select the right brokerage platform in the world market has become a critical skill.
The broker selection process involves evaluating several dimensions—such as regulation, cost structure, asset variety, technology infrastructure, customer service, and market reputation. This essay explores the key considerations for broker platform selection, analyzes leading global brokers, and highlights future trends shaping the brokerage industry worldwide.
1. The Role of Broker Platforms in the Global Market
A broker platform acts as an intermediary that allows clients to access financial markets such as equities, commodities, currencies, and derivatives. In the pre-digital era, brokers were physical intermediaries operating through phone orders and manual execution. However, today’s brokerages provide seamless, technology-driven platforms offering real-time price feeds, advanced charting tools, and automated trade execution.
The global brokerage ecosystem is divided broadly into retail brokers (serving individual investors) and institutional brokers (serving hedge funds, banks, and large-scale investors). Retail platforms such as Interactive Brokers, eToro, TD Ameritrade, Saxo Bank, and IG Markets have made global investing accessible to millions of individuals. Institutional platforms like Goldman Sachs, Morgan Stanley, and JP Morgan serve large portfolios through direct market access and specialized trading infrastructure.
2. Key Factors to Consider When Choosing a Broker Platform
Selecting a broker platform requires a careful balance between regulatory security, technological efficiency, and cost-effectiveness. Below are the major factors influencing this choice:
a. Regulation and Security
Regulation is the cornerstone of trust in brokerage services. Regulated brokers are supervised by recognized financial authorities that enforce rules for client protection, fair trading, and fund segregation. Some of the world’s leading regulatory bodies include:
U.S. Securities and Exchange Commission (SEC) and Financial Industry Regulatory Authority (FINRA) – United States
Financial Conduct Authority (FCA) – United Kingdom
Australian Securities and Investments Commission (ASIC) – Australia
Cyprus Securities and Exchange Commission (CySEC) – Europe (EU Passporting)
Monetary Authority of Singapore (MAS) – Asia
Choosing a broker regulated by these authorities ensures investor protection against fraud, misuse of funds, or unfair market practices. Regulation also affects the level of leverage and investor compensation schemes in case of insolvency.
b. Trading Instruments and Market Access
Different brokers specialize in specific asset classes. A good platform provides access to multiple markets such as:
Equities (stocks) – Global exchanges like NYSE, NASDAQ, LSE, BSE
Forex (currencies) – Major, minor, and exotic currency pairs
Commodities – Precious metals, energy, and agricultural products
Derivatives – Options, futures, and CFDs
Cryptocurrencies – Bitcoin, Ethereum, and other digital assets
Global traders often prefer multi-asset platforms (e.g., Interactive Brokers, Saxo Bank) that allow portfolio diversification under one account.
c. Trading Costs and Fees
Costs directly affect profitability. Traders must analyze the following cost structures:
Commissions – Fee per trade or per lot
Spreads – Difference between bid and ask price
Swap/Overnight Charges – For leveraged positions held overnight
Account Maintenance and Withdrawal Fees – Administrative costs
Discount brokers have disrupted traditional brokerage models by offering zero-commission trading on equities and ETFs. However, hidden costs such as wide spreads or payment-for-order-flow practices should also be considered.
d. Trading Technology and Platform Usability
The effectiveness of a broker often depends on its trading technology. Platforms must offer:
Real-time market data and low latency execution
Advanced charting tools and technical indicators
Algorithmic trading and API integration
Mobile and web trading accessibility
User-friendly interface with customizability
Platforms like MetaTrader 4/5, cTrader, and TradingView dominate global forex and CFD trading, while stock investors use Thinkorswim, TWS (Interactive Brokers), and SaxoTraderGO for professional-grade analysis.
e. Customer Support and Educational Resources
Efficient customer support builds trust, especially in fast-moving markets. Leading brokers provide 24/5 or 24/7 multilingual support via live chat, email, and phone. Additionally, brokers that offer educational resources, webinars, and market analysis attract both beginners and professionals aiming to refine their skills.
f. Deposit and Withdrawal Flexibility
Global investors seek seamless fund management. Platforms supporting multiple payment gateways—like bank transfers, credit/debit cards, PayPal, and digital wallets—offer convenience. Moreover, brokers with transparent and quick withdrawal processes stand out in terms of reliability.
3. Types of Broker Platforms in the Global Market
Different types of brokers cater to different trader profiles. Understanding these categories helps align one’s needs with the right platform.
a. Full-Service Brokers
Full-service brokers offer personalized investment advice, portfolio management, research insights, and dedicated support. They charge higher commissions but are suitable for long-term investors. Examples include Charles Schwab, Fidelity, and Morgan Stanley Wealth Management.
b. Discount Brokers
Discount brokers provide basic trading services with low or no commissions. They focus on technology-driven self-directed trading rather than advisory services. Examples: Robinhood, Zerodha (India), and Interactive Brokers.
c. ECN/STP Brokers
Electronic Communication Network (ECN) or Straight-Through Processing (STP) brokers connect traders directly with liquidity providers, ensuring transparent and fast execution with tighter spreads. Popular ECN brokers include IC Markets, Pepperstone, and FXTM.
d. Proprietary Trading Platforms
Some brokers develop their own proprietary systems offering unique interfaces and tools—for example, TD Ameritrade’s Thinkorswim, SaxoTraderGO, and IG’s platform. These platforms often provide integrated research, charting, and order management tools.
4. Leading Global Broker Platforms
The world’s top broker platforms are known for their innovation, reliability, and regulatory compliance. Below are some prominent examples:
Interactive Brokers (IBKR) – Offers global access to 150+ markets, low fees, and advanced research tools; ideal for professionals.
Saxo Bank – Denmark-based multi-asset broker with a strong European presence and excellent user interface.
TD Ameritrade – Known for Thinkorswim platform and strong U.S. market research.
eToro – Leader in social and copy trading, allowing users to replicate trades of top investors.
IG Group – Pioneer in CFD and forex trading with strong regulation and mobile apps.
CMC Markets – Highly regulated UK broker with excellent execution and analytical tools.
Plus500 – User-friendly CFD platform targeting retail traders.
Each platform differs in trading philosophy—some focus on active day traders, while others cater to long-term investors seeking global diversification.
5. The Impact of Technology on Broker Platform Selection
Technological innovation has reshaped brokerage operations across the world. The rise of AI-driven analytics, automated trading bots, mobile apps, and cloud-based execution systems have made trading faster and more efficient.
Artificial Intelligence (AI): Platforms use AI to offer predictive market insights, personalized recommendations, and sentiment analysis.
Robo-Advisors: Automated portfolio managers like Wealthfront and Betterment are revolutionizing passive investing.
Blockchain Integration: Decentralized trading platforms (DEXs) like Uniswap and dYdX enable direct asset ownership without intermediaries.
APIs for Algo-Trading: Institutional-grade brokers allow users to build algorithms that execute trades based on custom strategies in milliseconds.
Cloud Computing: Enables scalable and high-speed trading environments with reduced latency.
Traders increasingly prefer brokers that stay technologically updated and compatible with global financial innovations.
6. Global Regulatory Environments and Compliance
Every region follows unique regulatory frameworks to maintain investor safety and financial stability.
United States: The SEC and FINRA impose strict reporting and capital adequacy requirements. Brokers like Charles Schwab and TD Ameritrade are benchmarked for compliance.
United Kingdom: The FCA mandates transparency and negative balance protection.
European Union: MiFID II ensures uniform investor protection and reporting standards.
Asia-Pacific: ASIC, MAS, and SEBI (India) regulate brokers with growing global recognition.
A broker operating in multiple regions must comply with cross-border laws, money laundering (AML) protocols, and data protection acts (like GDPR).
7. Risk Management and Investor Protection
Reliable broker platforms provide risk management tools like stop-loss orders, margin calculators, volatility alerts, and negative balance protection to safeguard traders from extreme market movements. Additionally, segregated client funds ensure that user deposits remain separate from the broker’s operational funds, providing a safety net in case of financial distress.
Investor compensation schemes, such as SIPC (U.S.) and FSCS (UK), further protect client capital if the broker defaults.
8. The Future of Global Brokerage Platforms
The future of brokerage platforms will be defined by digital transformation, AI, and sustainability-driven finance. Key trends include:
Fractional Ownership: Allows small investors to buy portions of expensive assets like Amazon or Tesla shares.
Social Trading Networks: Copy trading and community-driven analysis continue to grow globally.
Decentralized Finance (DeFi): Blockchain-based platforms will challenge traditional broker models.
AI and Big Data: Predictive analytics will make decision-making more intelligent.
Sustainability Investing (ESG): Brokers are adding environmental, social, and governance filters to support responsible investing.
As boundaries between technology and finance blur, broker platforms are evolving into holistic financial ecosystems integrating trading, analytics, learning, and social collaboration.
Conclusion
Selecting the right broker platform in the world market is one of the most important decisions for any trader or investor. A well-chosen platform ensures not only access to global markets but also enhances profitability through transparency, speed, and security. The ideal broker must combine regulatory compliance, advanced technology, diversified market access, low costs, and responsive customer service.
In today’s interconnected financial ecosystem, the competition among global brokers is fierce. With technological disruptions like AI, blockchain, and decentralized finance reshaping the industry, the broker platforms of the future will not merely execute trades—they will empower users with data-driven intelligence, global connectivity, and complete control over their investment journey.
Ultimately, successful trading begins not just with knowledge or capital, but with the right broker platform—a partner that bridges global opportunities with local expertise, ensuring that investors can navigate the dynamic world markets with confidence and precision.

Netflix Ready to Fall ??Technical Analysis Summary
Chart Type: Daily (1D)
Ticker: NFLX (Netflix Inc.)
Current Price: $1,194.00 (as of October 16, 2025)
Recent Movement: Down by -0.77%
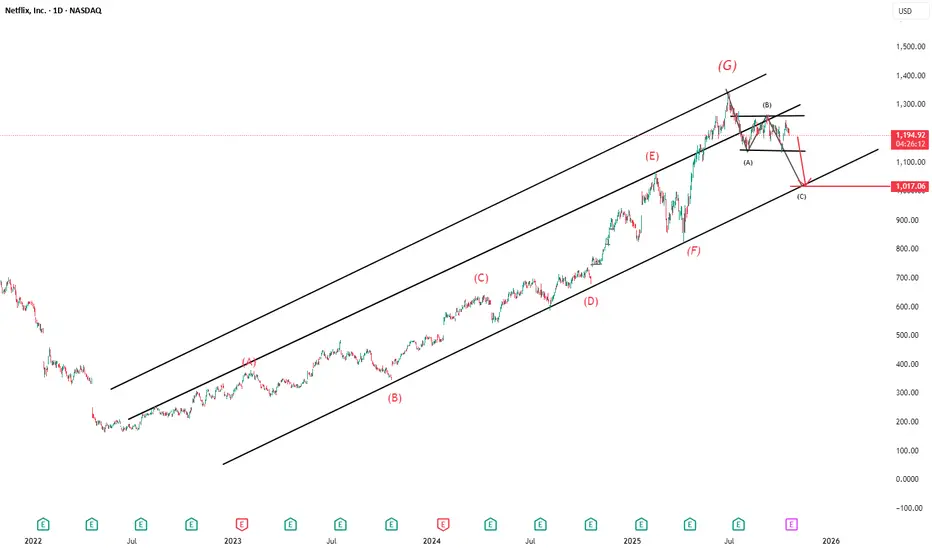
📈 Elliott Wave Labels (in red)
The stock shows a 7-wave impulse move labeled from (A) to (G), forming an upward channel.
The latest top is marked as (G) near $1,450.
A corrective structure appears to be forming post-(G), labeled as (A), (B), (C) in black.
📉 Bearish Outlook
The chart suggests a potential further decline:
From the current level ($1,194) to near $1,107 (short-term support).
Then possibly down to around $1,017 (marked as wave (C)).
📊 Trend Channels
Two parallel ascending channels:
The inner channel guided the move from early 2023 until mid-2025.
The outer channel includes the recent peak at (G), showing possible overextension.
The price has broken below the upper boundary, hinting at a trend change.
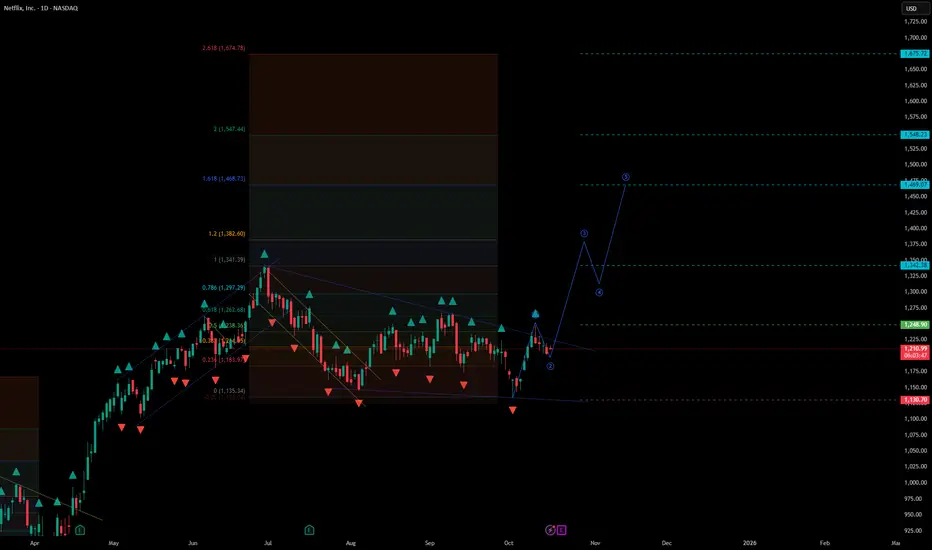
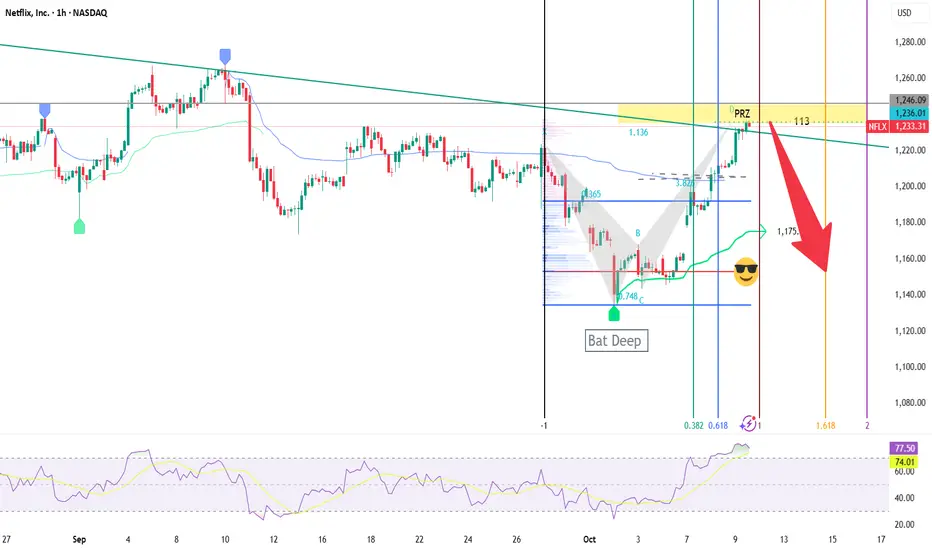
Netflix – Trend Reversal and Impulsive Setup#Netflix – Trend Reversal and Impulsive Setup
Current price: $1,215.6
Netflix is showing early signs of a trend reversal after completing a multi-month corrective phase. The structure suggests a shift toward a new impulsive rally within the broader bullish framework.
🧩 Technical Overview
• After a prolonged pullback from the June highs, price found support near $1,130, forming a local base.
• The descending channel was broken to the upside — a signal of potential momentum change.
• Price is now consolidating above the breakout zone, building the foundation for an upward impulse.
📈 Scenario
• The structure resembles the start of a new impulsive leg following the correction.
• As long as the market holds above $1,130, bullish continuation remains the dominant view.
• Stop-loss: below the recent swing low at $1,130.
• Upside targets:
– $1,250–$1,270 – short-term retest of breakout zone
– $1,340–$1,380 – key resistance and mid-cycle confirmation zone
– $1,470–$1,550 – major Fibonacci target range
– $1,670+ – extended bullish objective if momentum accelerates
⚙️ Market Context
• The broader trend remains constructive as long as price stays above the breakout structure.
• Momentum shift coincides with improving sentiment across large-cap techs.
• A sustained move above $1,340 would confirm renewed strength and open the path toward the $1,500 area.
🧭 Summary
Netflix has likely completed its corrective phase and is preparing for a new upside cycle.
Holding above $1,130 keeps the bullish bias intact, while a breakout above $1,340–$1,380 would confirm trend continuation toward $1,470–$1,550 and beyond.
NETFLIX PERFECT LONGNASDAQ:NFLX On the daily TF has committed a large sweep of liquidity, then has broken the previous swing high and is now consolidating bullishly towards the daily 50ema, where I am looking for a reaction to the upside. At the lowest there could be a spike down to the 50fib on a fast retracement, so SL below. But rejection of 4hr 50ema and 100ema is telling that the move is ready to happen and likely not to retrace back down much further. I am targeting the previous long term highs as a tp.
I feel confident in this entry, the price action is clean. Bollinger band volatility confluence is missing which is my only hesitation, however with the price action being as strong as it is, I am more than willing to make the entry.
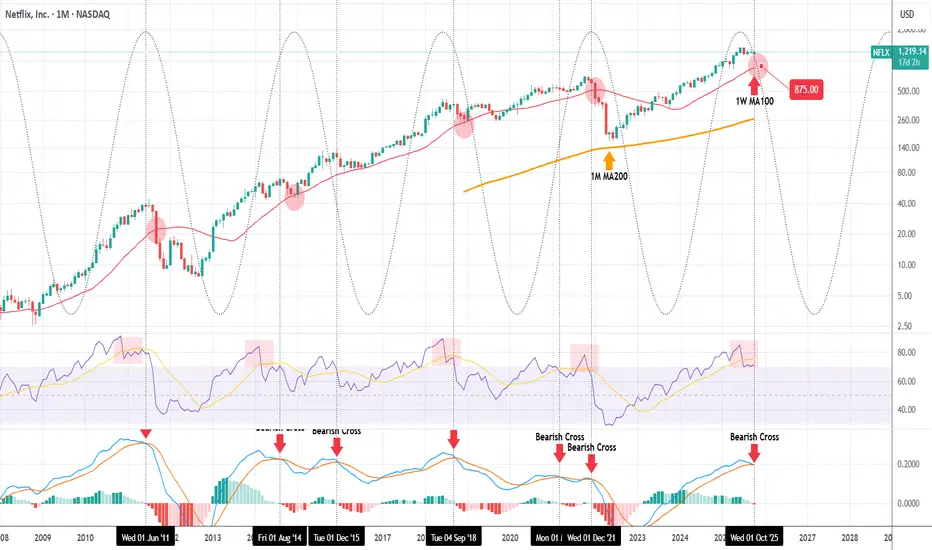
NETFLIX has topped and can pull back to $875.Netflix (NFLX) has formed one of its strongest Sell Signals in the last 15 years. That's the 1M MACD Bearish Cross.
The stock has been trading on a very consistent pattern ever since the 2008 U.S. Housing Crisis and during this multi-year span, the best indicator for a Top has been the 1M MACD forming a Bearish Cross.
As you can see, this month marks the 7th such occurrence since June 2011. All previous formations resulted in the price pulling-back to touch at least its 1W MA100 (red trend-line). Only two times the correction has been bigger that was that first Bearish Cross in June 2011 and the most recent December 2021, which almost hit the 1M MA200 (orange trend-line), the market's ultimate multi-decade Support.
These Top signals match fairly well the Sine Waves, which as you see form somewhat reliable Cycles. Those confirm that Netflix currently stands on a long-term Top. Even the 1M RSI is similar to the Top patterns suggested by the Sine Waves.
As a result, we expect the stock to start a multi-month technical pull-back, with a fair projection of making contact with its 1W MA100 being $875.00. That's our Target.
-------------------------------------------------------------------------------
** Please LIKE 👍, FOLLOW ✅, SHARE 🙌 and COMMENT ✍ if you enjoy this idea! Also share your ideas and charts in the comments section below! This is best way to keep it relevant, support us, keep the content here free and allow the idea to reach as many people as possible. **
-------------------------------------------------------------------------------
💸💸💸💸💸💸
👇 👇 👇 👇 👇 👇
ESG Investing and Sustainable Finance1. Defining ESG Investing
ESG investing refers to the practice of incorporating Environmental, Social, and Governance factors into investment analysis and decision-making processes. Unlike traditional investing, which primarily evaluates financial metrics, ESG investing considers the broader impact of business activities on society and the environment.
1.1 Environmental Factors
Environmental criteria assess a company’s stewardship of natural resources and its impact on the planet. Key areas include:
Climate Change and Carbon Emissions: Evaluating a company’s carbon footprint and strategies for transitioning to a low-carbon economy.
Resource Management: Efficient use of energy, water, and raw materials.
Pollution and Waste: Efforts to minimize environmental contamination.
Biodiversity and Ecosystem Protection: Initiatives to protect natural habitats and biodiversity.
1.2 Social Factors
Social criteria examine how companies manage relationships with employees, suppliers, customers, and communities. Key considerations include:
Labor Practices: Fair wages, worker safety, and freedom of association.
Diversity and Inclusion: Representation of minority groups in leadership and workforce.
Human Rights: Ensuring operations do not contribute to violations of human rights.
Community Engagement: Positive contributions to local communities through philanthropy or development programs.
1.3 Governance Factors
Governance evaluates how companies are directed and controlled, ensuring accountability and transparency. This includes:
Board Structure and Independence: Diverse and independent boards to oversee management.
Executive Compensation: Aligning incentives with long-term performance.
Ethical Business Practices: Anti-corruption policies, transparency, and compliance with regulations.
Shareholder Rights: Ensuring stakeholders have a voice in major corporate decisions.
2. Sustainable Finance
Sustainable finance is a broader concept that encompasses ESG investing but also includes financing activities aimed at promoting sustainability across the economy. It involves directing capital toward projects and initiatives that support long-term environmental and social goals while managing financial risks. Sustainable finance integrates ESG considerations into lending, investing, insurance, and risk management practices.
2.1 Key Objectives
The primary objectives of sustainable finance are:
Risk Mitigation: Identifying ESG-related risks that could impact financial returns.
Capital Allocation: Directing funds to projects that promote sustainability, such as renewable energy or social infrastructure.
Market Transformation: Encouraging companies to adopt sustainable practices through financial incentives.
Long-term Value Creation: Balancing financial returns with positive societal impact.
2.2 Instruments in Sustainable Finance
Several financial instruments are used to advance sustainable objectives:
Green Bonds: Debt securities earmarked for environmental projects, such as renewable energy, energy efficiency, or pollution control.
Social Bonds: Bonds that fund initiatives addressing social challenges, such as education, healthcare, and affordable housing.
Sustainability-linked Loans (SLLs): Loans where the interest rate is tied to achieving ESG targets.
Impact Investing: Investments explicitly intended to generate measurable social or environmental benefits alongside financial returns.
ESG Funds and ETFs: Mutual funds or exchange-traded funds that prioritize companies with strong ESG performance.
3. Evolution of ESG Investing
ESG investing has evolved from niche socially responsible investing (SRI) to a mainstream approach. The evolution can be traced through several phases:
3.1 Socially Responsible Investing (SRI)
In the 1960s and 1970s, SRI gained popularity as investors sought to avoid companies involved in tobacco, alcohol, or apartheid-related activities. The primary motivation was ethical or religious rather than financial.
3.2 ESG Integration
By the early 2000s, investors began integrating ESG factors into financial analysis. This marked a shift from exclusionary approaches to proactive risk and opportunity assessment.
3.3 Impact Investing
Emerging in the 2010s, impact investing focuses on generating measurable social or environmental outcomes alongside financial returns. It emphasizes accountability and transparency in reporting impact.
3.4 Global Adoption
Today, ESG investing is a global phenomenon, with trillions of dollars in assets under management guided by ESG criteria. Regulatory frameworks, corporate disclosure standards, and investor demand have accelerated adoption.
4. ESG Integration Approaches
Investors employ several methodologies to integrate ESG factors into decision-making:
4.1 Negative Screening
Excludes companies involved in controversial activities (e.g., tobacco, fossil fuels, weapons manufacturing).
4.2 Positive Screening
Selects companies with strong ESG performance relative to peers. This approach rewards leaders in sustainability.
4.3 ESG Integration
Incorporates ESG factors into traditional financial analysis to assess risk-adjusted returns. For example, evaluating a company’s exposure to climate risks can influence its valuation.
4.4 Thematic Investing
Focuses on specific ESG themes, such as renewable energy, gender equality, or sustainable agriculture.
4.5 Shareholder Engagement
Investors actively engage with companies to encourage better ESG practices, including proxy voting, dialogue with management, and filing resolutions.
5. Measuring ESG Performance
Measuring ESG performance is challenging due to the lack of standardized metrics. Several frameworks and rating systems help investors assess ESG risks and opportunities:
5.1 ESG Ratings Agencies
Companies like MSCI, Sustainalytics, and FTSE Russell provide ESG ratings based on multiple criteria, including environmental impact, labor practices, and governance structures.
5.2 Reporting Standards
Global Reporting Initiative (GRI): Provides comprehensive sustainability reporting guidelines.
Sustainability Accounting Standards Board (SASB): Focuses on financially material ESG factors for investors.
Task Force on Climate-related Financial Disclosures (TCFD): Encourages reporting on climate-related risks and opportunities.
5.3 Key Performance Indicators (KPIs)
Companies track quantitative and qualitative ESG metrics, such as carbon emissions, employee diversity ratios, or board independence.
6. Drivers of ESG Investing
Several factors have contributed to the rapid growth of ESG investing:
6.1 Regulatory Pressure
Governments and regulatory bodies worldwide are increasingly mandating ESG disclosure and sustainability reporting, making ESG integration a compliance necessity.
6.2 Investor Demand
Institutional investors, such as pension funds and sovereign wealth funds, are prioritizing ESG investments due to risk mitigation, reputational considerations, and long-term value creation.
6.3 Risk Management
ESG issues, such as climate change, social unrest, or corporate governance scandals, pose financial risks. Integrating ESG factors helps mitigate these risks.
6.4 Societal Awareness
Consumers and stakeholders increasingly favor businesses with responsible and ethical practices, influencing corporate behavior and investment decisions.
6.5 Technological Advancements
Data analytics, artificial intelligence, and blockchain enhance ESG data collection, measurement, and verification.
7. ESG Investing and Financial Performance
A key debate revolves around the relationship between ESG investing and financial returns. Empirical studies suggest:
Companies with strong ESG performance often demonstrate lower operational risks, higher efficiency, and better reputation.
ESG portfolios may experience lower volatility and improved risk-adjusted returns over the long term.
However, short-term financial trade-offs can exist, particularly in industries requiring high capital expenditure for sustainability transitions.
Overall, evidence increasingly supports the notion that ESG integration can enhance long-term financial performance while promoting sustainability.
8. Challenges in ESG Investing
Despite its growth, ESG investing faces several challenges:
8.1 Lack of Standardization
Different rating agencies and frameworks produce inconsistent ESG scores, complicating investment decisions.
8.2 Greenwashing
Companies may exaggerate or misrepresent ESG initiatives to attract investment, undermining credibility.
8.3 Data Gaps
Limited or unreliable ESG data, particularly in emerging markets, poses analytical challenges.
8.4 Balancing Financial and Social Returns
Investors must navigate the trade-offs between financial performance and societal impact.
8.5 Regulatory Fragmentation
Differing ESG regulations across regions create complexity for multinational investors.
9. Global Trends in ESG Investing
ESG investing has gained global momentum, with several notable trends:
9.1 Growth in Assets Under Management (AUM)
ESG-focused funds and sustainable investment vehicles have seen exponential growth. As of 2025, global ESG AUM exceeds $50 trillion.
9.2 Climate-Focused Investing
Climate risk has emerged as a primary driver, leading to increased investment in renewable energy, electric vehicles, and carbon mitigation technologies.
9.3 Integration in Emerging Markets
Emerging economies are increasingly adopting ESG principles, with opportunities in clean energy, social infrastructure, and sustainable agriculture.
9.4 Policy and Regulatory Developments
The European Union’s Sustainable Finance Disclosure Regulation (SFDR), the U.S. SEC’s climate disclosure requirements, and similar initiatives worldwide are shaping investment behavior.
9.5 Technological Innovation
Fintech solutions, AI-powered ESG analytics, and blockchain-based impact verification enhance transparency and reporting.
10. Case Studies
10.1 Renewable Energy Funds
Funds investing in solar, wind, and hydroelectric projects demonstrate how ESG investing can align financial returns with environmental impact.
10.2 Gender Lens Investing
Investment funds focusing on companies promoting gender equality in leadership roles have shown positive social outcomes without sacrificing returns.
10.3 Green Bonds
Green bond issuance has financed infrastructure projects that reduce carbon emissions, demonstrating how capital markets can support sustainability.
11. Future of ESG Investing and Sustainable Finance
The future of ESG investing and sustainable finance appears promising, driven by:
Enhanced Standardization: Efforts to harmonize ESG reporting standards will improve comparability and trust.
Integration with AI and Big Data: Advanced analytics will enable more precise ESG risk assessment.
Focus on Net-Zero Transitions: Investors will increasingly finance decarbonization projects to meet global climate goals.
Increased Regulatory Convergence: Global alignment of ESG rules will facilitate cross-border sustainable investment.
Emergence of New Asset Classes: Instruments such as carbon credits, biodiversity credits, and sustainability-linked derivatives will grow.
Sustainable finance is likely to become central to global capital allocation, making ESG principles a core aspect of investment strategy rather than an optional add-on.
Conclusion
ESG investing and sustainable finance represent a fundamental shift in the global financial ecosystem. By integrating environmental, social, and governance considerations, investors can mitigate risks, seize opportunities, and contribute to a more sustainable future. The evolution from socially responsible investing to sophisticated ESG strategies reflects the growing recognition that long-term financial performance is intrinsically linked to sustainability.
Despite challenges like greenwashing, data gaps, and regulatory fragmentation, ESG investing continues to gain momentum globally. Technological advancements, policy support, and rising societal expectations are driving adoption across industries and regions. As sustainable finance becomes mainstream, it promises to reshape capital markets, align economic activity with global sustainability goals, and create value for both investors and society at large.
In essence, ESG investing is not just an ethical choice; it is a strategic imperative that blends profit with purpose, demonstrating that responsible finance can drive both economic and social progress.

NFLX LongThe broader market structure on NFLX (15-minute) remains bullish, supported by a clear sequence of higher highs and higher lows. The most recent Change of Character (CHoCH) occurred near $1,257.5, where price temporarily broke minor structure to the downside, signaling a potential short-term correction rather than a full reversal. Since no decisive Break of Structure (BOS) has occurred below a major higher low, the overall trend continues to favor buyers, with the current pullback likely serving as a retracement within that broader uptrend.
The supply zones between $1,225–$1,248 are moderate in strength. The upper zone near $1,247 previously triggered a sharp rejection, confirming active sellers there, while the lower two supply pockets closer to $1,225–$1,235 appear partially mitigated—indicating reduced selling pressure and a potential pathway for price to reclaim those levels. The nearest demand zone around $1,215–$1,210 remains intact, where buyers stepped in aggressively earlier, creating a strong impulse that broke prior structure to the upside.
Within the region currently highlighted, price is retracing toward that $1,215–$1,210 demand zone, showing decelerating bearish momentum as candles shrink in range and wicks appear at the lows. This behavior suggests that sellers are losing strength and that buyers could soon reassert control. A bullish reaction from this zone would likely drive price back toward $1,235, and if momentum continues, into $1,245–$1,247, where liquidity and unmitigated supply remain.
From a footprint perspective, the recent downward leg likely shows diminishing sell delta and light absorption from passive buyers—supportive of a near-term reversal setup. Watch for a delta shift into positive territory or a cluster of bid absorption at the base of demand to confirm that transition.
Trade bias: bullish continuation after pullback. Expect a bounce from $1,215–$1,210 toward $1,245–$1,247.
Invalidation: a clean break and close below $1,210, which would shift control to sellers and suggest a deeper retracement toward $1,185.
Momentum: still favors buyers overall, though currently consolidating before likely reaccumulation.

The Role and Impact of Agencies in Global Finance and Trading1. Understanding the Concept of Agencies in Global Finance
Agencies in global finance refer to both public and private institutions that are entrusted with regulatory, supervisory, analytical, and facilitative roles within the global financial ecosystem. They act as intermediaries between governments, corporations, and investors to ensure that financial activities are conducted fairly and efficiently. The primary types of agencies include:
Regulatory Agencies – Such as the U.S. Securities and Exchange Commission (SEC), the Commodity Futures Trading Commission (CFTC), and the European Securities and Markets Authority (ESMA), which enforce laws and ensure transparency.
Rating Agencies – Institutions like Moody’s, Standard & Poor’s (S&P), and Fitch Ratings that assess the creditworthiness of governments, corporations, and financial instruments.
Monetary Agencies – Central banks and supranational institutions such as the International Monetary Fund (IMF) and the World Bank, which manage monetary policy, financial stability, and economic development.
Trade and Financial Agencies – The World Trade Organization (WTO) and the Bank for International Settlements (BIS) regulate trade practices and provide frameworks for financial cooperation among nations.
Collectively, these agencies influence market confidence, liquidity, capital allocation, and cross-border investment flows — all of which are essential to global trading operations.
2. The Importance of Regulatory Agencies in Global Finance
Regulatory agencies serve as the guardians of financial integrity. Their primary mission is to ensure fair trading practices, prevent manipulation, and maintain investor trust.
2.1 Market Oversight and Investor Protection
Global financial markets operate with vast sums of capital and involve millions of participants. Regulatory agencies impose rules that protect investors from fraud, insider trading, and market abuse. For instance:
The U.S. SEC enforces laws against securities fraud, ensuring corporate transparency through mandatory filings.
The European Securities and Markets Authority (ESMA) harmonizes regulation across EU member states, preventing regulatory arbitrage.
Such oversight helps maintain confidence in the global financial system — a crucial element for the smooth functioning of international trade and investment.
2.2 Maintaining Systemic Stability
Regulatory agencies monitor systemic risks that can destabilize markets. During crises such as the 2008 global financial meltdown, agencies tightened regulations, introduced Basel III norms, and imposed capital adequacy requirements to strengthen banking resilience.
By enforcing these standards, agencies ensure that financial institutions maintain sufficient buffers to withstand shocks, thereby preventing contagion effects across global markets.
2.3 Promoting Fair Competition
Agencies such as the Federal Trade Commission (FTC) in the United States and the European Commission’s Directorate-General for Competition monitor mergers and acquisitions to prevent monopolistic practices. This ensures fair market competition, innovation, and equal opportunity for firms engaged in global trade.
3. Credit Rating Agencies: Shaping Investment Decisions
Credit rating agencies are among the most influential actors in the financial world. Their ratings affect how investors perceive the creditworthiness of sovereign nations, corporations, and financial instruments.
3.1 Role of Credit Ratings in Global Trading
Credit ratings act as signals of financial health. When agencies assign a high rating (e.g., AAA), it implies low risk, encouraging foreign investment and reducing borrowing costs. Conversely, downgrades can trigger capital flight, higher yields, and economic contraction.
For example:
A downgrade of a country’s sovereign debt can increase its cost of borrowing in global markets.
Corporate bond ratings influence investment fund allocations, liquidity, and interest rates.
3.2 Controversies and Global Impact
While ratings are essential, they have also faced criticism. During the 2008 crisis, agencies were accused of inflating ratings on mortgage-backed securities, contributing to the market collapse. Since then, reforms have sought to improve transparency, accountability, and conflict-of-interest management.
Nonetheless, rating agencies continue to be critical in shaping cross-border capital movements and influencing investor sentiment in global trade.
4. Monetary and Financial Agencies: IMF, World Bank, and BIS
4.1 International Monetary Fund (IMF)
The IMF plays a central role in stabilizing the global economy. It provides financial assistance to countries facing balance-of-payments crises, monitors global economic trends, and offers policy advice to foster sustainable growth.
In global trading, the IMF helps maintain exchange rate stability and encourages free trade by ensuring liquidity through its Special Drawing Rights (SDR) mechanism.
4.2 World Bank
The World Bank focuses on long-term economic development and poverty reduction. Through its financial and technical assistance, it facilitates infrastructure development, which in turn boosts trade and investment. Roads, ports, and digital connectivity projects funded by the World Bank enhance global supply chains, promoting smoother trade flows.
4.3 Bank for International Settlements (BIS)
Known as the “central bank of central banks”, BIS fosters international monetary and financial cooperation. It sets global banking standards (like Basel I, II, and III) that ensure financial stability. Through its regulatory guidelines, BIS influences how banks manage liquidity and credit risks, which directly affects global trading capital and interest rate dynamics.
5. Trade and Economic Agencies: Facilitating Global Commerce
5.1 World Trade Organization (WTO)
The WTO governs international trade by establishing fair-trade rules, reducing tariffs, and resolving disputes. Its policies ensure predictability and transparency in trade relations, thereby influencing the financial transactions underpinning global commerce.
For example, when the WTO mediates trade conflicts (like the U.S.–China tariff disputes), the outcomes significantly impact global markets, commodity prices, and investor confidence.
5.2 Organisation for Economic Co-operation and Development (OECD)
The OECD fosters economic cooperation and policy alignment among member nations. By promoting responsible taxation, anti-bribery measures, and sustainable investment practices, it enhances investor trust and corporate accountability in global trade.
6. Impact of Financial Agencies on Currency and Capital Markets
6.1 Influence on Exchange Rates
Monetary agencies and central banks have a profound impact on foreign exchange (forex) markets. Through interventions, interest rate adjustments, and monetary policy decisions, they affect currency values — which in turn influence trade competitiveness and capital flows.
For instance, when the U.S. Federal Reserve raises interest rates, the U.S. dollar strengthens, making imports cheaper and exports less competitive, thereby reshaping global trade balances.
6.2 Regulation of Capital Flows
Agencies set rules that regulate the flow of capital between nations. The IMF monitors these flows to prevent speculative attacks on currencies and financial contagion — where instability in one market spreads to others. Proper regulation ensures smoother functioning of global capital markets, essential for international trade financing.
7. Technological and ESG Agencies: The New Frontier of Global Finance
7.1 Financial Technology (FinTech) Oversight
As digital trading platforms, cryptocurrencies, and algorithmic trading gain prominence, new regulatory agencies have emerged to oversee digital finance. Institutions like the Financial Conduct Authority (FCA) in the UK and the U.S. CFTC have introduced frameworks for crypto assets, digital securities, and online trading to prevent cyber fraud and enhance transparency.
7.2 Environmental, Social, and Governance (ESG) Standards
Agencies now emphasize sustainable finance. Organizations such as the United Nations Principles for Responsible Investment (UNPRI) and the Task Force on Climate-Related Financial Disclosures (TCFD) promote ESG reporting standards.
By linking environmental and social impact with financial performance, these agencies are reshaping global trading norms — driving capital toward green and ethical investments.
8. Challenges and Criticisms of Global Financial Agencies
Despite their significance, financial agencies face multiple challenges:
Overregulation vs. Market Freedom: Excessive rules may stifle innovation and market efficiency.
Conflict of Interest: Especially among rating agencies that are paid by the entities they rate.
Unequal Representation: Developing nations often argue that institutions like the IMF and World Bank favor Western economies.
Delayed Responses: Bureaucratic processes sometimes hinder timely interventions during crises.
Technological Lag: The rapid rise of decentralized finance (DeFi) and cryptocurrencies outpaces traditional regulatory frameworks.
These limitations underscore the need for continual evolution in agency governance and accountability.
9. The Future of Agencies in Global Finance
As global markets become more interconnected and digitized, agencies must adapt to new realities. The future landscape will likely see:
Integrated Global Regulation: Greater cooperation among international agencies to standardize cross-border financial regulations.
Digital Financial Oversight: Stronger frameworks for blockchain, AI-driven trading, and cyber resilience.
Sustainability-Linked Policies: ESG standards becoming mandatory for international financial reporting.
Decentralized Agency Roles: New institutions emerging to govern decentralized finance and tokenized assets.
Agencies that evolve with innovation, transparency, and inclusiveness will define the next era of global financial stability and growth.
10. Conclusion
Agencies serve as the nervous system of global finance, transmitting information, enforcing discipline, and maintaining equilibrium across an increasingly complex trading ecosystem. From regulatory oversight to monetary stabilization and sustainability advocacy, their influence pervades every aspect of global trade and investment.
In a world where financial transactions transcend borders within milliseconds, the role of agencies in ensuring trust, fairness, and resilience has never been more vital. While challenges persist — ranging from bias and bureaucracy to technological disruption — their continued evolution will determine how effectively global finance can navigate uncertainty, foster inclusive growth, and sustain economic stability in the decades ahead.
Looking for puts immediately on NFLX! A+!OptionsMastery:
🔉Sound on!🔉
📣Make sure to watch fullscreen!📣
Thank you as always for watching my videos. I hope that you learned something very educational! Please feel free to like, share, and comment on this post. Remember only risk what you are willing to lose. Trading is very risky but it can change your life!

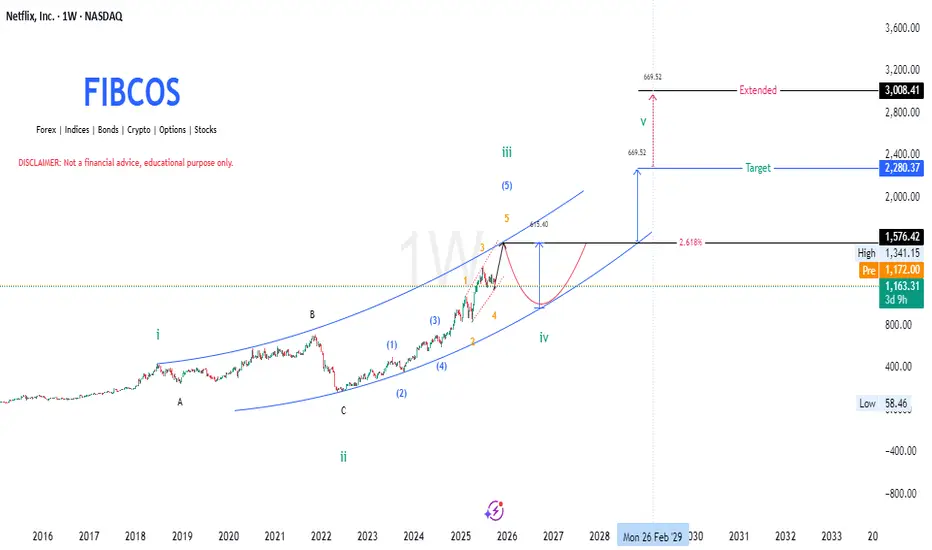
Netflix (NFLX) - Descriptive Analysis by FIBCOS📘 NFLX 2009–2029 Descriptive Analysis
This is a detailed Elliott Wave Theory -based outlook for Netflix (NFLX) stock from around 2009 to the projected future of 2029, and it incorporates Fibonacci retracement & extensions, Smart Money Concepts (SMC) , and Price Action structure within a channel.
Let’s break this down chronologically and structurally:
🌀 Wave Theory Confluence (Elliott Wave Structure)
The long-term structure of Netflix (NFLX) from 2009 to the projected 2029 period follows a classic Elliott Wave cycle, now realigned with the cycle top in mid-2018 and the macro correction ending in mid-2022.
1. Cycle Wave i (2009–2018):
NFLX entered a powerful multi-year rally, forming five sub-waves within this first major impulse. This long rally ended in mid-2018 , marking the top of Cycle Wave i .
2. Cycle Wave ii – ABC Correction (2018–2022):
From the 2018 top, the price entered a prolonged and complex 4-year correction, unfolding as a classic A-B-C corrective structure.
Wave A began the decline with a sharp markdown.
Wave B was a fake recovery, leading to Wave C, a deeper liquidation into mid-2022 , completing the correction.
This phase aligns with a major redistribution cycle where smart money exited positions, and retail investors were caught in hope rallies.
3. Cycle Wave iii (2022–2025):
After finding a bottom in mid-2022, the stock launched a new impulsive rally , forming five sub-waves (1–5) of a powerful Wave iii
Momentum accelerated in wave 3 of iii (typical in Elliott Wave), and the structure is now peaking as of late 2025, around $1,576.42.
This marks the expected completion of Wave iii, with signals pointing toward a correction.
4. Cycle Wave iv (Expected 2025–2027):
A corrective wave iv is expected to unfold, possibly returning toward the lower bound of the long-term ascending channel.
According to the principle of alternation , since wave ii was deep and complex, wave iv may be shallower or more sideways.
5. Cycle Wave v (Expected 2027–2029):
After the wave iv correction, a final impulsive leg — Wave v — is expected to push the price higher, targeting around $2,280.37 , with a potential extended move to $3,008.41 .
This will complete the macro 5-wave cycle that began in 2009.
📐 Fibonacci Confluence
The Fibonacci structure supports these wave formations:
The 2.618 extension of the previous impulse wave (measured from the 2022 bottom) projects a price target near $2,280.37 , aligning with historical extension zones.
The extended target at $3,008.41 aligns with the upper boundary of the long-term channel — often reached during euphoric final waves.
Prior retracements during wave ii and the anticipated retracement in wave iv fall into common Fibonacci pullback zones (0.382–0.618).
Fibonacci tools confirm that price has behaved symmetrically within the wave cycles, and provide high-probability zones for both correction and expansion.
🧠 Smart Money Concept (SMC)
From a Smart Money perspective, the chart reflects a complete institutional cycle:
Distribution Zone (2017–2018):
Smart money exited during the late stages of Cycle Wave i. This aligns with the cycle top in mid-2018 , often accompanied by overvaluation and high optimism.
Re-Accumulation Phase (2018–2022):
The 4-year correction allowed institutional players to accumulate at discounted prices during wave C. Retail was largely shaken out, and liquidity was swept multiple times.
Expansion Phase (2022–2025):
From the 2022 bottom, price moved sharply upward in a clean impulse (Wave iii), confirming institutional interest. Gaps, strong breakouts, and efficient trends reflected low-resistance expansion driven by smart money.
Future Distribution (2029?):
Around the projected $2,280–$3,008 range (Wave v), expect distribution signs —including deviation from trend, order block mitigation, and liquidity grabs. These are typical before a larger market reset.
Smart Money Concepts help explain the why behind each wave: fear and euphoria don’t happen randomly — they are often orchestrated phases of value transfer.
📊 Price Action Structure
The long-term price action of NFLX reinforces the wave count and market psychology:
2009–2018 (Wave i):
Price action showed a steady trend of higher highs and higher lows , with smooth breakouts and momentum-driven runs.
2018–2022 (Wave ii correction):
A breakdown in structure occurred. Lower highs and a wide, overlapping correction defined this multi-year distribution. Key support levels were breached and retested as resistance — a classic bearish shift in structure.
2022–2025 (Wave iii):
Clean, impulsive movement resumed. Breakouts, bullish flags, and retests marked key continuation zones. Market structure flipped back bullish with efficient rallies.
2025–2027 (Wave iv expected):
A retracement is likely toward previous demand zones , possibly aligning with wave 4 of the lower-degree impulse, respecting Elliott’s guideline of wave 4 often retracing to the territory of wave 4 of the previous degree.
2027–2029 (Wave v projection):
Anticipate price pushing into new highs, with potential overextension . However, bearish divergence and slowing momentum could foreshadow the macro top.
This structure shows how technical behavior mirrors emotional and fundamental phases — from greed to fear, and back again.
📆 Timeline Summary (2009–2029)
2009–2018:
Powerful multi-year impulse forms Cycle Wave i , ending in mid-2018.
2018–2022:
A deep, multi-legged ABC correction forms Cycle Wave ii , ending in mid-2022.
2022–2025:
Explosive impulsive rally forms Cycle Wave iii , currently completing around $1,576.42.
2025–2027 (Expected):
A corrective pullback forms Cycle Wave iv , likely more sideways or shallow in structure.
2027–2029 (Expected):
Final rally completes Cycle Wave v , with price targets between $2,280.37 and $3,008.41 , ending the macro Elliott structure.
🔚 Conclusion
With the cycle top revised to mid-2018 and the correction ending mid-2022 , the chart structure becomes even more aligned with classic Elliott Wave theory and Smart Money behavior.
Netflix’s long-term chart is a perfect confluence of:
Elliott Wave structure (impulse → correction → impulse),
Fibonacci precision,
Institutional manipulation (SMC), and
Clear price action behavior.
The roadmap to 2029 shows exciting bullish potential, but also highlights the need for caution near projected macro top zones — where institutional distribution may quietly unfold again.
📘 DISCLAIMER: This is a structural, educational market outlook. Not financial advice. Please do your own due diligence and risk management.
#Netflix, #NFLX, #Nasdaq #WaveTheory, #Fibonacci, #SmartMoney, #PriceAction
$NFLX Call Alert – Oct 31 ’25 $1230 Calls | 28% ROI PotentialEnter: NASDAQ:NFLX OCT 31 2025 $1230 CALLS
Buy in Price: $54.47 - $55.25
Take Profit: $69.72
Stop Bleeding: $47.93
ROI Potential: 28%
Exit Within: 344 Minutes
International Finance TransformedNavigating the New Era of Global Economic Integration.
1. The Evolution of International Finance
International finance traditionally referred to cross-border trade in capital, foreign exchange, and investment. Its foundations were built on fixed exchange rate systems, gold standards, and government-managed monetary frameworks. But with globalization, deregulation, and digitalization, this landscape has evolved beyond recognition.
The late 20th century saw the liberalization of capital markets—countries began dismantling barriers to trade and investment, allowing free flow of capital and fostering multinational growth. Simultaneously, technological innovation revolutionized communication and transaction systems, enabling real-time trading across continents.
By the early 21st century, financial globalization had reached new heights. Institutions like the International Monetary Fund (IMF), World Bank, and World Trade Organization (WTO) played pivotal roles in creating standardized policies for global trade and finance. Today, international finance is not just about currency exchange or capital movement—it encompasses digital finance, cryptocurrency markets, sovereign debt, climate finance, and even artificial intelligence-driven economic modeling.
2. Drivers of Transformation
Several key forces have fueled the transformation of international finance:
a. Technological Innovation
Technology has redefined the financial world. The rise of fintech, blockchain, and digital payment systems has altered how nations conduct cross-border transactions. Decentralized finance (DeFi) and cryptocurrencies challenge traditional banking, while artificial intelligence and big data analytics enhance risk management and financial forecasting.
The introduction of central bank digital currencies (CBDCs) is another monumental shift. Nations like China, India, and the European Union are experimenting with digital versions of their currencies to make international trade faster, safer, and more transparent.
b. Globalization and Trade Liberalization
Globalization remains a fundamental pillar of international finance. As trade barriers diminished, supply chains became more integrated, and capital markets opened, global financial interdependence deepened. Investments from institutional players now span multiple continents, linking the fortunes of economies like never before.
However, this interdependence also makes the world more vulnerable to shocks. A financial crisis in one region can quickly become a global contagion—just as the 2008 financial crisis demonstrated.
c. Geopolitical Realignment
Geopolitics plays a defining role in shaping international finance. The ongoing tensions between major economies—like the U.S. and China—have shifted the dynamics of global trade, currency valuation, and capital flow. Sanctions, tariffs, and shifting alliances constantly influence investment sentiment and financial stability.
Moreover, emerging economies have gained prominence. Countries like India, Brazil, Indonesia, and Nigeria are now key players in global financial discussions, representing the voice of the Global South in institutions traditionally dominated by Western powers.
d. Sustainability and Green Finance
Climate change has introduced a new dimension to finance: sustainability. Governments and corporations alike are now integrating environmental, social, and governance (ESG) criteria into investment decisions. Green bonds, carbon credits, and climate finance mechanisms have become critical tools in combating environmental challenges.
The shift toward sustainable finance is not only ethical but also strategic. Investors increasingly demand transparency and accountability from corporations, and green investments are proving to be both profitable and future-proof.
3. The Rise of Digital and Decentralized Systems
The 21st century has ushered in a financial revolution powered by digital innovation. The emergence of blockchain technology, cryptocurrencies, and decentralized finance (DeFi) has disrupted traditional banking and monetary systems.
Bitcoin’s inception in 2009 marked a turning point. Initially dismissed as a fringe experiment, it evolved into a multi-trillion-dollar market influencing global investment portfolios and central bank policies. Blockchain technology, the backbone of cryptocurrencies, enables transparent, tamper-proof financial transactions without intermediaries.
Moreover, fintech startups have democratized finance by offering mobile-based solutions for lending, insurance, and remittances. This financial inclusion movement has empowered millions in developing economies, bridging gaps left by conventional banking systems.
Cross-border transactions have become more efficient through systems like SWIFT gpi, Ripple, and stablecoins. Traditional remittance systems that once took days now execute transfers in seconds. Digitalization has effectively transformed the speed, accessibility, and inclusiveness of international finance.
4. The Role of Global Institutions and Policies
Despite decentralization, global financial institutions remain central to international finance. The International Monetary Fund (IMF) manages monetary stability and provides support to countries facing balance-of-payment crises. The World Bank continues to fund development projects, while the Bank for International Settlements (BIS) coordinates central bank cooperation.
Recently, new alliances and institutions have emerged—like the Asian Infrastructure Investment Bank (AIIB) and BRICS New Development Bank—offering alternatives to traditional Western-led financial structures. These new institutions reflect the shifting balance of power in global finance, where emerging economies seek greater representation and influence.
International agreements, such as Basel III norms, ensure global financial stability by setting capital adequacy and risk management standards for banks. Similarly, organizations like the Financial Stability Board (FSB) monitor vulnerabilities in the global financial system.
5. Challenges in the New Financial Era
While international finance has advanced dramatically, it faces significant challenges that require urgent attention.
a. Financial Volatility
Rapid capital movement can destabilize economies. Currency fluctuations, speculative trading, and interest rate disparities often trigger volatility in global markets. The U.S. Federal Reserve’s monetary decisions, for instance, can cause ripple effects in emerging markets—strengthening or weakening local currencies and affecting capital inflows.
b. Inequality and Financial Inclusion
Despite globalization, financial benefits are unevenly distributed. Many developing nations still struggle with debt burdens, currency depreciation, and limited access to credit. Digital finance offers solutions, but it also risks excluding those without digital literacy or access to technology.
c. Regulation and Security
The expansion of digital finance introduces cybersecurity risks and regulatory dilemmas. Ensuring financial security in an era of crypto transactions, online trading, and AI-driven investments requires international cooperation. Regulatory frameworks must balance innovation with stability to prevent misuse and fraud.
d. Climate and Sustainability Risks
Climate change presents both economic and financial threats. Extreme weather events disrupt supply chains and increase insurance costs, while the transition to green energy requires massive financial restructuring. Investors and governments must align financial strategies with sustainable growth goals to ensure long-term stability.
6. The Future Landscape of International Finance
Looking ahead, international finance will continue to evolve, driven by innovation, policy reform, and global cooperation. The coming decades will see a fusion of finance and technology unlike anything before.
a. Digital Currency Dominance
Central bank digital currencies (CBDCs) are expected to become mainstream, offering faster and more secure global transactions. China’s digital yuan and India’s digital rupee could challenge the dominance of the U.S. dollar in international settlements.
b. Artificial Intelligence and Predictive Analytics
AI will play a crucial role in financial modeling, risk assessment, and portfolio management. Machine learning algorithms will enable smarter decision-making and real-time monitoring of financial health across institutions and nations.
c. Decentralized and Tokenized Assets
The tokenization of real-world assets—like real estate, art, or commodities—will make global investment more accessible. Decentralized finance will continue to expand, reducing reliance on traditional intermediaries while increasing transparency and efficiency.
d. New Financial Power Centers
Emerging markets are set to become the growth engines of the world economy. Asia, Africa, and Latin America will lead the next phase of financial expansion, supported by digital innovation, youthful populations, and rapid industrialization.
e. Sustainable Global Finance
Sustainability will be the cornerstone of future financial systems. Green investments, renewable infrastructure, and ESG-focused portfolios will shape investor preferences. Financial institutions will prioritize ethical responsibility alongside profitability.
7. Conclusion: The New Age of Global Finance
International finance has truly been transformed—from a slow, bureaucratic system confined by national borders into a dynamic, interconnected web of innovation, opportunity, and complexity. The fusion of digital technology, policy reforms, and global collaboration has redefined how money moves, how businesses operate, and how nations prosper.
However, with great transformation comes great responsibility. As we embrace financial globalization, we must ensure that inclusivity, sustainability, and stability remain at the forefront. The next phase of international finance will not only be measured by profitability or speed—but by its ability to create equitable growth, empower nations, and safeguard the future of our planet.
The transformation of international finance is not just a story of economic evolution—it’s a testament to human adaptability, innovation, and the relentless pursuit of progress. We are living in an era where finance is not just global—it is universal, transcending boundaries, currencies, and even traditional definitions of money itself.

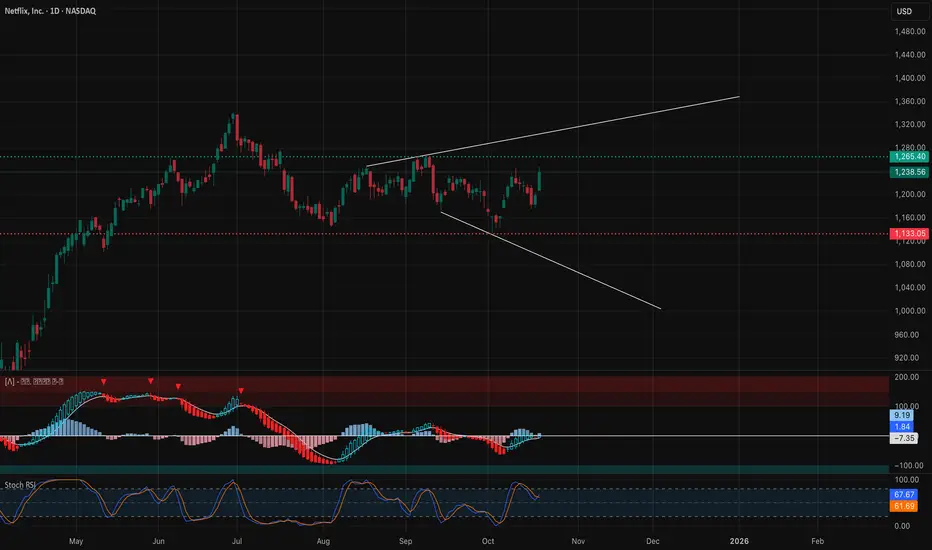
Falling Wedge on NFLX: Set for a Break?Price on NASDAQ:NFLX has been consolidating inside a falling wedge, with each swing showing weaker momentum from sellers. And buyers are slowly stepping back in.
A strong breakout above the upper trendline would confirm bullish strength and signal a potential continuation toward the 1,400.00 level.
Until then, patience is key, waiting for a clear break with volume can help avoid false signals.

NFLX I did some analysis as per harmonic pattern school and with fibo time to check and it seems time to change direction down. also, i add RSI and volume profile to support. this is not recommendation to buy its just sharing information for learning purpose.
Netflix Buy Alert!! The Rising 3 Soldiers Candlestick Patterns I did my first stream about two days ago.I was so sacred and nervous.
"This is a public stream, I better make sure I know what am talking about. I better make sure I show the pips my very best setups for trading."
I tell you I was super depressed because I want to be a good trading leader.
So I have been grinding trying to make sure I perfect my trading strategy and system and skills.
Because I want to show you the best of the best trades I can find.
No more just forex...or stocks I just want to be a great
technical analyst.
So today I did another stream and I had one person watching me trade live.
If you watch me trade analysis live you will really enjoy it 👍😊
It was an awesome stream.This is my business goal to become a streamer.
But am hoping for more viewers tomorrow.
Look at Netflix NASDAQ:NFLX
It's
Above the 50 MA
Above the 20 EMA
Above the 200 EMA
Notice the rising 3 soldiers 🟩🟩🟩Bullish candlestick patterns?
Notice how the last green candle
Gaps up? In green 🟢
The candlestick patterns are your confirmation of entry.
Netflix also has an earnings report coming soon.
This makes it's a perfect candidate for what Tim Sykes calls an earnings winner.. according to his book penny stock guide.
They are rumours that Netflix will partner with Warner Music to make movies based on it's artists such as Bruno Mars.
This report hasn't been confirmed yet.
Do you see how pop culture is linked to the financial markets? Like I told you yesterday?
This is a great stock to trade and ride the 🚀.
Rocket Boost This Content To Learn More.
Disclaimer ⚠️ Trading is risky please learn about risk management and profit taking strategies.Also feel free to use a simulation trading account.

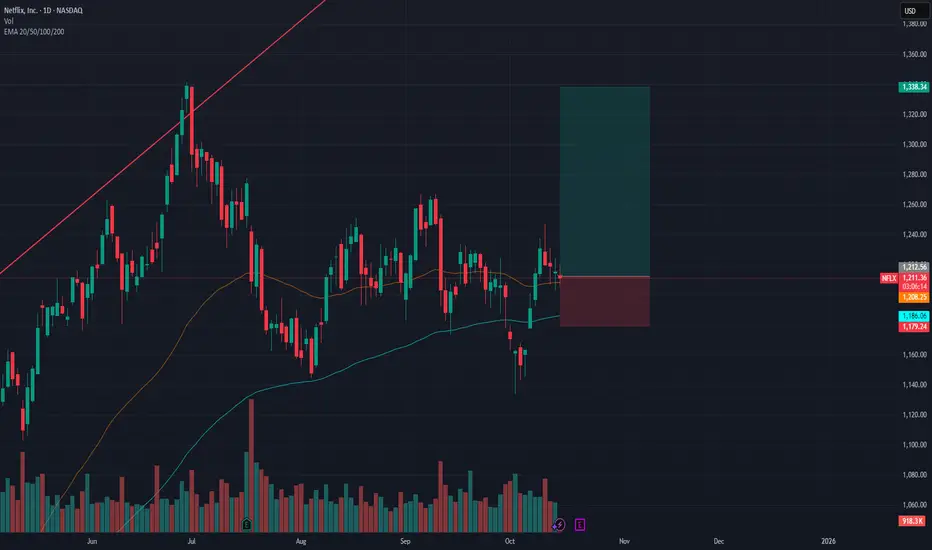
Netflix Is -11% Since June's All-Time High. What Its Chart SaysNetflix NASDAQ:NFLX has fallen more than 10% since hitting an all-time high in June, but the streaming giant is still beating the S&P 500 SP:SPX in the year-to-date, one-year and five-year periods. What does technical and fundamental analysis say is going on?
Let's take a look:
Netflix's Fundamental Analysis
NFLX has shed some 11% as of Tuesday afternoon since peaking at $1,341.15 intraday on June 30, easing especially over the four weeks despite little news.
The only recent negative catalyst came last week, when Citigroup analyst Jason Bazinet (rated at five stars out of a possible five by TipRanks) cut the stock's price target to $1,280 from a previous $1,295. Bazinet also reiterated Netflix's "Neutral" rating, which is considered a "hold-equivalent."
Still, the Citi analyst's $1,280 price target represents about a 7.5% move to the upside from where NFLX was trading at Tuesday afternoon.
Meanwhile, Wall Street expects Netflix to report Q3 results in some two weeks (on or about Oct. 21). The Street is looking for the firm to report $6.95 in adjusted earnings per share on about $11.5 billion of revenue.
If those numbers end up being accurate, that would compare favorably with the year-ago period, with a 28.7% gain from the $5.40 in adjusted EPS that NFLX reported in Q3 2024. Revenues would also have risen 17.3% from the $9.8 billion that Netflix saw a year earlier.
In fact, of the 33 sell-side analysts that I know of that cover Netflix, 27 have increased their earnings estimates since the current quarter began. Just five have cut their forecasts, while one estimate remains unchanged.
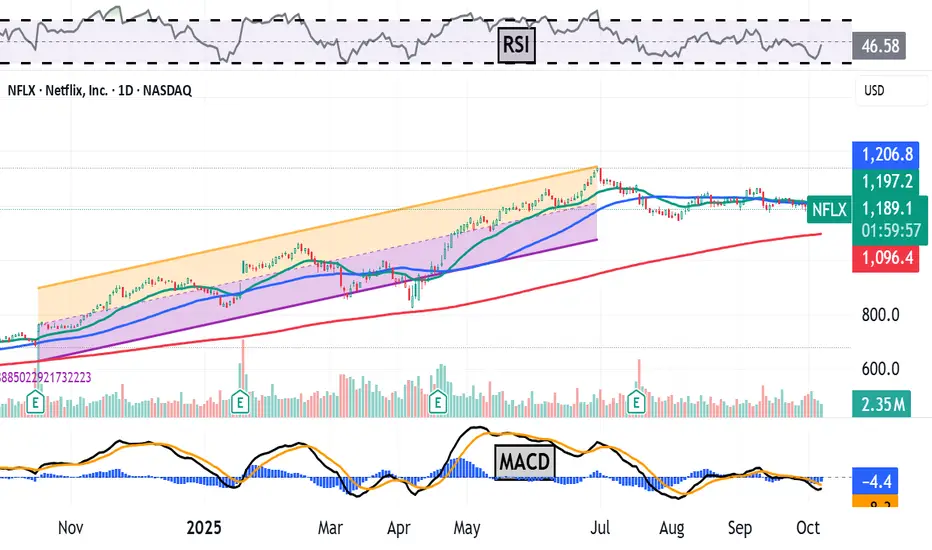
Netflix's Technical Analysis
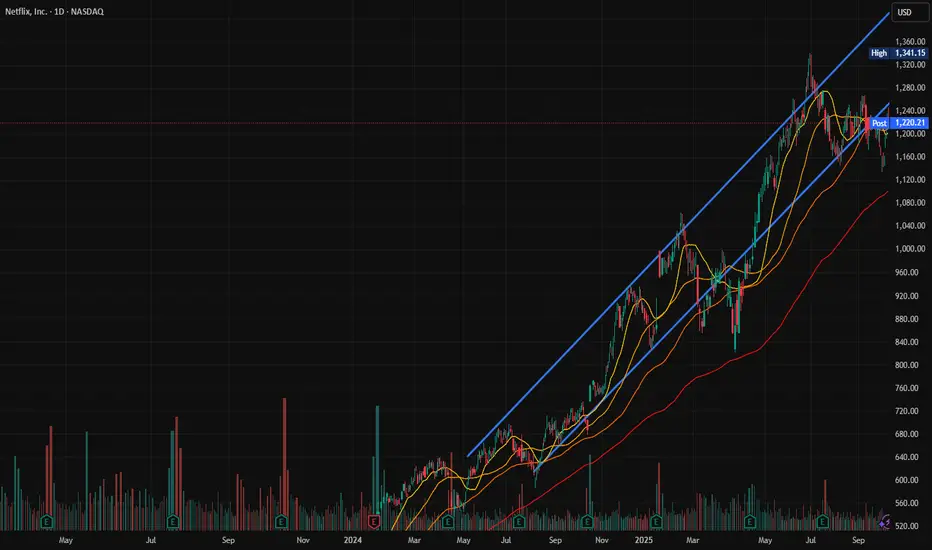
NFLX's one-year chart through Thursday afternoon was telling an interesting story:
Readers will see that the stock benefited from an upward sloping trend that stretched from Autumn 2024 into Summer 2025, as marked with orange and purple fields in the chart above.
This trend ended with NFLX peaking on June 30, with a new trend born the next day. The stock has generally pulled back since July 1 while creating a "falling-wedge" pattern, which is historically a sign of bullish reversal.
Netflix's upsides in the above pattern are the stock's 21-day Exponential Moving Average (or "EMA," marked with a green line) and its 50-day Simple Moving Average (or "SMA," denoted by a blue line). These two lines are running together, so I'll view them as a single pivot.
Now let's zoom in and look at Netflix's chart over just the past eight months:
I've added a "double-bottom" pattern to the above chart above using dotted lines. That's a second pattern of bullish reversal, and it exists inside of Netflix's falling wedge.
Granted, the stock's recent sell-off still has to find support around here. But if it does, NFLX will have just developed two simultaneous bullish patterns.
The double bottom would have a $1,268 pivot, which would be about $60 above the moving averages that we just mentioned. This pivot could produce considerably higher price targets for the stock.
That said, Netflix's other technical indicators above don't agree with such bullishness, or at least don't agree with it just yet.
For example, the stock's Relative Strength Index (the gray line at the chart's top) is relatively weak.
Similarly, Netflix's daily Moving Average Convergence Divergence indicator (or "MACD," marked with gold and black lines and blue bars at the chart's bottom) is close to neutral, as well as closer to bearish than bullish.
The 9-day EMA (the blue bars) is in negative territory, although not far from zero bound. Both the 12-day EMA (the black line) and 26-day EMA (the gold line) are also below zero, with the black line below the gold line. All three of these conditions are typically short- to medium-term bearish signals.
An Options Option
Options traders who want to get NFLX at a "discount" (and get paid to wait for it to potentially go higher) might consider a bull-put spread. This strategy is set up by selling a put while also buying a second put with a lower strike price.
Here's an example:
-- Sell (write) one Oct. 24 NFLX $1,140 put for about $45. This option could expire after Netflix reports earnings.
-- Buy one Oct. 24 NFLX $1,110 put for about $32.
Net Credit: $13
Traders in the above example would pay $1,140 a share for NFLX if forced to buy the stock due to assignment of the short put. However, their net basis would be $1,127 after deducting the net premium collected.
These traders also purchased some downside protection at $1,110 with the second put.
All in, that represents a maximum $30-per-share loss -- the $1,140 strike price on the first put minus the $1,110 strike price on the second.
However, the $13 net premium traders would collect on the entire bull-put spread would reduce the above strategy's maximum theoretical loss to $17 a share at expiration.
(Moomoo Technologies Inc. Markets Commentator Stephen "Sarge" Guilfoyle had no position in NFLX at the time of writing this column.)
This article discusses technical analysis, other approaches, including fundamental analysis, may offer very different views. The examples provided are for illustrative purposes only and are not intended to be reflective of the results you can expect to achieve. Specific security charts used are for illustrative purposes only and are not a recommendation, offer to sell, or a solicitation of an offer to buy any security. Past investment performance does not indicate or guarantee future success. Returns will vary, and all investments carry risks, including loss of principal. This content is also not a research report and is not intended to serve as the basis for any investment decision. The information contained in this article does not purport to be a complete description of the securities, markets, or developments referred to in this material. Moomoo and its affiliates make no representation or warranty as to the article's adequacy, completeness, accuracy or timeliness for any particular purpose of the above content. Furthermore, there is no guarantee that any statements, estimates, price targets, opinions or forecasts provided herein will prove to be correct.
The Analyst Ratings feature comes from TipRanks, an independent third party. The accuracy, completeness, or reliability cannot be guaranteed and should not be relied upon as a primary basis for any investment decision. The target prices are intended for informational purposes only, not recommendations, and are also not guarantees of future results.
Options trading is risky and not appropriate for everyone. Read the Options Disclosure Document ( j.moomoo.com ) before trading. Options are complex and you may quickly lose the entire investment. Supporting docs for any claims will be furnished upon request.
Options trading subject to eligibility requirements. Strategies available will depend on options level approved.
Maximum potential loss and profit for options are calculated based on the single leg or an entire multi-leg trade remaining intact until expiration with no option contracts being exercised or assigned. These figures do not account for a portion of a multi-leg strategy being changed or removed or the trader assuming a short or long position in the underlying stock at or before expiration. Therefore, it is possible to lose more than the theoretical max loss of a strategy.
Moomoo is a financial information and trading app offered by Moomoo Technologies Inc. In the U.S., investment products and services on Moomoo are offered by Moomoo Financial Inc., Member FINRA/SIPC.
TradingView is an independent third party not affiliated with Moomoo Financial Inc., Moomoo Technologies Inc., or its affiliates. Moomoo Financial Inc. and its affiliates do not endorse, represent or warrant the completeness and accuracy of the data and information available on the TradingView platform and are not responsible for any services provided by the third-party platform.
From Distribution to Defense Reading the Market’s MessageHello TradingView family, One thing about price it never forgets. Here’s how smart money distribute defends, tests, and retests the same levels to shape every trend.
So In this post we’ll explore how market structure evolves through repeated interactions with the same zones and why smart money often revisits prior levels to confirm or reject market direction.This phenomenon, often called reconfirmed demand and supply, offers valuable insight into how institutions defend, test, or abandon positions during structural transitions.
Understanding the Sequence--::
The price action we’re looking at highlights how an all-time high can transform into a repeating cycle of supply and demand a classic story of how the market moves in waves of distribution and accumulation.
Let’s walk through the four stages of this evolving structure 👇
1️⃣ Primary Supply Zone (Distribution High)--::
The first rally culminates in a zone where aggressive buying starts to weaken. Volatility increases, candles become larger, and momentum slows. This area represents smart money distributing positions where liquidity is abundant because breakout traders are still buying, and institutions can quietly sell into that strength. This phase often sets the benchmark high that defines the rest of the structure.
2️⃣ Initial Demand Zone (Accumulation Response)--::
After the distribution, price declines until new demand emerges. The downtrend pauses here, forming a clear demand base a level where institutional buyers see value and start building exposure again. This level often becomes the anchor of the upcoming structure, as it’s where the first response from buyers is confirmed by noticeable rejection and strength.
From here, the market begins to rebound.
3️⃣ Secondary Supply Zone (Lower High Confirmation)--::
The rally from the demand base faces resistance before reclaiming the prior high a lower high. This lower-high reaction is a crucial sign that supply remains dominant and that the recent buying was likely re-distribution rather than new strength. This is the zone where smart money offloads again, using the recent bounce to re-sell into liquidity. It also marks a Change of Character (ChoCH) and a potential trend transition.
It’s not a new high it’s the confirmation of a shift.
4️⃣ Reconfirmed Demand Zone (Previous Support Retest)
The final swing shows price declining back into the same demand zone from Stage 2. This zone isn’t new it’s a reconfirmation of prior institutional activity. When the same level holds again, it signifies that the same participants are defending the zone, maintaining the structure and keeping the market in balance. If the level breaks, however, it signals distribution completion the moment when prior demand can’t hold, and the market transitions into a markdown phase.
💡 The Bigger Picture--::
This repeating interaction between supply and demand is a snapshot of market psychology where the big players constantly test the same levels to validate whether the market still agrees with the prior valuation. Each touch, rejection, or breakthrough reveals who’s winning the battle between smart money and retail momentum.
By recognizing this pattern — distribution ➜ accumulation ➜ re-distribution ➜ retest — traders can better understand where the true liquidity zones are and how the market’s behavior constantly revolves around these zones.
This is not just about recognizing patterns it’s about understanding why these patterns form and how they reflect the business of smart money as they manage risk, scale positions, and trap liquidity.
🚀 Takeaway--::
When a previous level reacts again, the zone itself becomes part of the story not just a random reaction, but a confirmation of intent from bigger players. If you can read how the same zones behave on the second touch, you can anticipate where the next impulsive move or breakdown may occur. Mastering this pattern doesn’t just improve your entries it helps you think like the pros.
Regards- Amit.
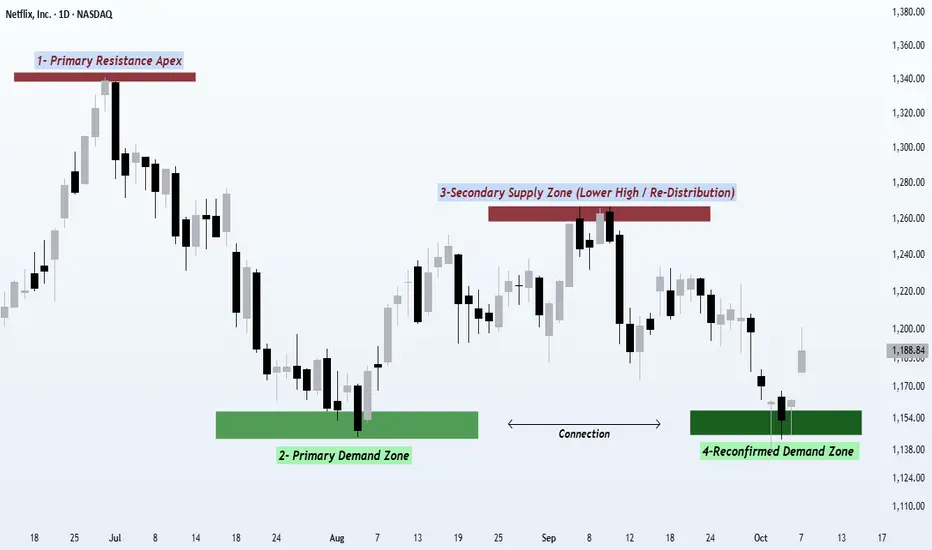
Temporary relief, NFLX DOWNShort NFLX – October 6, 2025 📉
I’m taking a short position on Netflix (NFLX) today. While profits are higher, subscriber growth is slowing, which could put pressure on the stock in the near term, especially given market expectations and competitive streaming pressures.
Target Levels: $950–$925 for initial profit-taking
Catalysts:
Slower subscriber growth despite strong earnings
Competitive streaming landscape increasing long-term risk
Market sentiment turning cautious after recent headlines
Discipline is key—watch price action and volume closely.
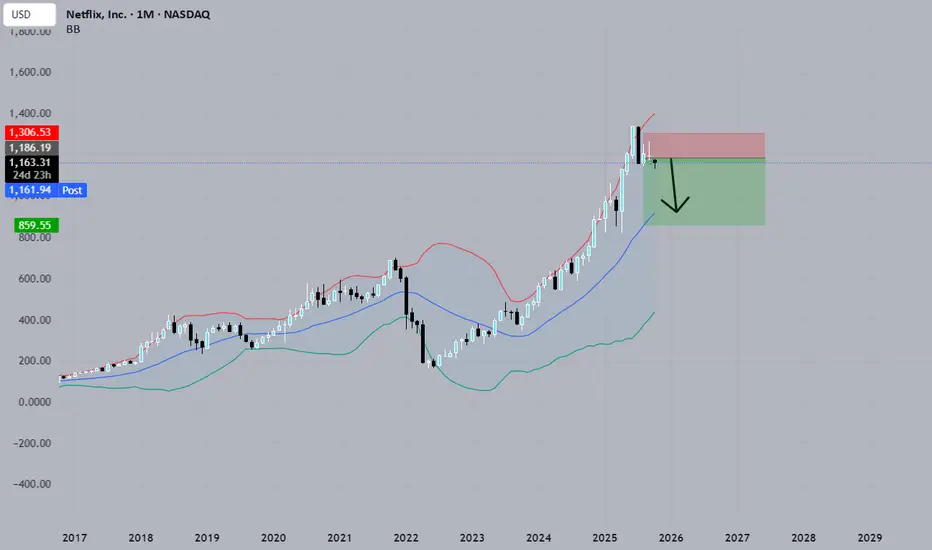
Is Netflix Stock Headed Toward $1,100?Netflix shares are going through a difficult period, as the streaming giant has posted five consecutive losing sessions, with a decline of around 4.5% in recent trading days. For now, the selling bias has become dominant, driven by the viral "Cancel Netflix" campaign circulating on social media, where many users have decided to cancel their subscriptions following a recent controversy involving the company. As long as this negative sentiment fueled by the campaign remains in place, selling pressure is likely to continue playing a key role in the stock’s short-term movements.
Bearish Trend Emerges
Since early July, a series of lower highs has formed, establishing a solid downward trendline. In addition, price oscillations below the 100-period moving average reinforce the outlook for a consistent bearish bias. Unless a significant bullish correction occurs in the near term, selling pressure could continue to dominate, allowing the bearish trend to become more pronounced in the coming sessions.
RSI
The RSI line continues to show downward oscillations below the neutral 50 level, confirming that bearish momentum remains dominant over the past 14 trading sessions. However, the indicator is approaching the oversold zone, marked by the 30 level, and reaching this area could signal a market imbalance, potentially opening a window for short-term corrective rebounds.
MACD
The MACD histogram continues to display negative oscillations below the zero line, indicating that bearish directional strength remains dominant in the short-term moving averages. As the histogram continues to post lower values, selling pressure is expected to remain a key factor in the coming sessions.
Key Levels to Watch:
1,221 – Major Resistance: Corresponds to the area marked by the 100-period simple moving average. Price action breaking above this level could trigger a relevant bullish bias, putting the current downtrend at risk.
1,155 – Nearby Support: Represents the area of the latest price pullbacks. If price breaks below this level, the bearish trend could extend further in the short term, leading to sustained selling pressure. It may also act as a technical barrier capable of producing temporary bullish corrections.
1,097 – Critical Support: Corresponds to the zone marked by the 200-period simple moving average. A sustained break below this level could activate a more aggressive downtrend, likely defining the stock’s movements over the next few weeks.
Written by Julian Pineda, CFA – Market Analyst

NFLX - NetFlix done after the run?🔱 A break of the WL1 could be the technical short signal 🔱
NetFlix had a monster run.
✅ Here’s a grounded fundamental breakdown of risks that could push Netflix downward. None of these are certainties, instead think of them as warning signs, not predictions.
👉 Slowing subscriber growth – growth in mature markets may plateau, and churn could rise if hit shows underperform.
👉 Rising competition and costs – rivals like Disney+ and Amazon force Netflix to spend more on content, squeezing profit margins.
👉 High valuation risk – expectations are lofty, so even a small earnings miss could trigger a sharp sell-off.
✅ Chart analysis
After missing WL2, we’ve got a Hagopian in play, which I’d say still hasn’t been fulfilled. The line was touched by a few ticks, but usually these lines break more decisively.
🔨 If we open and close below WL1, I’m stalking a pullback to it, just to hit the market on the head. If this break really happens, we’ll also have a clean structure for our stop, placed above the last RealSwing high.
🎯 The target is set in stone for me: It's the U-MLH and beyond, down to the Centerline.
Let’s stay focused and keep our cool.
Happy new week!
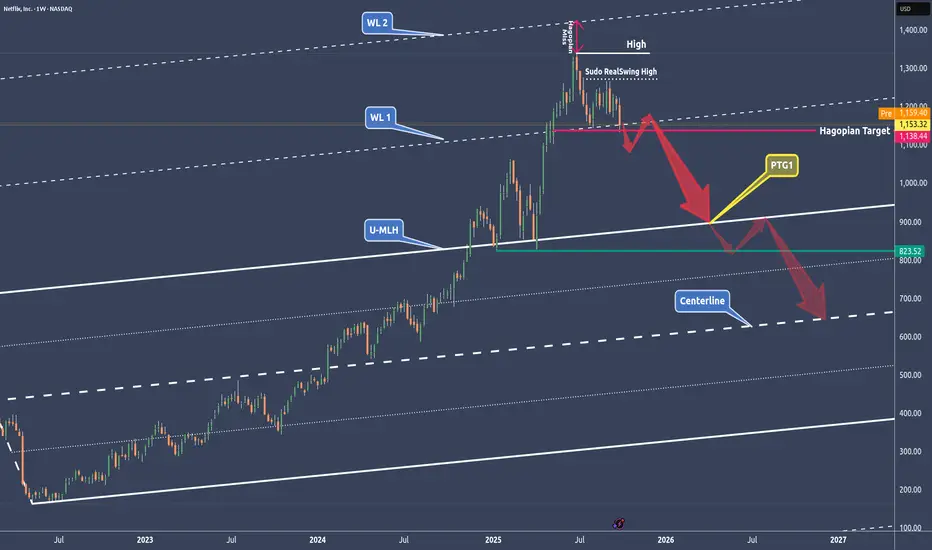
Netflix Investment Outlook Volume 2Top called July 27th, 2021, months prior. No surprises/remorse here! The idea is linked below.
Moving forward, Netflix's price action will be choppy and downward facing. ABC correction in progress; B wave recovery expected soon. Bottom of the historical channel - end game. Fundamentally, increased competition will continue the downtrend in subscriptions. Conclusion: Bear!

NFLX OCT 2025NFLX (4H): Price is hovering near the rising channel support after repeated rejections from the 1,300 supply. The 5.5B sell zone shows clear institutional distribution; bulls need absorption and a reclaim of the EPS line (~1,250) to regain momentum. Green support block at 1,100–1,050 remains the key demand—lose it and the path lower opens.
Target al alza:
1,250 (EPS reclaim) → 1,300–1,325 supply
Target a la baja:
1,100 → 1,050
#NFLX #globaltrade #investment #investing #stockmarket #wealth #realestate #markets #economy #finance #money #forex #trading #price #business #currency #blockchain #crypto #cryptocurrency #airdrop #btc #ethereum #ico #altcoin #cryptonews #Bitcoin #ipo
