$NVDA NVIDIA CORPORATIONExecutive Summary:
NVIDIA Corporation ( NASDAQ:NVDA ) has demonstrated remarkable resilience and sustained growth over multiple market cycles, consistently defending its leadership position despite intense competition within the semiconductor and AI sectors. This analysis outlines a structured, multi-layered support framework derived from Fibonacci retracement theory, which identifies strategic price levels for potential entry. Our primary area of interest converges around the $150.00 psychological level, which aligns with a key Fibonacci midpoint and is anticipated to serve as a robust zone for buyer participation.
Detailed Technical Framework:
1. A History of Defending Its Turf:
NVDA's impressive performance is not merely a function of bullish markets but a testament to its fundamental dominance, particularly in the parallel processing and AI revolutions. The company has repeatedly validated its market strength by navigating competitive threats and leveraging its technological moat, which in turn has created a foundation of strong investor confidence. This fundamental strength is often mirrored in its technical charts, where pullbacks are frequently met with aggressive buying at key value areas.
2. The Fibonacci Support Ladder: A Tiered Defense System
By applying Fibonacci retracement levels to a significant prior upward swing, we can map a hierarchy of potential support zones. These levels do not operate in isolation but represent a cascading series of defenses where buyers have historically stepped in. Our analysis identifies the following critical tiers, from shallowest to deepest:
First Line of Defense (Shallow Pullback):
23.6% Level ($182.53): This level represents a mild, healthy pullback. A hold here would signify exceptionally strong momentum and would likely be a continuation pattern rather than a deep correction.
Secondary Support Zone (Moderate Correction):
38.2% Level ($164.02): A retracement to this level indicates a more pronounced correction but remains within the bounds of a strong uptrend. This is a common level for institutions to begin accumulating positions.
50.0% Level ($149.39): The halfway point of the prior major move is a critical psychological and technical battleground. A successful bounce from this level suggests the overall bull trend remains intact and that market sentiment has found a balance.
Tertiary & Deep Value Zones (Significant Correction):
61.8% Level ($134.58): Known as the "Golden Ratio," this is a deep retracement that often holds in volatile but fundamentally sound assets. A test of this level would indicate a major correction is underway, presenting a higher-risk but potentially high-reward entry point for long-term believers.
78.6% Level ($113.49): This is a deep, rarely-tested retracement level. A move to this zone would signal a severe market downturn or a fundamental reassessment of the stock, but it would also represent a potentially profound long-term value opportunity.
The Ultimate Major Support:
The $100.00 Psychological Level: Beyond the Fibonacci structure, the triple-digit benchmark at $100.00 stands as a monumental psychological and technical support. It represents a round number that often attracts immense buying interest and would be considered a "line in the sand" for the long-term thesis.
3. Primary Strategic Interest & Risk Management:
While the Fibonacci ladder provides multiple potential entry points, our primary area of strategic interest converges around the $150.00 level. This is not a single price point but a zone encompassing the 50% Fibonacci level at $149.39. The rationale for favoring this zone is twofold:
Technical Significance: It is a classic "value area" in a strong trend, offering a favorable balance of potential upside and managed risk.
Psychological Strength: The $150 level is a major round number that is easy for the market to identify and act upon.
A decisive reversal at or near this $150 zone, confirmed by bullish price action (e.g., hammer candlesticks, increased volume on up-days), would provide a strong signal for capital deployment. As with any investment, this thesis requires disciplined risk management; a sustained break below the deeper supports, particularly the $134.58 (61.8%) level, would necessitate a re-evaluation of the near-term bullish outlook.
Trade ideas

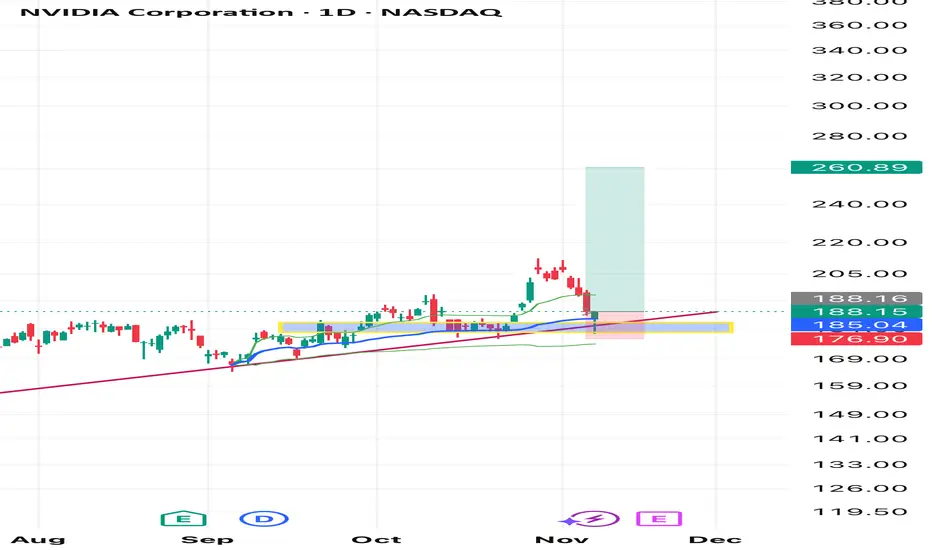
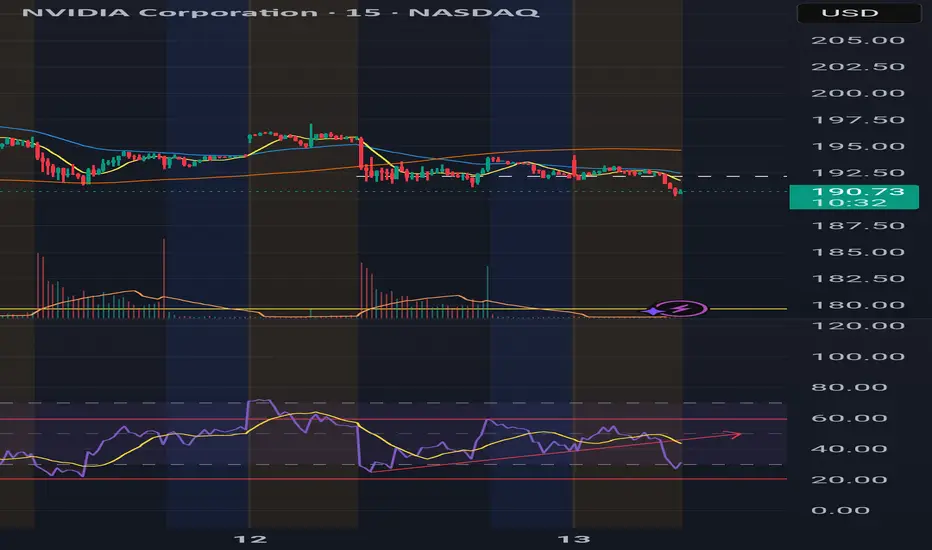
Inflection Point NVDA has a hammerhead candle on a key level and the 50 EMA and the 0.786 Fibonacci level.
Oscillators are flashing oversold. For bullish activity we need a bullish candle with a close above 188.15 and next resistance will be around 191 or 190.70. If price breaks below the 50 EMA(185.19) next key level will be 177.10

NVIDIA Technical Breakdown – November 2025Structure : Price broke out of a descending channel, retested the breakout zone, and is now hovering near a double top resistance.
Fibonacci Confluence: Price is reacting near the 50–61.8% retracement zone, a key decision area for continuation or rejection.
Liquidity Grab: A red-marked zone below shows where stop-losses were likely triggered before reversal — classic accumulation behavior.
Volume & RSI: Volume faded post-breakout, and RSI shows early signs of divergence — momentum is slowing, but not yet reversing.
Scenario Planning:
Bullish: Break and hold above double top zone with volume → target $206–$214.
Bearish: Rejection + RSI divergence → pullback to $183–$178 support.
Watching for confirmation above the double top zone. Liquidity grab + fib confluence suggest potential continuation, but momentum needs to align.
Follow @GoldenZoneFX for more content and valuable insights.

Nvda LongLong NVDA because it finished testing weekly trendline, and Vwap. The reaction to the trendline and the vwap was a hammer daily candle which shows that those will be respected.
If any other instrument you guys want me to analyse, just let me know me know!!
Good luck everyone !!
Re-Entering NVD - Eyeing Mid-November ReversalReopened long on NVDA with Jan 16 ’26 $180 Call at 16.50. Expecting rebound from recent 13% drop and continuation higher through Q4 as momentum returns.
Nvidia: Acceleration Toward New Highs Nvidia gained strong upward momentum shortly after our last update, surging past the $196.45 mark, which had previously served as resistance. As a result, our prior short-term alternative scenario was triggered, and we have now adjusted the chart accordingly (with minor modifications). We now view the green wave as complete and believe that the joint top of green wave and beige wave III, as well as the low of wave IV, have already been established. The Target Zone we had initially set for the wave- low has therefore been removed. In our updated short-term alternative scenario, we still see a 30% probability of a new low for beige wave alt.IV below the $176.21 support level. In this case, however, price would likely rebound above the lower $145.50 level.

Global Market Participants1. Introduction to Global Market Participants
Global market participants are entities that take part in international financial transactions. These include individual investors, institutional investors, corporations, governments, central banks, and intermediaries. Their activities impact the stability, efficiency, and development of the financial markets. The diversity among these participants ensures liquidity, facilitates price discovery, and contributes to economic growth by channeling funds from savers to borrowers worldwide.
2. Individual Investors
Individual investors, often called retail investors, are private persons who invest their own money in various financial assets such as stocks, bonds, mutual funds, or cryptocurrencies. Their primary goals are to grow wealth, earn income, and achieve financial security.
Key Characteristics:
Smaller investment amounts compared to institutions.
Focus on long-term capital appreciation or short-term trading profits.
Tend to rely on brokers, financial advisors, and digital trading platforms.
Role in the Market:
Retail investors enhance market liquidity and promote diversity in trading behaviors. With the rise of online trading platforms and fintech innovation, the participation of individuals in global markets has increased significantly. Social media and global connectivity now allow retail investors to influence markets, as seen during events like the 2021 “meme stock” phenomenon.
3. Institutional Investors
Institutional investors are large entities that pool money from clients or members and invest in financial markets to achieve specific objectives. They include pension funds, insurance companies, mutual funds, hedge funds, and sovereign wealth funds.
a. Pension Funds:
Pension funds invest the savings of employees to ensure financial security after retirement. They typically favor long-term, stable investments like bonds and blue-chip stocks.
b. Insurance Companies:
Insurance firms invest premiums collected from policyholders in relatively safe and income-generating assets to meet future claims.
c. Mutual Funds:
These funds pool money from numerous investors to invest in diversified portfolios of stocks, bonds, or other assets. They enable individuals to access professional management and diversification benefits.
d. Hedge Funds:
Hedge funds target high returns through aggressive strategies, including leverage, derivatives trading, and short-selling. They often cater to high-net-worth individuals and institutions.
e. Sovereign Wealth Funds (SWFs):
These are government-owned investment funds that manage national reserves, often derived from oil revenues or trade surpluses. Examples include Norway’s Government Pension Fund Global and Singapore’s GIC.
Impact on Global Markets:
Institutional investors dominate global capital flows and can significantly influence market trends. Their large-scale investments affect prices, volatility, and even government bond yields.
4. Corporations and Multinational Companies (MNCs)
Corporations participate in global financial markets for financing, investment, and risk management purposes.
Key Activities:
Raising Capital: Through issuing stocks or bonds to finance expansion.
Foreign Exchange Management: Engaging in currency markets to hedge exchange rate risks.
Mergers and Acquisitions: Companies use global capital markets to fund cross-border deals.
Example:
A U.S.-based company operating in Europe may use derivatives to hedge against euro-dollar exchange rate fluctuations. Multinational corporations also issue global or Eurobonds to attract international investors.
5. Governments
Governments are major players in global markets, primarily as issuers of sovereign debt and regulators of financial systems.
Roles:
Issuers of Government Bonds: To finance public spending and infrastructure projects.
Market Regulators: Setting and enforcing financial regulations to maintain transparency, stability, and investor confidence.
Participants in the Currency Market: Governments manage foreign exchange reserves to stabilize national currencies and support trade balances.
Example:
The U.S. Treasury issues bonds that serve as global benchmarks for risk-free assets, while developing nations issue sovereign debt to attract foreign capital.
6. Central Banks
Central banks, such as the U.S. Federal Reserve, the European Central Bank (ECB), and the Reserve Bank of India (RBI), are among the most influential market participants.
Key Functions:
Monetary Policy: Controlling money supply and interest rates to manage inflation and stimulate growth.
Foreign Exchange Operations: Buying and selling currencies to stabilize exchange rates.
Liquidity Provider: Acting as lenders of last resort to the banking system.
Central banks also influence global markets through quantitative easing, where they purchase government bonds to inject liquidity into the economy. Their decisions can trigger global reactions, affecting stock, bond, and currency markets worldwide.
7. Financial Intermediaries
Financial intermediaries connect savers with borrowers, facilitating the flow of funds across the economy. These include commercial banks, investment banks, brokers, and exchanges.
a. Commercial Banks:
Provide loans, accept deposits, and offer payment systems. They are key in credit creation and financial stability.
b. Investment Banks:
Help corporations and governments raise capital through underwriting securities and managing mergers and acquisitions.
c. Brokers and Dealers:
Act as agents for investors, executing trades and providing liquidity in financial markets.
d. Exchanges:
Stock and commodity exchanges provide regulated platforms for buying and selling financial instruments. Examples include the New York Stock Exchange (NYSE), London Stock Exchange (LSE), and the Bombay Stock Exchange (BSE).
8. Speculators and Traders
Speculators take on financial risk in the hope of profiting from price movements. While often viewed as risk-takers, they serve an important function by adding liquidity and aiding price discovery.
Types of Traders:
Day Traders: Engage in short-term trades for quick profits.
Arbitrageurs: Exploit price differences between markets or instruments.
Algorithmic Traders: Use computer programs to execute high-frequency trades.
Their activities ensure continuous market operation, even during volatile periods.
9. Credit Rating Agencies
Agencies such as Moody’s, Standard & Poor’s (S&P), and Fitch Ratings assess the creditworthiness of companies, governments, and financial instruments. Their ratings influence investor confidence, bond yields, and borrowing costs.
Role in Global Markets:
Facilitate informed investment decisions.
Help maintain transparency and discipline among borrowers.
Influence capital allocation by institutional investors.
However, rating agencies have faced criticism for conflicts of interest and their role in past financial crises, such as the 2008 global meltdown.
10. International Financial Institutions
Organizations such as the International Monetary Fund (IMF) and the World Bank play a stabilizing role in the global market.
The IMF:
Provides financial assistance to countries facing balance-of-payments crises and promotes exchange rate stability.
The World Bank:
Funds infrastructure and development projects in emerging economies to promote long-term economic growth.
Their involvement ensures global financial stability and supports developing nations in integrating into global markets.
11. Hedge Funds and Private Equity Firms
Hedge funds and private equity firms are specialized investment entities managing large pools of capital with flexible strategies.
Hedge Funds: Focus on generating high returns through trading and leverage.
Private Equity Firms: Invest directly in private companies or buy out public firms to restructure them.
They are crucial in improving corporate efficiency, promoting innovation, and influencing global capital allocation.
12. Conclusion
Global market participants collectively form the backbone of the world’s financial system. From individual investors to powerful institutions like central banks and sovereign wealth funds, each plays a unique role in shaping market behavior and economic outcomes. Their interactions drive capital flows, influence asset prices, and impact global growth and stability.
Understanding these participants helps explain how financial markets function and respond to economic, political, and technological changes. In an increasingly interconnected world, the balance between these entities determines the resilience and sustainability of the global financial ecosystem.
In essence, the global market is a dynamic arena where diverse participants—each with distinct motives and influences—interact to create a continuously evolving landscape of opportunity, competition, and innovation.

NVDA Pullback or Trend Break? (Nov 10–14)Full Multi-Timeframe Outlook
NVDA just had one of its sharpest weekly pullbacks in months, and this week is all about figuring out whether this drop is simply a reset inside the bigger bullish trend or the start of a deeper correction. I’ll walk through each timeframe so traders can understand the structure clearly.
1. Weekly Timeframe (1W)
Macro Structure
NVDA finally tapped the top of the long-term rising wedge and rejected aggressively. Even with the deep weekly red candle, the bigger structure hasn’t broken yet — NVDA is still sitting above the main weekly trendline that carried the entire 2023–2025 bull run.
Weekly demand starts around 153–160. Price hasn’t reached that level yet, but the rejection candle shows sellers finally stepping in with size.
Weekly MACD is rolling over for the first time since mid-summer. Stoch RSI is turning down from overbought. Both suggest momentum is cooling on the larger timeframe.
Weekly Trade View
Watch how NVDA reacts around the trendline near 184–188. As long as NVDA stays above 153–160, the larger trend remains bullish, but a break below 184 adds pressure.
Weekly GEX Perspective
Below 180, negative GEX expands heavily, which tends to increase volatility on the downside.
Above 200, positive GEX slows the upside.
This places NVDA in the middle of a high-energy zone — whichever way it breaks next will likely extend for days.
2. Daily Timeframe (1D)
Daily Trend and Structure
The daily chart is where the weakness is more visible. We already printed a downside CHoCH, confirming a short-term trend shift. NVDA has also broken its rising channel from September, which means sellers took control temporarily.
Key daily support sits at 176–184. That’s a demand cluster plus the midpoint of the previous impulse. The daily candle you posted shows NVDA sitting right on this zone.
Daily MACD crossed bearish and continues to widen. Stoch RSI is oversold but hasn’t curled yet — usually a sign that a bounce needs more time to develop.
Daily Trade View
Hold 184 → NVDA can bounce back toward 195 then 202.
Break 176 → opens a deeper retracement toward 164 and even 153.
Daily GEX View
There is a major put wall around 178–180.
This level often acts like a gravitational pull, especially in pullbacks.
The next put concentration is near 164.
Unless NVDA reclaims 190–195 quickly, the daily structure still favors a retest of these lower zones.
3. 1-Hour Timeframe (1H)
Short-Term Structure
You can see NVDA has been sliding down the descending intraday channel for days. The most recent BOS is bearish, but the latest CHoCH shows buyers finally trying to step in around 178.
Price is now approaching the 190 resistance — this is the intraday pivot for the week.
1H MACD is curling upward, showing the first momentum shift since early November. Stoch RSI is rising fast, confirming short-term buyers entering.
1H Trade View
Above 190 → opens room toward 195 then 202.
Reject 190 → NVDA likely rolls back toward 184 then 178.
The 190 break is the whole game for intraday momentum.
4. 15-Minute Timeframe (15M)
Intraday View
The 15M shows the cleanest structure:
A strong BOS just formed, and NVDA broke the intraday trendline. This is the first real bullish sign since the selloff started.
However, the CHoCH that printed after the BOS is sitting right underneath the 188–190 ceiling. That means the sellers still sit overhead waiting.
MACD on 15M is trending strongly upward — momentum is on the bulls’ side right now.
15M Trade View
Break and hold above 188–190 → intraday long toward 195.
Reject 188–190 → expect a fade back toward 184.
This level aligns across all lower timeframes, which makes it extremely important for Monday and Tuesday.
5. GEX Map & Options Strategy
GEX Interpretation for NVDA (This Week)
The GEX chart shows:
Positive GEX at 195–205
Negative GEX at 178–180
A major put wall at 178.91
A major call wall at 202–205
What this means:
Under 180 → volatility expands downward as dealers hedge.
Over 195 → upside will feel slower and grindy, not explosive.
202–205 → heavy call wall likely to act as a ceiling unless NVDA has strong momentum.
Options Strategy
If NVDA rejects 188–190:
Short-dated puts targeting 180 or 178 make sense.
If NVDA reclaims 190 and holds:
Short-dated calls targeting 195 or 202 are the better play.
Avoid chasing anything above 205 — that’s deep inside positive GEX and tends to stall.
My Thought
NVDA is in a very interesting spot going into the week. Higher timeframes are still bullish, but the daily and intraday charts clearly show the momentum shift to the downside. Everything comes down to how price reacts between 188 and 190.
Rejecting that zone keeps the pullback alive toward 184–178.
Breaking above that zone starts the recovery toward 195–202.
This is a week where levels matter more than bias. The reaction at 188–190 will decide which side controls NVDA next.
Disclaimer
This analysis is for educational purposes only and not financial advice. Always trade your own plan and manage your risk. If you want a breakdown on another ticker, just drop it in the comments.

NASDAQ:NVDA — pre-earnings Swing Trade Breakdown💰 NVDA — Swing Trade Breakdown
Ticker: NASDAQ:NVDA
Duration: Short-term swing (pre-earnings setup, ~12 days before report)
🏢 Company Snapshot
NVIDIA is the global leader in GPUs and AI computing hardware. The stock remains a momentum anchor in the semiconductor space, benefiting from continued AI data-center demand and strong cash flow expansion. Current setup follows a steep pullback — RSI(2) at 6.32, signaling short-term exhaustion and potential bounce zone.
📊 Fundamentals
P/E: ~56× (vs ~35× industry average) → Premium valuation justified by hyper-growth.
P/B: ~48× → Reflects asset-light, high-margin structure.
Debt/Equity: ~0.09 → Very low leverage, excellent balance sheet.
ROE: > 100 % → Exceptional profitability.
Dividend Yield: 0.02 % → Pure growth focus.
Free Cash Flow: ~$72 B TTM → Strong liquidity and reinvestment potential.
Cash on Hand: High, current ratio ~4.2× → Excellent short-term flexibility.
Summary: Outstanding profitability and balance sheet strength, but valuation remains stretched.
📈 Trends & Catalysts
Revenue Growth: +60 % YoY (AI infrastructure and data-center demand).
EPS Trend: Rising sharply with margin expansion.
Cash Flow Trend: Explosive FCF growth — from ~$4 B (2023) to ~$60 B (2025).
Balance Sheet: Minimal debt, huge cash reserves.
Catalysts: Upcoming earnings (~12 days), AI build-out momentum, tech rotation inflows.
Risks: Elevated valuation, potential multiple compression post-earnings, high beta (~2.1).
🪙 Industry Overview
Semiconductors remain one of the strongest global sectors.
Weekly: Up ~2-4 % — rotation into large-cap AI plays.
Monthly: Up ~8-12 % — capital inflows favoring high-growth tech.
12-Month: Strong outperformer vs. S&P; macro driven by AI demand cycle.
📐 Technicals
Price: ~$188.08
50-SMA: ~175 – 180 → currently testing zone.
200-SMA: ~145 – 150 → long-term uptrend intact.
RSI(2): 6.32 → extremely oversold, near reversal zone.
Pattern: Short-term consolidation after parabolic run; possible breakout retest.
Support: $165 – 175
Resistance: $205 – 215
Volume: Watch for accumulation spikes near support for confirmation.
🎯 Trade Plan
Entry Zone: $180 (buy near support on strength confirmation).
Stop Loss: $175 (below key support / invalidation).
Target: $190 (first swing resistance).
Risk/Reward: ~2:1 if entered near $180.
Alternate Setup: Continuation breakout > $215 for momentum traders.
🧠 My Take
NVDA remains the king of AI momentum. Fundamentally bulletproof, technically oversold, and sitting on key support ahead of earnings. Ideal setup for a 2:1 swing bounce — but exit before the earnings date to avoid volatility risk. Watching for a reversal candle or volume confirmation near the 50-SMA zone.

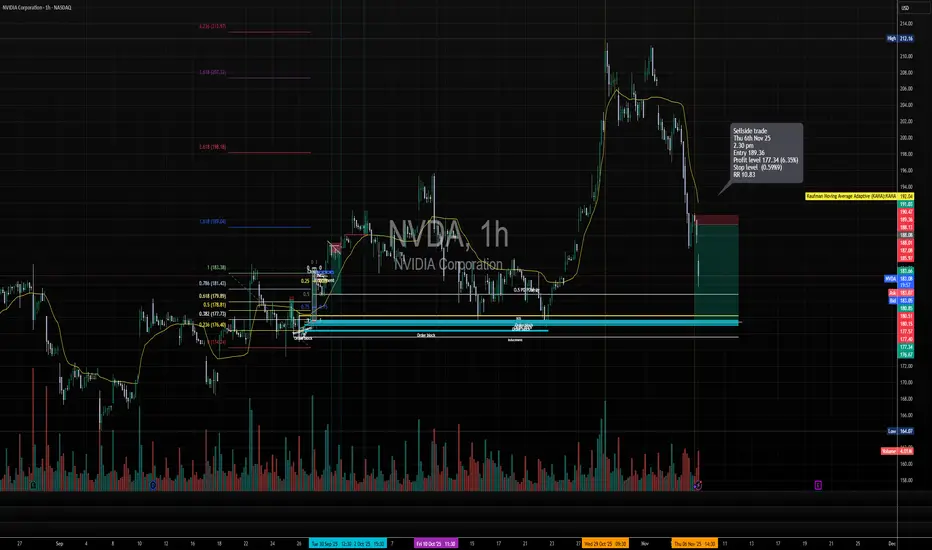
Short trade 📘 Trade Summary
Pair: NVDA (NASDAQ)
Direction: Sell-side Trade
Date: Thu 6 Nov 25
Time: 2:30 pm
Entry: 189.36
Profit Level: 177.34 (+6.35%)
Stop Level: 189.99 (–0.59%)
Risk-Reward (RR): 10.83
🧩 Technical Context
Price Structure: Market rejected near the previous swing high (~$197–$200 region) after failing to sustain above the 1.618 extension level.
Fibonacci Context: Retracement zones from 0.382 – 0.786 aligned with prior accumulation zones, showing resistance at 0.618 (≈ 179.89) and 0.786 (≈ 181.43).
Order Block Alignment: Two visible order blocks (highlighted in blue) show prior demand zones — price is expected to retrace into these for potential take-profit liquidity.
Volume Spike: Noticeable volume at the rejection candle near $190–$191 indicates institutional sell orders stepping in.
EMA Context: Price fell below the Kaufman Adaptive Moving Average (KAMA), confirming a short-term shift to bearish momentum.
🧠 Trade Narrative
This short setup capitalises on:
A failed breakout at the prior liquidity high (~$197),
Break of structure (BOS) confirming downside shift, and
Entry at the retest of a supply zone near $189.
Targeting liquidity sweep of prior accumulation zone around $177, where confluence with the lower order block exists.
Nvidia Corp.($NVDA) Drops as U.S. Blocks AI Chip Sales to China Nvidia Corp. (Nasdaq: NASDAQ:NVDA ) shares dropped 4.18% to $180.22 on Friday after reports that Washington will block the company’s sales of scaled-down AI chips to China. The decision marks another escalation in U.S. restrictions on advanced semiconductor exports.
According to The Information, the White House informed several federal agencies that Nvidia will not be allowed to sell its new B30A AI chip to Chinese firms. Nvidia had already provided samples to some customers in China before the ban was confirmed.
The B30A was designed to meet U.S. export thresholds while retaining enough computing power for AI training when used in large clusters. However, U.S. officials reportedly concluded that the chip still poses national security risks.
Compounding Nvidia’s challenges, Beijing has issued new guidelines restricting foreign chips in state-backed data centers. Reuters reported that China will require all new projects using government funding to rely solely on domestically developed processors. Data centers less than 30% complete must remove foreign chips, while advanced projects will face case-by-case reviews.
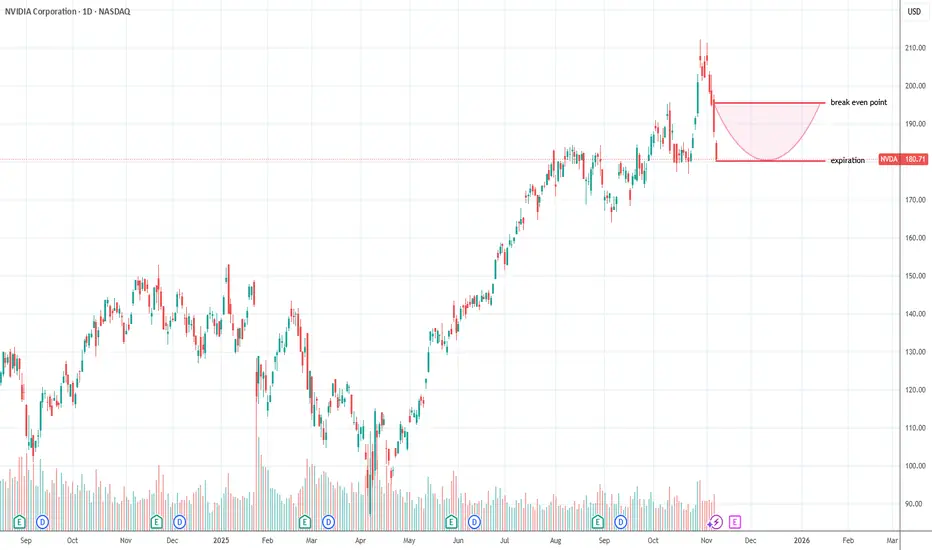
Technical View
The NVDA chart shows a recent rejection from the $212 level, with price sliding toward $180. A further decline toward $160 support is possible before a rebound, as indicated by the yellow curve. Long-term structure remains bullish, but near-term weakness persists under regulatory pressure
$NVDA Cloud Bounce NASDAQ:NVDA dropped 5% intraday and closed green. Crazy reversal... held the cloud very well, could be the start of a nice bounce.

NVDA Earnings Play: Bullish Calls Despite Katy Neutral BiasNVDA QuantSignals V3 — Earnings Play (2025-11-19)
Direction: BUY CALLS
Confidence: 68% (Medium Conviction)
Risk Level: Moderate
🎯 Trade Setup
Strike: $180
Expiry: 2025-11-21
Entry Range: $9.30 – $9.40
Target 1: $18.60
Target 2: $27.90
Stop Loss: $4.65
Position Size: 3%
📈 Key Metrics
Current Price: $185.06
Implied Move: $13.15 (7.1%)
PCR: 0.46 (Bullish)
24h Move: +0.48%
RSI: 31.3
Support: $180.52
🧠 Analysis Snapshot
Katy AI Prediction: Neutral → slight bearish drift toward $183.56–184.20
Technical Indicators: Mixed (MACD bullish, ROC bearish)
News Sentiment: Strongly Bullish
$100B AI infra deal w/ Brookfield
Presidential endorsement
AI chip testing breakthroughs
Options Flow: Heavy call activity; institutional size at higher strikes
Volatility: VIX 23.25 — elevated
⚡ Why This Trade Works
Bullish news + strong call flow overpowers Katy’s neutral/slightly bearish modeling
Earnings volatility + catalysts create a favorable upside skew
0.63 delta strike gives balanced risk/reward
⚠️ Notes
Moderate confidence → consider smaller sizing
Expect heavy volatility due to 7.1% implied earnings move
Low pre-earnings volume → scale entries if possible

Exchange Rate Strategies in the Global Market1. Understanding Exchange Rates and Their Importance
An exchange rate is simply the price of one currency in terms of another, such as 1 USD = 83 INR. But behind this apparent simplicity lies a complex system influenced by macroeconomic factors like inflation, interest rates, political stability, and capital flows.
Exchange rate fluctuations can determine the profit margins of exporters, the cost of imports, and the returns on foreign investments. In the global market, even a small movement—say, a 0.2% shift—can translate into millions of dollars gained or lost.
For this reason, market participants use a variety of strategies to manage risk, hedge currency exposure, and speculate on potential price movements.
2. Major Exchange Rate Strategies in the Global Market
Exchange rate strategies can be broadly classified into three categories:
Hedging Strategies – Used to protect against adverse currency movements.
Speculative Strategies – Aim to profit from expected changes in currency values.
Arbitrage and Carry Trade Strategies – Designed to exploit interest rate differentials or mispricing across markets.
Let’s explore each in detail.
3. Hedging Strategies: Protecting Against Currency Risk
Hedging is the most widely used approach in international business, especially for exporters, importers, and global investors. The goal is not to make a profit, but to avoid loss caused by unpredictable exchange rate movements.
a) Forward Contracts
A forward contract locks in a specific exchange rate for future delivery.
For example, an Indian exporter expecting $1 million payment in 3 months may fear the rupee strengthening, which would reduce rupee earnings. The exporter can fix today’s rate using a forward contract.
Benefits:
Offers certainty
Customizable to the amount and date
Drawbacks:
No benefit if the market moves favorably
Requires contractual commitment
b) Currency Futures
Currency futures serve a similar purpose as forwards but are traded on exchanges. They are standardized and offer more liquidity.
Who uses them:
Traders
Fund managers
Institutions needing transparency and daily settlement
c) Options (Currency Options)
Options provide the right—but not the obligation—to buy or sell currency at a set price.
Example: A call option on USD/INR allows buying USD at a set rate if the market rises.
Advantages:
Asymmetric protection
Gain on favorable moves, protection on unfavorable moves
Disadvantage:
Premium cost
d) Natural Hedging
Instead of using financial instruments, companies adjust their operations:
Borrow in the same currency as earnings
Match import payments with export receipts
Keep foreign currency balances
This reduces risk without needing derivatives.
4. Speculative Strategies: Profiting from Currency Movements
Speculation involves taking calculated positions in currencies, expecting changes in exchange rates. Professional traders, hedge funds, and banks commonly practice these strategies.
a) Trend Following (Momentum Trading)
Currencies often move in trends due to macroeconomic forces.
Traders use technical indicators like moving averages, RSI, and Fibonacci levels to identify upward or downward momentum.
b) Range Trading
Some currency pairs stay within predictable ranges for long periods.
Traders buy when the price touches the lower boundary (support) and sell when it hits the upper boundary (resistance).
c) Breakout Trading
Breakouts occur when currency pairs move beyond established levels due to major news, economic data, or central bank decisions.
Breakout traders aim to enter early and ride the fast movement.
d) Position Trading (Macro Trading)
These traders hold positions for months based on macroeconomic expectations:
Central bank policy divergence
Economic growth differences
Inflation trends
Political stability
Famous macro traders like George Soros used long-term fundamental strategies.
5. Arbitrage and Carry Trade Strategies
These are advanced strategies focused on inefficiencies or interest rate gaps.
a) Triangular Arbitrage
This exploits mispricing among three currencies.
For example, if EUR/USD, USD/JPY, and EUR/JPY exchange rates do not align perfectly, traders can buy one currency and sell another simultaneously for risk-free profit.
b) Covered Interest Arbitrage
This involves using forwards to lock interest rate differentials between two countries.
If a country has higher interest rates, investors borrow in a low-rate currency and invest in a high-rate one, hedging with a forward contract.
c) Uncovered Interest Arbitrage (Carry Trade)
The carry trade is one of the most popular global strategies.
How it works:
Borrow in a low-interest-rate currency (like JPY).
Invest in a high-interest-rate currency (like INR).
Earn the interest rate difference.
Risk:
If the high-rate currency depreciates sharply, losses can exceed gains.
Carry trade often collapses during global risk-off events.
6. Exchange Rate Strategies Used by Governments & Central Banks
Governments also actively manage exchange rates to stabilize the economy.
a) Currency Pegging
A country fixes its currency to another stable currency (USD, EUR, etc.).
Example: The UAE dirham is pegged to the USD.
b) Managed Float
Most currencies (including USD/INR) follow a managed float, where the central bank intervenes occasionally to prevent extreme volatility.
c) Forex Reserves Management
Countries hold large reserves to defend their currency during speculative attacks or to stabilize the exchange rate.
d) Capital Controls
Some nations restrict money movement to manage exchange rate stability.
Example: Limits on remittances or FDI flows.
7. Factors Influencing Exchange Rate Strategy Effectiveness
Several global factors shape the success of any exchange rate strategy:
Interest rate differentials
Trade balances
Inflation levels
Political and geopolitical risks
Commodity price changes (oil, gold, etc.)
Capital flows and investor sentiment
Central bank policy divergence
Understanding these factors enhances strategy accuracy.
8. Choosing the Right Exchange Rate Strategy
The optimal strategy depends on the participant’s profile:
For businesses:
Use hedging (forwards, options, natural hedges).
For traders:
Use speculative strategies (trend, breakout, arbitrage).
For investors:
Use carry trades, macro strategies, and diversified currency portfolios.
For governments:
Use policy tools (interventions, reserves, peg systems).
Conclusion
In the global market, exchange rate strategies form the backbone of international trade, investment security, and financial stability. With rising globalization, volatile currency movements are inevitable, and understanding the right mix of hedging, speculation, and arbitrage strategies can provide a strong edge. Whether one is an exporter managing risk, a trader seeking opportunity, or a policymaker stabilizing the economy, mastering exchange rate strategies enables smarter decisions and stronger resilience in today’s dynamic global market.
NVDA chart AnalysisI am sharing my NVDA chart analysis with other traders on how it can react or what potential prices it can go

Market Noise That Traps Retail Traders1. What Is News Trading?
News trading is a strategy where traders take positions based on the expected market reaction to economic events or announcements. These events can be:
Economic data (GDP, inflation, interest rates, unemployment)
Central bank decisions (RBI, Fed, ECB meetings)
Corporate earnings and guidance
Mergers, acquisitions, buybacks
Global geopolitical developments
Commodity reports (OPEC meetings, inventory data)
Government policies and regulations
News changes market expectations, and markets move on expectations — that’s the core idea behind news trading.
2. What Is “Noise” and Why Is It Dangerous?
Noise is any information that creates confusion without adding value.
Examples of noise:
Clickbait headlines (“Market to crash 20%?”)
Social media hype (Twitter/X rumors)
WhatsApp university “insider news”
Delayed news after the market has already reacted
TV channel opinions that change every minute
Over-analysis without data
Emotional panic or euphoria from retail traders
Noise causes wrong decisions, late entries, and over-trading.
Professional traders avoid it by sticking to verified, timely, and market-moving information.
3. Why Most Retail Traders Fail in News Trading
Retail traders often:
React after the move has already happened
Trade based on emotions, not data
Follow misleading social media posts
Don’t understand whether news is actually important
Lack a prepared plan before events
Cannot interpret the deviation between expected and actual data
Professional traders, on the other hand, plan days ahead and execute in seconds.
4. How to Trade News Without Noise – The Clean Process
The core idea is: Be prepared before the news, respond instantly to real numbers, avoid emotional reactions.
Here’s the step-by-step process:
Step 1: Know Which News Actually Matters
Not all news moves markets. Learn to classify news into:
High Impact News
RBI policy meetings
US Federal Reserve meetings
Inflation data (CPI, WPI)
GDP growth numbers
Employment data
Major earnings announcements
Geopolitical tensions (war, sanctions, oil shocks)
Medium Impact News
Industrial production
Services PMI, Manufacturing PMI
Consumer sentiment
Smaller corporate updates
Low Impact News
Minister speeches
General opinions
Minor announcements
Over-analyzed TV commentary
Rule: Focus only on news with real economic consequences.
Step 2: Prepare a News Calendar
Before the week starts, create a watchlist of events:
Date
Time
Expected numbers
Previous numbers
Expected market reaction
Tools to use:
Economic calendars
Earnings calendars
OPEC & inventory calendars
RBI/Fed meeting schedules
Preparation removes confusion and reduces noise.
Step 3: Understand “Expectations vs Reality”
Markets don’t react to news itself; they react to the difference between expected and actual results.
Example:
If inflation is expected at 5% but comes at 5.4%, markets fall.
If it comes at 4.7%, markets rise.
This deviation is called “surprise factor.”
Professional traders instantly measure this deviation and take positions.
Step 4: Use the 10-Second Rule During News
During major announcements:
Avoid trading in the first 10 seconds
Let the initial volatility settle
Watch the direction that forms after the first burst
This protects you from:
Whipsaws
False breakouts
High spreads
Stop-loss hunting
Clean news trading happens when you allow the dust to settle.
Step 5: Read Market Reaction, Not Headlines
Instead of reacting to headlines, look at:
Price action
Volume
Market structure
Order flow
Option chain (PCR, IV crush, delta shift)
Markets sometimes reverse the initial move when the news is already priced in.
Price is the real truth.
Step 6: Have a Pre-Defined Plan
Before the news releases, decide:
If number is better → buy or go long
If number is worse → sell or go short
If number meets expectations → avoid trading
This clarity eliminates emotional decisions.
Step 7: Avoid Social Media & TV Noise
Once news is released, social feeds explode with:
Panic
Rumors
Emotional reactions
Incorrect interpretations
Professionals ignore all this and stick to data and price.
5. Tools and Indicators to Reduce Noise in News Trading
These tools help you filter real movements from noise:
1. Volume Profile
Shows if the move has real institutional participation or just retail panic.
2. Market Structure
Identifies:
break of structure (BOS)
change of character (CHOCH)
real trend direction
3. Volatility Indicators
ATR (Average True Range)
Implied volatility (IV)
They help you avoid fake spikes.
4. Liquidity Zones
News often sweeps liquidity before moving in the real direction.
5. Option Chain Analysis
IV Crush
Rapid delta movement
Change in OI
PCR shift
This gives instant information on institutional positioning.
6. Best Markets for News Trading
Forex Market
Most sensitive to:
interest rate decisions
inflation
employment data
Stock Market
Most sensitive to:
earnings
M&A news
regulatory changes
Commodity Market
React to:
crude oil inventory
OPEC decisions
weather reports (for agri commodities)
Index Futures (Nifty, Bank Nifty)
React strongly to:
RBI policy
global cues
geopolitical risk
These markets give clean opportunities during news.
7. Common Mistakes to Avoid
Trading BEFORE the news – high risk
Entering too late AFTER the move – trap
Following hype and rumors
Not using stop-loss
Taking too large position sizes
Over-trading due to excitement
Ignoring the bigger trend
Avoiding these mistakes helps you trade news without getting caught in noise.
8. Risk Management for News Trading
News trading is profitable only with strict risk rules:
Keep position size small (1–2%)
Use stop-loss every time
Avoid averaging losers
Take profits quickly
Never hold weak trades through big events
News moves fast; your risk control must be even faster.
9. How Professionals Maintain Clarity
Top traders follow this checklist:
They prepare for news
They track expectations, not opinions
They avoid emotions
They follow price action
They execute as per plan
They ignore noisy sources
They use data, not predictions
This is why their entries are clean and exits are disciplined.
Conclusion
Trading news without noise is all about clarity, preparation, discipline, and data-based decisions.
Instead of reacting to hype, you follow a structured process:
Identify high-impact news
Study expectations
Wait for real numbers
Confirm with price action
Execute clean trades
Manage risk tightly
When done properly, news trading can give some of the best and fastest profits in the market. When done emotionally, it becomes the fastest way to lose money.

NVIDIA hourly patteren✅ Resistance Levels
Near ~$198.50 as a third resistance point.
Around ~$194.97 as a second resistance zone.
A prior high close‑to ~$212 from recent months that may act as a major ceiling.
✅ Support Levels
Support identified at ~$183.33.
A lower support zone near ~$179.79.
Broad support zone in the ~$182‑187 range from another study.

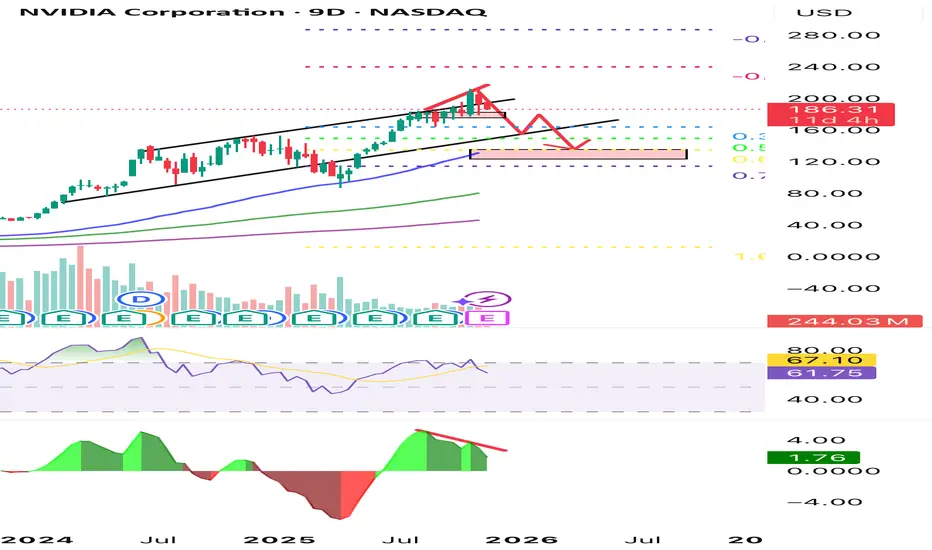
Bearish Divergence Triggering a Mid-Cycle Cooldown?NVDA is flashing a notable momentum deceleration. Price keeps printing higher highs while both RSI and MACD histogram carve lower highs — a classic bearish divergence signaling a potential medium-term pullback.
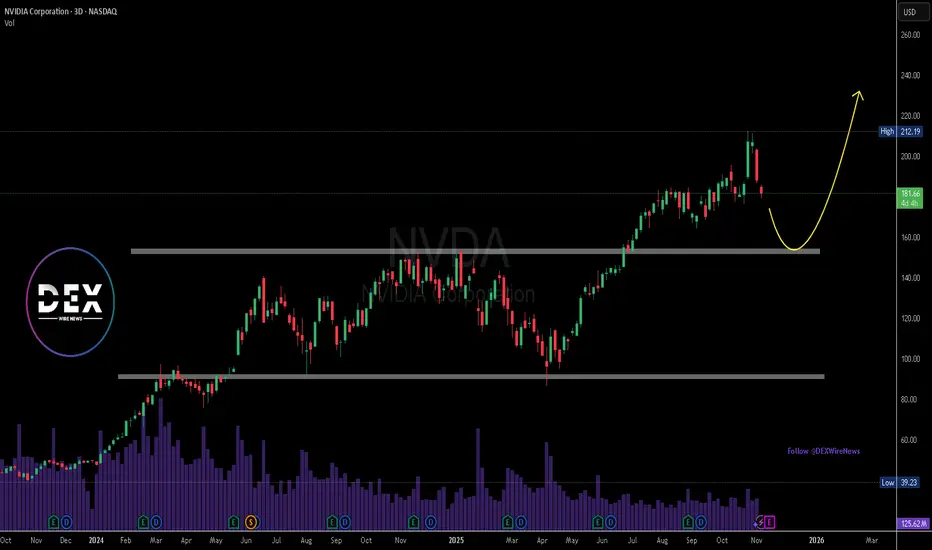
Price has also broken below the rising micro-channel, suggesting exhaustion after an aggressive vertical rally. If sellers maintain control, the next liquidity pockets sit around the Fibonacci cluster between 0.5 and 0.618, roughly the $145–$155 zone. A deeper corrective flush could extend toward the $130–$115 demand block highlighted on the chart.
The broader trend remains structurally bullish, but current signals point to a healthy corrective phase rather than immediate continuation. Watching how price behaves on the retest of the broken channel will be key to confirming further downside.
Market is shifting from momentum-driven expansion to controlled mean reversion.
UpdatePrice accelerated through solid red divergence line on RSI. If yellow RSI moving average drops below 40 on RSI expect further acceleration to 188 and potentially lower.
Definition and Relationship between Interest Rates and InflationIntroduction
Interest rates and inflation are two of the most important macroeconomic variables that influence the health, stability, and direction of any economy. They play a vital role in shaping economic growth, consumption patterns, investment decisions, and monetary policy. Economists, central banks, and policymakers constantly monitor the movement of interest rates and inflation because they are closely interconnected. A change in one often triggers a response in the other. Understanding their definitions, types, and interrelationship provides insight into how monetary policy stabilizes the economy and controls price levels.
Definition of Interest Rates
An interest rate is the cost of borrowing money or the return earned on savings or investments, expressed as a percentage of the principal amount per unit of time (usually per year). Essentially, it represents the price of money. When individuals, businesses, or governments borrow funds, they pay interest as compensation to the lender for parting with liquidity and bearing risk.
From an economic standpoint, interest rates are a tool to balance the demand for and supply of money. Central banks, such as the Reserve Bank of India (RBI) or the Federal Reserve in the U.S., use interest rates as a primary monetary policy instrument to influence economic activity.
Types of Interest Rates
Nominal Interest Rate: The stated rate without adjusting for inflation. It represents the actual amount paid or received in monetary terms.
Real Interest Rate: The nominal rate adjusted for inflation. It reflects the true cost of borrowing and the real return to lenders. The relationship is given by:
Real Interest Rate
=
Nominal Interest Rate
−
Inflation Rate
Real Interest Rate=Nominal Interest Rate−Inflation Rate
Policy Rate: The rate set by the central bank to regulate credit in the economy. Examples include the repo rate and reverse repo rate in India.
Market Interest Rate: Determined by the forces of demand and supply of money in financial markets.
Definition of Inflation
Inflation refers to the sustained increase in the general price level of goods and services in an economy over a period of time. When prices rise, the purchasing power of money decreases, meaning that each unit of currency buys fewer goods and services.
Inflation is not inherently bad—moderate inflation encourages spending and investment. However, excessive inflation erodes the value of savings, disrupts economic planning, and may lead to social and economic instability. Conversely, deflation, or the decline in prices, can be equally harmful because it discourages spending and investment, leading to lower economic growth.
Types of Inflation
Demand-Pull Inflation: Occurs when aggregate demand exceeds aggregate supply, causing upward pressure on prices.
Cost-Push Inflation: Arises when production costs (like wages and raw materials) increase, leading to higher prices for goods and services.
Built-In Inflation: Stems from the wage-price spiral, where workers demand higher wages to keep up with rising prices, which in turn increases production costs.
Hyperinflation: Extremely rapid and uncontrolled inflation, usually above 50% per month.
Stagflation: A condition where inflation and unemployment rise simultaneously, posing a severe challenge for policymakers.
The Relationship between Interest Rates and Inflation
Interest rates and inflation share a strong, inverse, and dynamic relationship. Generally, when inflation rises, central banks increase interest rates to control it. Conversely, when inflation falls or economic growth slows, they reduce interest rates to encourage borrowing and spending.
The interaction between the two can be understood through the following mechanisms:
1. The Fisher Effect
The Fisher Effect, named after economist Irving Fisher, explains the relationship between nominal interest rates, real interest rates, and expected inflation. According to this theory, the nominal interest rate is equal to the sum of the real interest rate and the expected inflation rate.
𝑖
=
𝑟
+
𝜋
𝑒
i=r+π
e
Where,
𝑖
i = Nominal interest rate
𝑟
r = Real interest rate
𝜋
𝑒
π
e
= Expected inflation rate
If inflation expectations rise, lenders demand higher nominal rates to maintain the same real return. This mechanism ensures that real returns remain stable despite fluctuations in price levels.
2. Central Bank Policy Response
Central banks play a key role in managing the relationship between interest rates and inflation. When inflation rises beyond the target (for example, above the RBI’s comfort zone of 4 ± 2%), the central bank raises policy rates such as the repo rate. This increases the cost of borrowing, reduces money supply, and cools down demand, thereby reducing inflationary pressure.
On the other hand, during periods of low inflation or deflation, the central bank cuts interest rates to stimulate borrowing, investment, and spending, which helps increase demand and stabilize prices.
3. Transmission Mechanism
Changes in policy rates affect inflation through the monetary policy transmission mechanism:
Higher interest rates → Higher borrowing costs → Reduced consumer spending and business investment → Lower aggregate demand → Reduced inflation.
Lower interest rates → Cheaper credit → Increased spending and investment → Higher aggregate demand → Rising inflation.
This process, however, takes time, and the impact may vary depending on the economy’s structure and financial system efficiency.
4. Inflation Expectations and Real Interest Rate
Inflation expectations influence both consumer behavior and monetary policy. If people expect future inflation to be high, they tend to spend more now, further driving up prices. Central banks, therefore, aim to anchor inflation expectations by maintaining credibility in their policies. Real interest rates (nominal minus inflation) provide the true measure of whether monetary policy is expansionary or contractionary.
For instance, if the nominal rate is 6% and inflation is 5%, the real interest rate is only 1%, indicating easy monetary conditions. Conversely, if inflation is 2% and the nominal rate is 6%, the real rate is 4%, signaling a tighter policy stance.
Impact of Inflation on Interest Rates
Rising Inflation → Higher Interest Rates:
When inflation increases, lenders demand higher nominal interest rates to offset the loss in purchasing power. Central banks raise policy rates to control excess demand and price rises.
Falling Inflation → Lower Interest Rates:
Low inflation reduces the pressure on monetary authorities, allowing them to lower interest rates and stimulate growth.
Unexpected Inflation → Distorted Interest Rates:
If inflation rises unexpectedly, borrowers benefit because they repay loans with money that has less value, while lenders lose purchasing power.
Impact of Interest Rates on Inflation
Tight Monetary Policy:
Raising interest rates reduces credit availability, slows economic activity, and curbs inflationary trends.
Loose Monetary Policy:
Lowering interest rates encourages borrowing and spending, potentially leading to inflation if demand exceeds supply.
Interest Rate Lag Effect:
Monetary policy operates with a time lag. It may take several months for interest rate changes to influence inflation meaningfully.
Practical Examples
United States: In the 1980s, the Federal Reserve under Paul Volcker sharply increased interest rates to curb double-digit inflation, successfully restoring price stability.
India: The Reserve Bank of India often adjusts the repo rate in response to consumer price index (CPI) inflation. For instance, during high inflation periods such as 2013 or 2022, the RBI raised rates to maintain price stability.
Conclusion
The relationship between interest rates and inflation is one of the cornerstones of modern macroeconomic management. While inflation represents the rate at which prices increase, interest rates determine the cost of borrowing and the reward for saving. The two are intricately linked through expectations, monetary policy, and the overall balance of demand and supply in the economy.
An optimal policy aims to maintain a balance—interest rates that are neither too high to stifle growth nor too low to fuel inflation. Central banks, through careful monitoring and policy adjustments, strive to achieve price stability and sustainable economic growth. Understanding this delicate relationship is essential for investors, businesses, and policymakers in making informed economic decisions.
NVDGETTEX:NVD
NVD should undergo a healty correction in the coming weeks. My view is that the NVD stock will move toward the strong support level at the price of $130 -$117 whit stoploss at price $183

NVIDIA STOCKS TECHNICAL DETAILS FOR AI STOCKS NVIDIA.
AFTER A RALLY COMES A CORRECTION TO KEEP A HEALTHY TREND.NVIDIA WEEKLY REJECTION LEVEL AT 213$ WILLHAVE THE FIB 0.382 (165.32$) DEMAND FLOOR WATCHED FOR POTENTIAL BUY.
THE NEXT DEMAND FLOOR IS 50% FIBONACCI 150.52$ A STRONG PSYCHOLOGICAL DEMAND FLOOR AND THE WEEKLY SMA 50 PROVIDING BUY BIAS. TO THE NEXT DEMAND FLOOR AT 150.52$ FOR NVIDIA .
FUNDAMENTAL OUTLOOK.
Reasons for Recent Stock Drop:
Concerns over valuation: The stock trades at a high forward P/E (~59x), raising worries about near-term growth sustainability.
Competitive pressures: Emerging competitors (e.g., AMD, Intel) and Chinese startups with cost-effective AI models (like DeepSeek) create market uncertainties.
Regulatory and geopolitical risks: US export restrictions on advanced AI chips may constrain NVIDIA’s international growth.
Profit margin pressure: Expectations of tighter profit margins due to accelerated rollout of new chip architecture (Blackwell).
Broader tech sector pullbacks driven by rising bond yields and inflation fears have also weighed on NVIDIA.
Overall, while NVIDIA's long-term outlook in AI remains positive, short-term market dynamics including valuation concerns and increased competition caused the stock to retreat after reaching highs near $213.
#STOCKS #NVIDIA

NVDA Wave Analysis – 5 November 2025
- NVDA reversed from resistance area
- Likely to fall to support level 193.75
NVDA recently reversed from the resistance area between the key resistance level 210.00 (which stopped the previous impulse wave i), resistance trendline of the daily up channel from June and the upper daily Bollinger Band.
The downward reversal from this resistance area started the active short-term ABC correction ii – which belongs to wave iii from last month.
Given the strength of the resistance level 210.00 and the bearish divergence on the daily Stochastic indicator, NVDA can be expected to fall to the next support level 193.75, former resistance from the start of October.
