$TSLA: Branching Effect🏛️ Research Notes
Reaching branching effect through cross-cycle interconnection. Alongside I'll test some elements mentioned below.
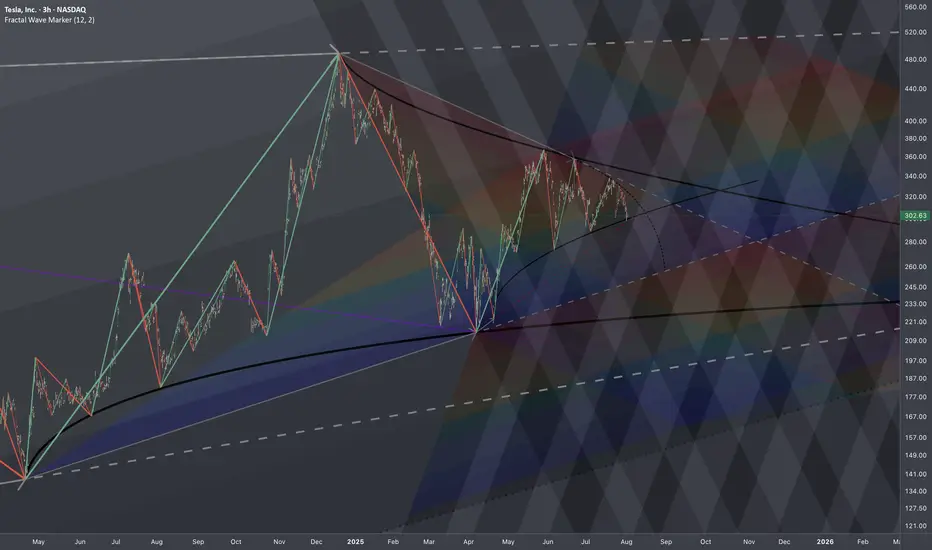
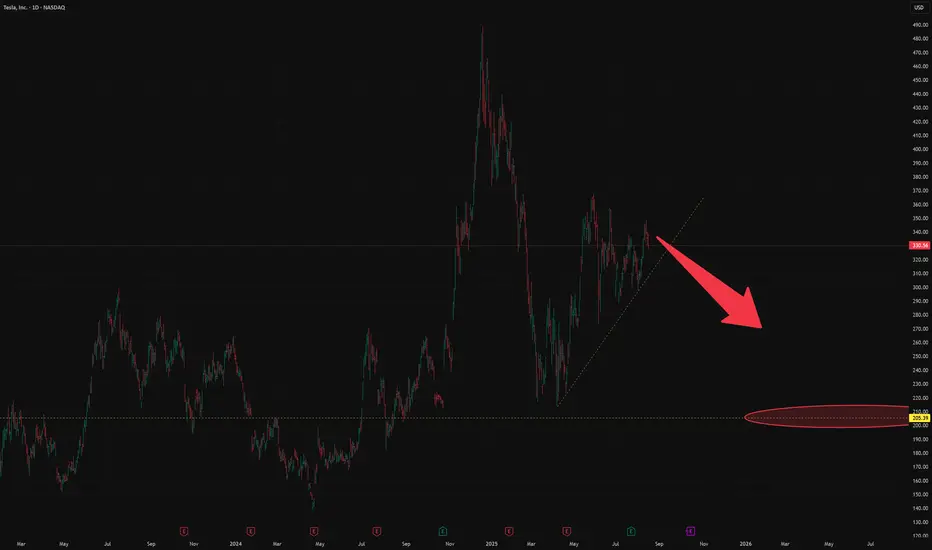
Local Progressions
Rhyme and levels derived from apparent cycle compression.
Added channels with darkening gradient that cover bullrun from mid 2019, driven by angle of tops.
In the local scope, as price deepens into denser zone the probability of disproportional reaction gets higher. t would probably complete its intermediate and even longer-term cycles before escaping the boundary.
TSLACL trade ideas
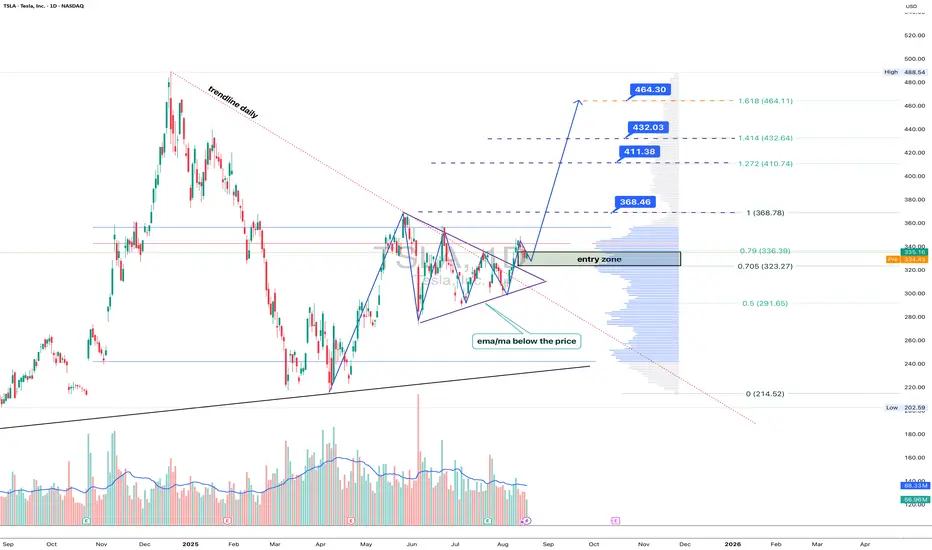
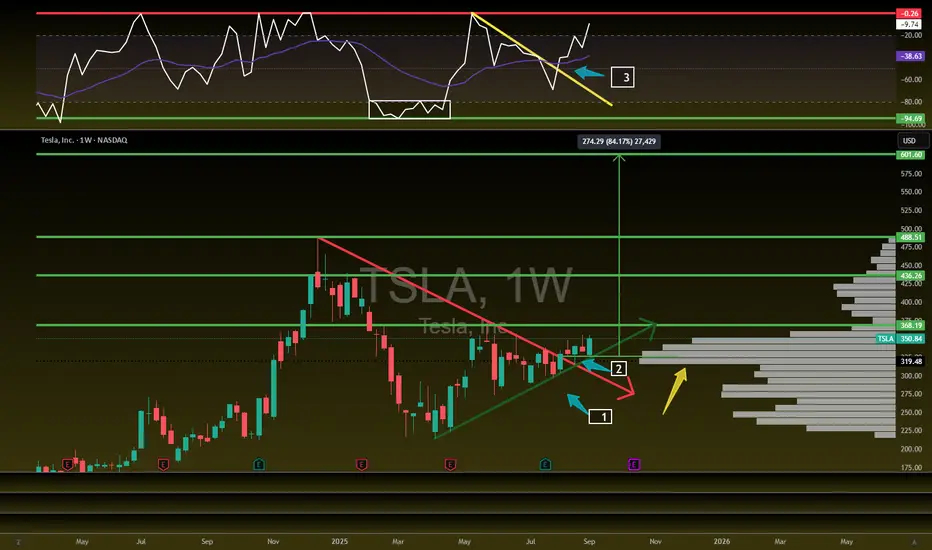
Tesla: breakout mode, Elon’s rocket fuel for the chartTechnically , Tesla broke out of a symmetrical triangle while holding above EMA/MA supports, which confirms bullish control. The breakout unlocks targets at 368.46 (Fibo 1), followed by 411.38, 432.03, and the 1.618 extension at 464.30. Volume profile confirms strong accumulation below, leaving the upside path less crowded.
Fundamentally , Tesla keeps investor attention alive. EV sales stabilized, but the focus has shifted to AI and robotaxi — Musk’s latest promises of disruption. With Fed rates peaking and yields easing, growth stocks regain momentum. Risks remain from Chinese competitors, yet Tesla’s margins are still leading the industry.
Tactical plan : entry zone stands at 323–336. As long as price holds above it, buyers target 368.46 → 411.38 → 464.30. A break below 323 would flip the bias back toward 291.
Bottom line: Tesla’s chart looks ready for lift-off. Musk might be dreaming of Mars, but for now, bulls are happy if he just launches the stock a few hundred dollars higher.
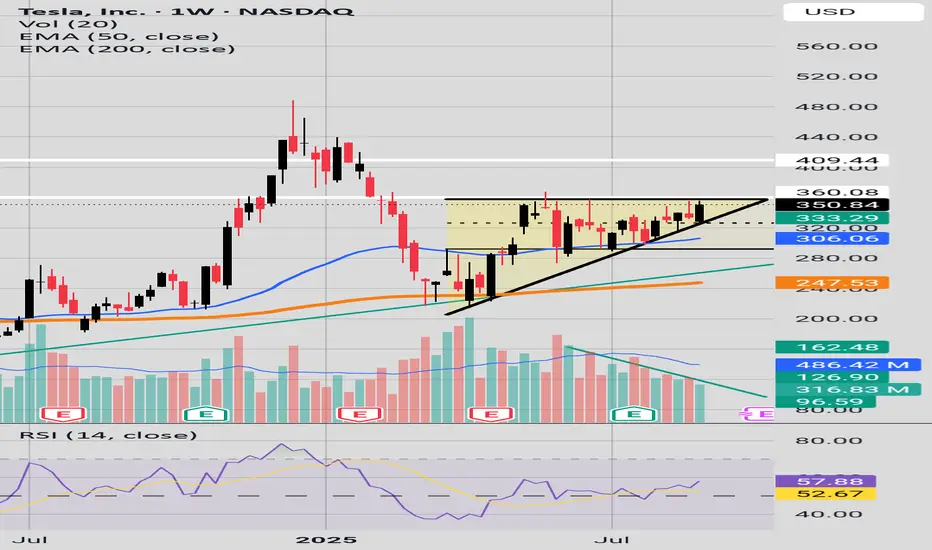
Inflection PointWe have now and ascending triangle forming with key resistance around the 360$ price area.
RSI is above 50.
Volume levels drying up.
Are we soon going to get a possible breakout to the 400$ price levels are a retreat to the green trend line around 290$?

Tesla Looks Primed!NASDAQ:TSLA Looks primed!
Bullish as all getup!
Breaking out-Volume Shelf-Bullish Willy
Targets: $368/ 436/ 488/ 601
TSLA: WAVE CTSLA has been consolidating within a range since early June and is expected to breakout over the next few weeks. As the markets are due to end a minor wave 4, the final wave 5 should allow TSLA to breakout out to the upside to a potential target of $422.

TSLA 45Minutes Time frameTSLA 45-Minute Snapshot
Current Price: $346.97 USD
Change: +0.18% from the previous close
Intraday Range: Not available
🔎 Technical Indicators
RSI (14): 53.64 — Neutral
MACD: 1.78 — Buy signal
Moving Averages:
5-period SMA: $347.01 — Sell signal
10-period SMA: $346.78 — Buy signal
20-period SMA: $347.82 — Sell signal
50-period SMA: $340.53 — Buy signal
📈 Market Sentiment
Pivot Points:
R1: $347.52
R2: $348.18
R3: $348.95
S1: $345.32
S2: $344.65
S3: $343.99
📅 Outlook
Bullish Scenario: A breakout above $347.52 could lead to a push toward $348.18 and higher.
Bearish Scenario: A drop below $345.32 may test support around $344.65.
Overall Bias: Neutral to slightly bullish, with mixed signals from moving averages.

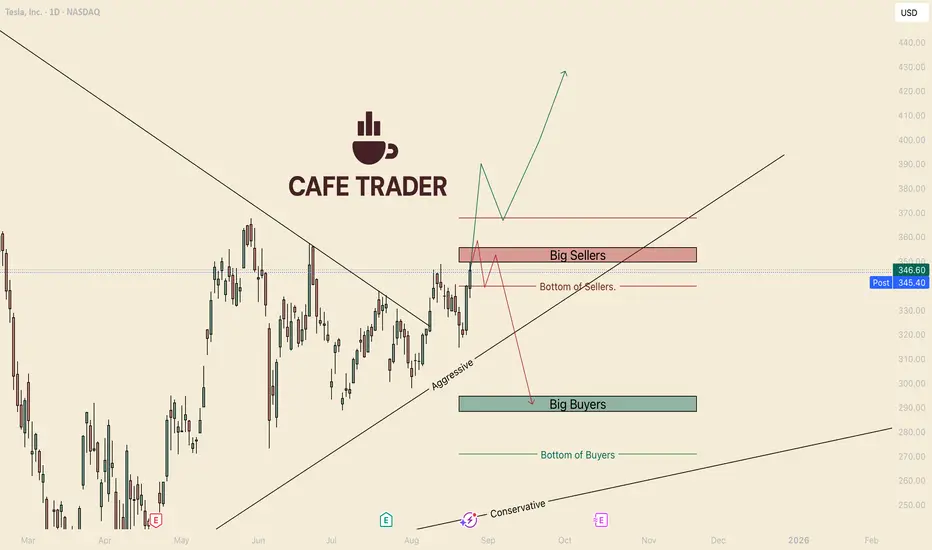
TESLA's Make it or Break it WeekHello I am the Cafe Trader.
Today we are taking another look at Tesla. Everyone knows what a beast this has been in the past, I am going to prep you on what to do when awakens.
As of today, we sit under the last strong seller before the 400's, breaking this and holding (a close above on a Friday) would make a strong case to test highs (minimum).
Overall, I still think there is a strong case for the downside, but this seller determines everything. This is due to the time we have been in the top of the range. So here are your two scenarios
Green Scenario
If Tesla can push through the strong seller zone (roughly 350–365) and actually close above it, then bulls would gain full control. That opens the door for a continuation move toward 400+.
If this happens, I will publish some trade ideas with a new chart.
Red Scenario
If This Seller continues to flush out these buyers, this could spark a large reaction to the downside. In that situation we would be looking for a move back into the big buyer zone around 290. A failure there could drag us all the way to the conservative trend line near 270.
Personally I lean short biased in the next 2-4 weeks, Very bullish over the next few years.
Hope you enjoyed, please DM or comment with questions or another stock you would like analyzed.
Happy Trading
@thecafetrader
My levels to chase $TSLA bull momentumInvestors are optimistic about potential Fed rate cuts and Tesla’s push into robotics and autonomous driving.
Tesla received a permit to begin testing autonomous vehicles on public roads in Nevada. This follows its limited robotaxi rollout in Austin and signals broader ambitions for nationwide autonomous ride-hailing services.
Elon Musk claims that “80% of Tesla’s value will be Optimus,” referring to its humanoid robot initiative. With EV growth slowing, Musk is pivoting Tesla’s narrative toward AI and robotics.
There are equal numbers of Tesla haters and lovers!

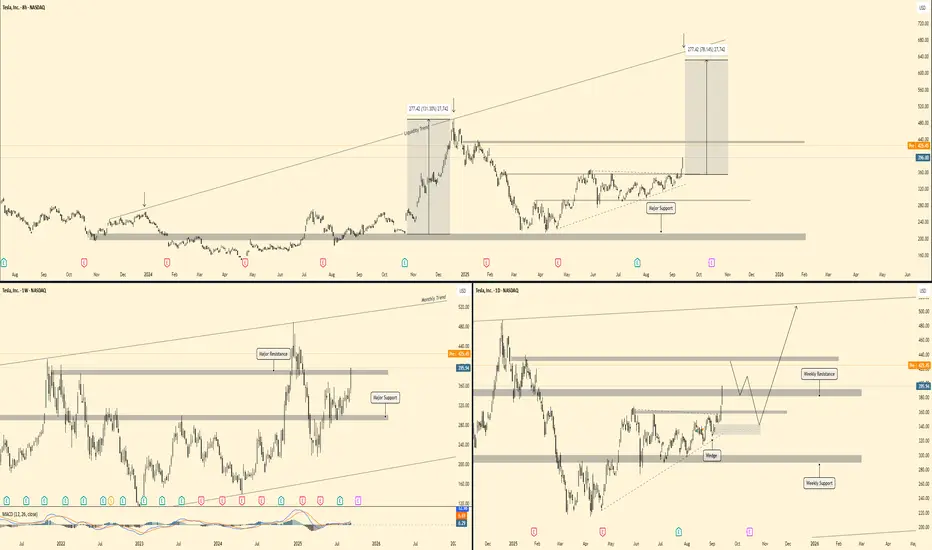
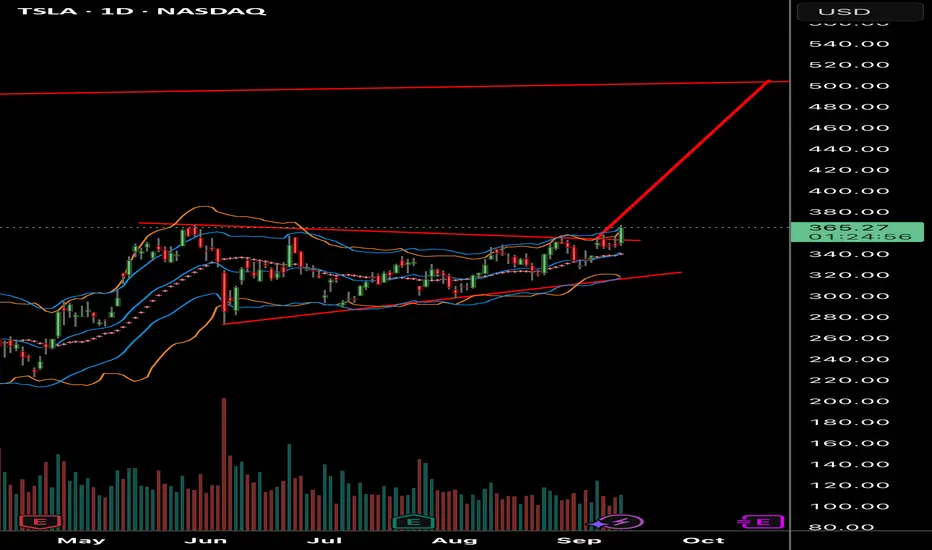
Tesla - Forecast (Before and After)🕰 Weekly View
Price is holding above major support at 325–340 and pushing into weekly resistance around 420–440. The broader monthly trend points higher, with upside liquidity aligned toward the 500–520 zone.
📉 Daily Structure
Resistance: 420–440 supply zone.
Support: 325–340 demand zone, with a secondary base near 280.
Price has broken from a wedge formation and is now testing overhead supply, with potential to retest support before continuation.
⏱ 8H Breakdown
Tesla has been trending steadily upward off major support. Clean structure shows momentum building. A breakout and retest scenario could drive price toward 500+ targets, while failure at 420–440 could cause a pullback into 360–380 support.
🔎 Outlook
Scenario 1 → Retest support (360–380) before continuation higher.
Scenario 2 → Clean breakout above 440 accelerates into 500–520 zone.
Bias : Bullish continuation → mid-term target 500+.
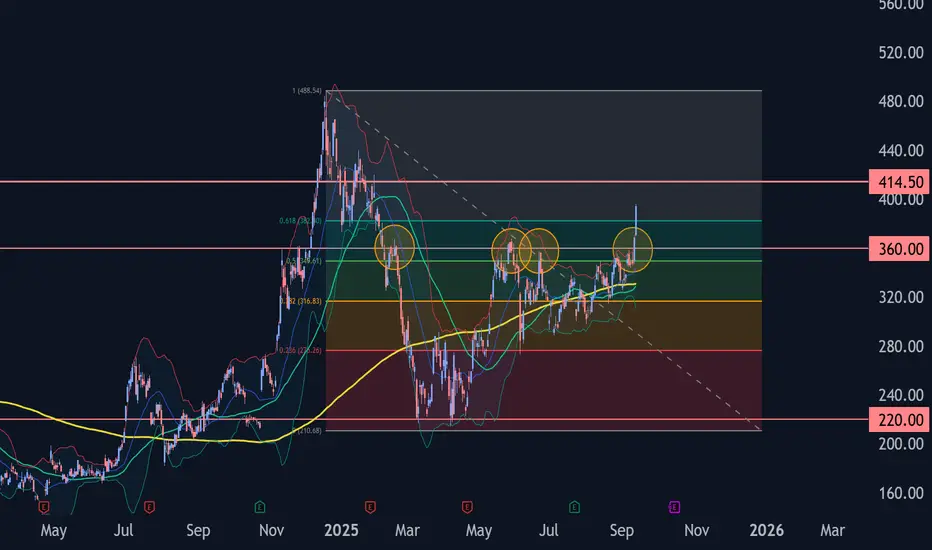
Tesla Wave Analysis – 12 September 2025- Tesla broke resistance area
- Likely to rise to resistance level 414.50
Tesla recently broke the resistance area located at the intersection of the resistance level 360.00 (which has been reversing the price from February), resistance trendline of the daily up channel from July and the 50% Fibonacci correction of the downward impulse from December.
The breakout of this resistance area accelerated the active impulse wave 3 of the intermediate impulse wave (3) from June.
Tesla can be expected to rise to the next resistance level 414.50 (target price for the completion of the active impulse wave 3).
Could we see another Bullish leg on #TSLAmore consolidation here will confirm this wave scenario with targets of
324
384
The invalidation of this scenario is the break of 240.7 (-5%)
Trade safe

TSLA about to POPClear play that I’ve been sharing with friends and it’s playing out perfectly so far
TSLA Volatility Contraction Pattern (VCP) LONG When TSLA breaks above 350 and closes, the price will launch to $390 very quickly.
A VCP is a technical pattern, showing lessening declines in a range bound formation. A bull flag showing higher-lows is the best, as seen with TSLA.
Volatility is going to breakout sharply to the upside. If you TSLA above 350 just buy and hold, you’re too late trying to get a better deal.
🚀🚀🚀🌖
TESLA BULLISH BREAKOUT|LONG|
✅TESLA is going up
Now and the stocks is trying to
Made a bullish breakout
Of the key horizontal
Level of 367.50$ and IF breakout
Is confirmed we will be expecting
A further bullish move up
LONG🚀
✅Like and subscribe to never miss a new idea!✅

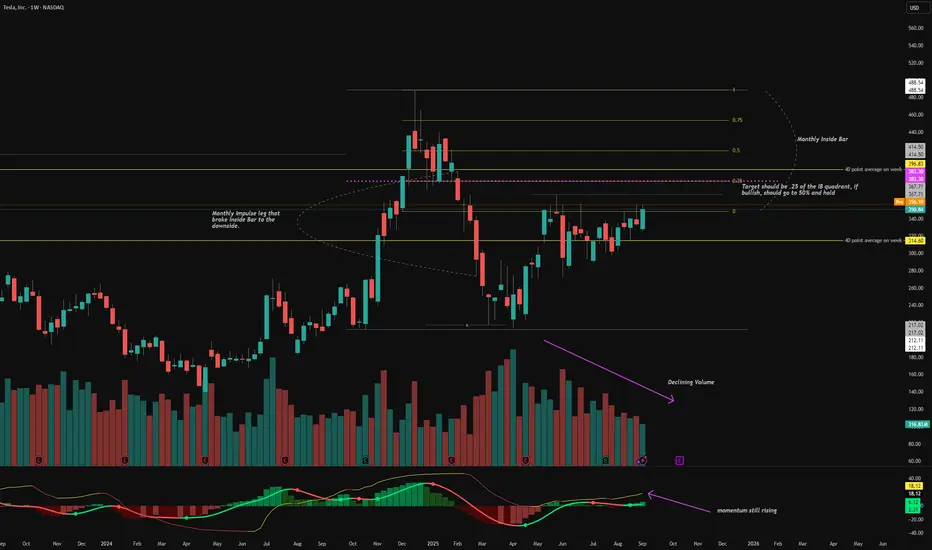
TSLA - LongTSLA looks to be heading to the 25% of the Inside Bar on the monthly. Need to have strict risk management on this incase it falls through. Weekly looks good, with targets of 25% and 50% of the Inside Bar quadrant. TSLA also moves an average 40 points per week, so the upside looks more accurate then downside.
TSLA Market Preview for Monday, September 8, 2025,
Price Action & Market Structure
* TSLA is trading around 354–356, up +3.6% overnight, showing relative strength compared to SPY.
* Price broke out of a descending wedge, now consolidating near upper channel resistance.
* Momentum is cooling after the strong overnight run, but structure remains bullish unless price loses 352 support.
Key Levels
* Resistance Zones (Upside Targets):
* 357.5–360 → Near-term rejection zone.
* 362.5 → 365.0 → GEX cluster + Call Wall resistance.
* 370.0 → Major Gamma Wall / Highest positive NET GEX.
* Support Zones (Downside Risk):
* 352.8–354.0 → Local breakout retest support.
* 343.8–345.0 → Strong structural support + previous demand zone.
* 335.0 → HVL anchor + Put hedge support.
Options Sentiment (GEX & IV)
* GEX: Balanced but slightly tilted bullish → Calls 49.4% vs Puts 3.5%.
* IVR: Low at 8.5, options are cheap → potential for strong directional move.
* Gamma Walls:
* 370 → Strong Call Wall (cap).
* 335 → Strong Put Support (floor).
This positioning suggests TSLA is “boxed” between 335 support vs 370 resistance, with intraday swings possible.
Indicators
* MACD (15m): Just made a bearish crossover after extended green histogram → short-term pullback risk.
* Stoch RSI: Rolling down from overbought → signals cooling momentum.
Scenarios for Today
Bullish Case (favored if 352 holds):
* Hold 352–354 support → reclaim 357.5.
* Targets: 362.5 → 365 test, with potential extension to 370 Gamma Wall.
Bearish Case (watch if 352 breaks):
* Lose 352 → retrace quickly to 345 zone.
* If heavy market weakness (SPY fails), could extend to 335 HVL.
Trading Thoughts
* Scalp Longs: Look for bounces near 352–354 support, aiming for 360+.
* Fade Shorts: If price rejects 357.5–360 zone without volume confirmation.
* Stops:
* Longs → below 352.
* Shorts → above 360.5.
Summary
TSLA remains stronge as long as 352 holds, bulls have room to test 360–365 and possibly squeeze toward 370. If 352 fails, expect a deeper retrace to 345–335. Options flow leans bullish, but intraday volatility is likely.
⚠️ This analysis is for educational purposes only, not financial advice. Manage risk and confirm with live price action before trading.

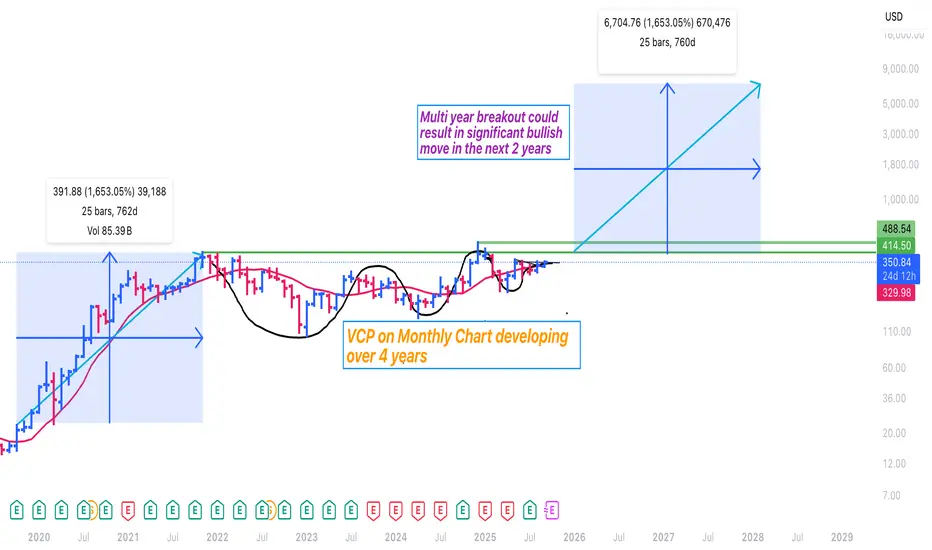
$TSLA showing multi year VCP & a breakout would be Bullish+++AB = CD pattern could emerge once broken out of this multi-year VCP / consolidation pattern that is developing in $TSLA.
Price action seem to indicate $280 - 310 is the likely bottom and odds favor a signficant move up!
Let's see how it pans out.
I am bullish.
We are not positive about TeslaFollow us and don't miss a next idea on Global Markets
The impact of tariffs and expiring EV credits is expected to pressure future US deliveries and regulatory credit revenue in the near term
Elon Musk: Well, we're in this weird transition period where we will lose a lot of incentives in the US. Slab incentives actually in many other parts of the world. But we'll lose them in the US. Across all of it at the relatively early stages of autonomy. On the other hand, autonomy is most advanced and most available from a regulatory standpoint in the US. Does that mean we could have a few rough quarters? Yeah. We probably could have a few rough quarters. I'm not saying that we will, but we could. Q4, Q1, maybe Q2.
Revenue -12% y/y ( decline for the first time in 10 years)!!!
EPS 0,27 $ agj vs 0,39 $ estimated
FCF -89% y/y but still positive ( just 146 M$)
CAPEX for 2025 increased
EBITDA dropped by 7.8%.
Price to Sales 12,7
P/B 14
Expensive
We expect declining of the stock price to 210 $
And, yes, many still regard Tesla as a car manufacturer, but this is not a correct view of the company. Later in our blog we will touch on the question of how to correctly look at the brainchild of Elon Musk.
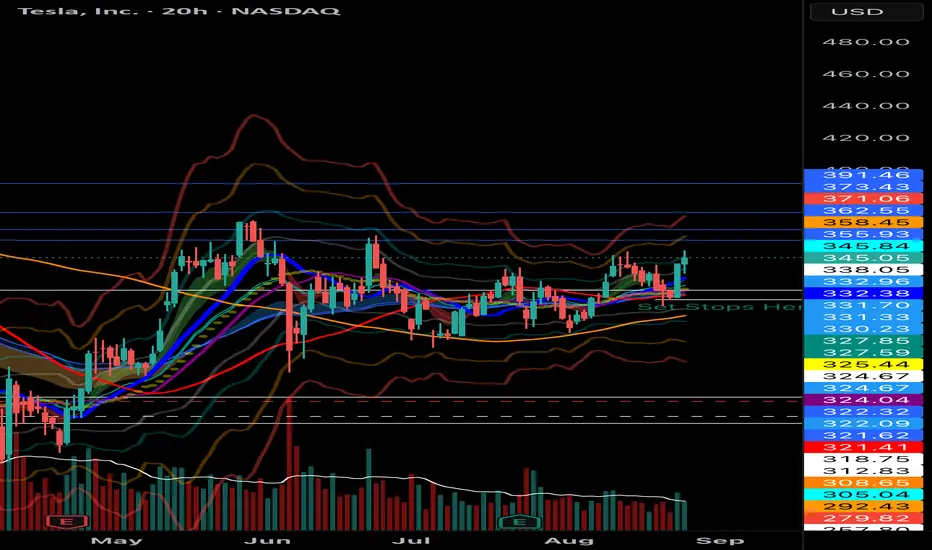
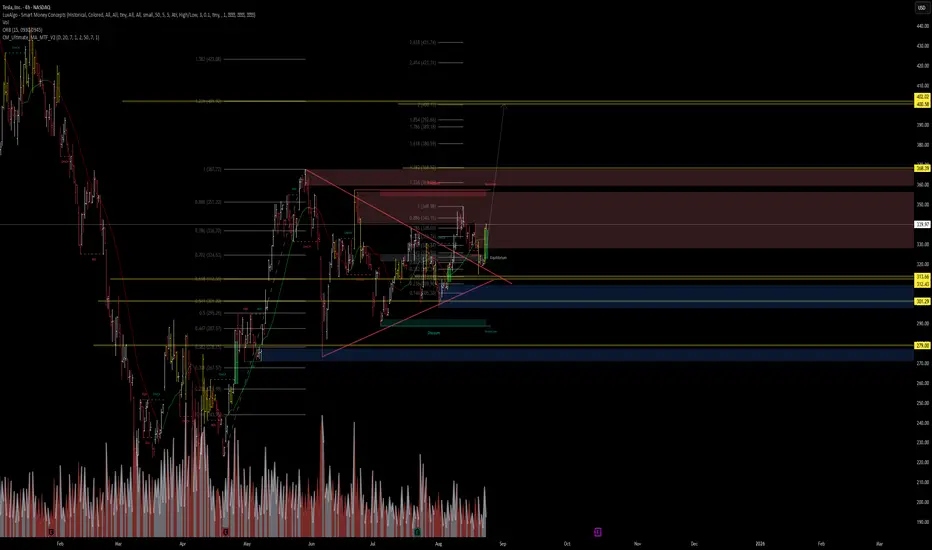
TSLA: AI + Technicals Meets Macro TailwindsAI Forecast (VolanX Protocol)
Current Price: $340.01
30-Day Target: $387.70 → +14.0% upside
Institutional Trade Plan:
Entry: $340.01
Stop Loss: $314.45
Targets: $346.81 / $387.70
Risk/Reward: 1.87:1
Model Agreement: 8/9 bullish
Technical Structure (4H Chart):
Broke above a triangular consolidation, now testing equilibrium from below.
Key support levels: $313.60 / $301.30 (discount zone).
Resistance / extension zones lined up at:
First: $368–$369
Extended: $400–$402 (1.618–2.618 fib levels).
Macro Catalysts & Market Context:
Fed Rate Sentiment Improving: Powell hinted at possible September rate cuts; markets rallied with Tesla leading, rising 6%.
Value Sense Blog
+6
Barron's
+6
Investors
+6
Investopedia
+1
EV Tax Credit Flexibility: New IRS guidance allows buyers to secure the $7,500 credit via contracts before Sept 30, potentially boosting demand.
Investors
+1
Mixed Q2 Fundamentals: Q2 saw declining deliveries & regulatory credits; Musk warned of “rough quarters” ahead, but emphasized AI & robotaxi growth.
Investors
+6
Investors
+6
New York Post
+6
Geopolitical Risks & Tariffs: Tariff pressure, fading EV credits, and sales underperformance in key regions keep long-term risks present. Analyst targets range widely.
Investopedia
MarketWatch
Value Sense Blog
Investors
Probabilistic Outcome Mix:
Base Case (50%) → $346–$368 (near-term resistance test aligned with AI target)
Bull Extension (25%) → $387–$402 if macro tailwinds persist and structure sustains breakout
Bear Risk (25%) → Breakdown below $340 could retest $313–$301
Trade Setup Breakdown:
Long Entry: $340
Stop: $315
Take Profit #1: $368
Take Profit #2: $388
Option: scale into $400s if breakout momentum holds
Why It Matters:
This setup represents AI-driven momentum meeting technical trend alignment and favorable macro catalysts. If Fed signals, EV policy flexibility, and optimism around Tesla’s AI/autonomy can power continued upside, $387–$400 becomes very plausible. However, macro risks and execution hurdles need monitoring.
TSLA support $324.48 has to hold for longTSLA bounced off $35 range support this morning on 4 hour was oversold. Needs to hold $324.48 bottom of uptrend support to see wave 5 target of $426 otherwise the trade is no longer valid and will need to wait for another support and oversold condition to go long

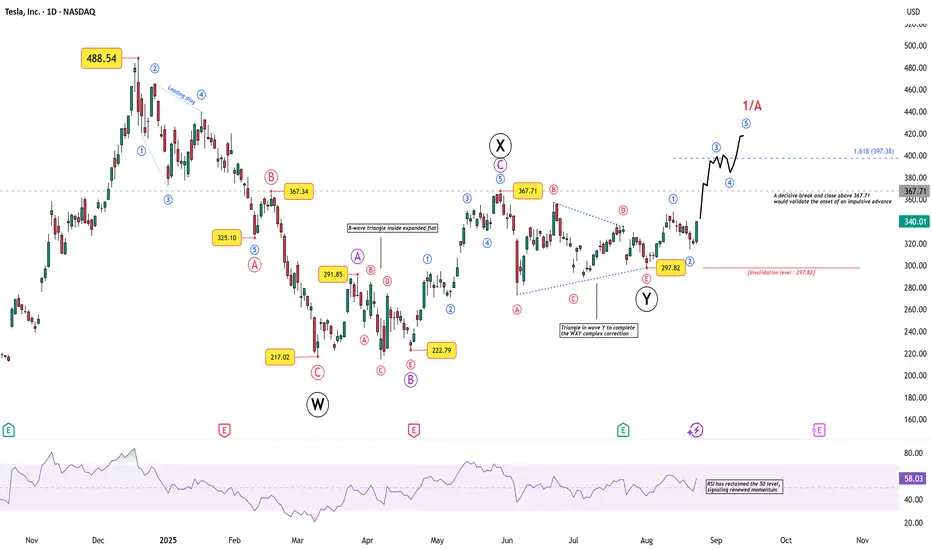
Tesla’s Breakout Test: Impulse or Fakeout?Tesla’s recent price action is stirring interest again, not just for retail traders but also for chart technicians who track Elliott Wave structures across global equities.
After a deep corrective phase that carried price down from 488.54 to 217.02 , Tesla has been carving out a multi-layered corrective structure. Here’s the breakdown:
Wave W completed into 217.02 , marking a sharp low.
This was followed by a complex X wave , which included an expanded flat where the B-wave unfolded as a triangle — a rare but valid corrective formation.
Wave Y then ended with a contracting triangle, neatly completing the W–X–Y correction near 297.82 .
From that point, Tesla appears to have begun an impulsive sequence:
Wave 1 and 2 are already visible, with the 297.82 low as the key invalidation level.
A decisive break and close above 367.71 would confirm the onset of Wave 3, targeting 397.38 (1.618× Wave 1).
Momentum is supporting the structure: RSI has reclaimed the 50 level, hinting at renewed strength.
What Next?
If the count holds, Tesla could be in the early stages of a larger impulsive rally, with Wave 1/A projecting toward the 400–420 zone . However, traders should remember that breaking below 297.82 invalidates the impulsive outlook and revives the broader corrective scenario.
Disclaimer: This analysis is for educational purposes only and does not constitute investment advice. Please do your own research (DYOR) before making any trading decisions.
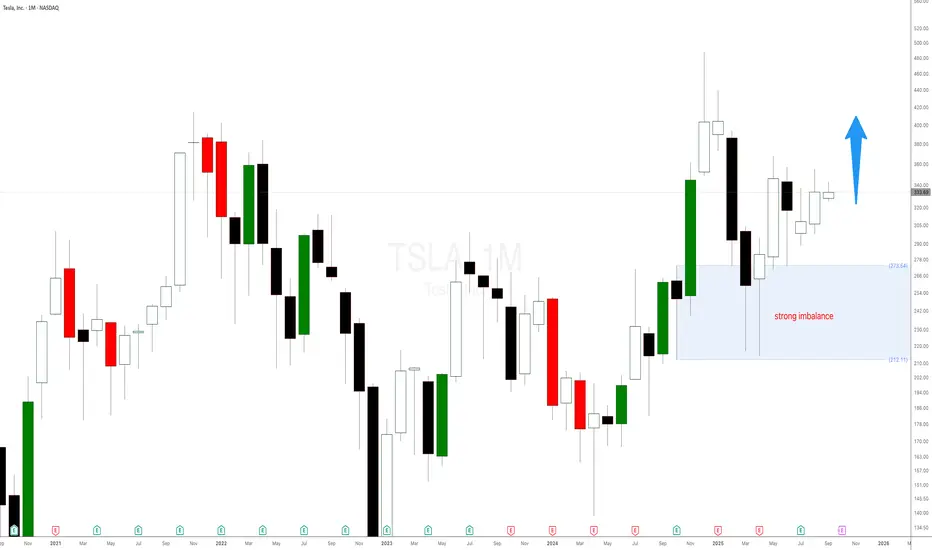
Tesla stock is printing new highs helped by the strong imbalanceTesla stock is printing new highs helped by the strong weekly imbalance as expected and mentioned in a previous Tesla stock analysis. The weekly demand level at $298 is playing out well. There is still a lot of room for NASDAQ:TSLA stock to keep on rallying. You can use the smaller timeframes to add more long positions or new imbalance to trade with even higher probability.