Tesla Short: Expecting Wave 3 of 3 DownIn this video, I go through the Elliott Wave Analysis for Tesla in detail and talk about how the final corrective wave may not be ideal but is still al valid place for a short. In essence, I think that Tesla should be going for a wave 3 of 3 down that will see it going to $273 for a short-term target and even below $214 based on the general market condition that I have previously discussed.
The stop loss for this idea is above 349.54 but I recommend setting it higher around 351.85.
Good luck!
TSLACL trade ideas

TSLA 45Minutes Time frameTSLA 45-Minute Snapshot
Current Price: $346.97 USD
Change: +0.18% from the previous close
Intraday Range: Not available
🔎 Technical Indicators
RSI (14): 53.64 — Neutral
MACD: 1.78 — Buy signal
Moving Averages:
5-period SMA: $347.01 — Sell signal
10-period SMA: $346.78 — Buy signal
20-period SMA: $347.82 — Sell signal
50-period SMA: $340.53 — Buy signal
📈 Market Sentiment
Pivot Points:
R1: $347.52
R2: $348.18
R3: $348.95
S1: $345.32
S2: $344.65
S3: $343.99
📅 Outlook
Bullish Scenario: A breakout above $347.52 could lead to a push toward $348.18 and higher.
Bearish Scenario: A drop below $345.32 may test support around $344.65.
Overall Bias: Neutral to slightly bullish, with mixed signals from moving averages.

Check if it can rise above 347.21
Hello, traders!
Follow us to get the latest updates quickly.
Have a great day!
-------------------------------------
(TSLA 1D chart)
The key is to determine which direction the price breaks out of the two support and resistance areas of 268.07-311.48 and 347.21-382.40.
For a step-up trend to occur, the price must remain above 334.09-347.21.
However, a step-up trend is highly likely only if the price rises above the support and resistance levels of 382.40 and 421.06 on the 1W and 1M charts.
Even so, a larger increase is likely if the price rises above the 334.09-347.21 range on the 1D chart.
-
The 268.07-311.48 range also falls within the HA-High indicator.
Therefore, it's important to remember that the current position is not a buy position, but rather a sell position.
However, for new buys, it's best to initiate them when support is found near the M-Signal indicator on the 1M chart, if possible.
Therefore, when the 268.07-311.48 range acts as a support zone, it can be considered a buying opportunity.
However, since it's within the HA-High indicator zone, trades should be executed with short and quick responses.
The key volatility period is around October 7th, but before that, we should check the movements around September 5th and September 12th.
At this time, the trend is likely to be determined by which direction the price moves: the 268.07-311.48 range or the 347.21-382.40 range.
-
Thank you for reading to the end.
I wish you successful trading.
--------------------------------------------------

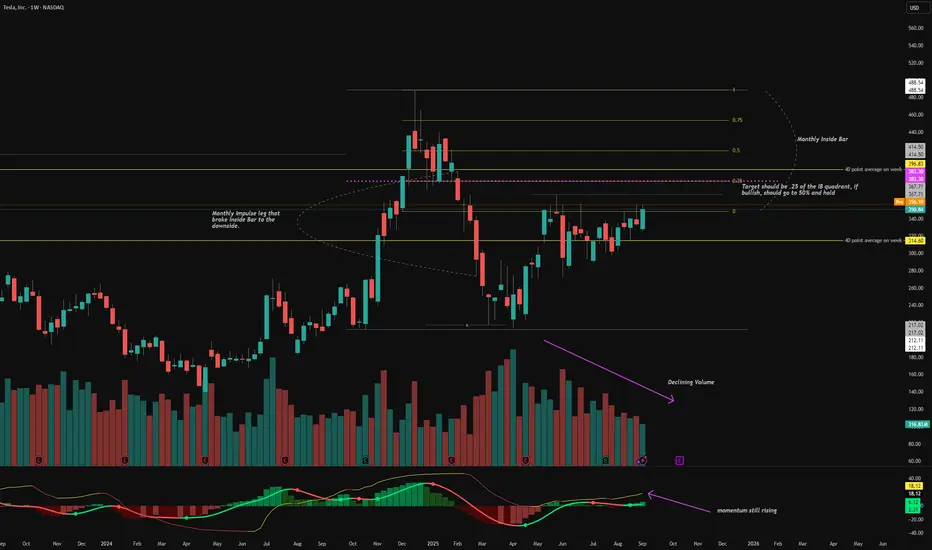
TSLA - LongTSLA looks to be heading to the 25% of the Inside Bar on the monthly. Need to have strict risk management on this incase it falls through. Weekly looks good, with targets of 25% and 50% of the Inside Bar quadrant. TSLA also moves an average 40 points per week, so the upside looks more accurate then downside.
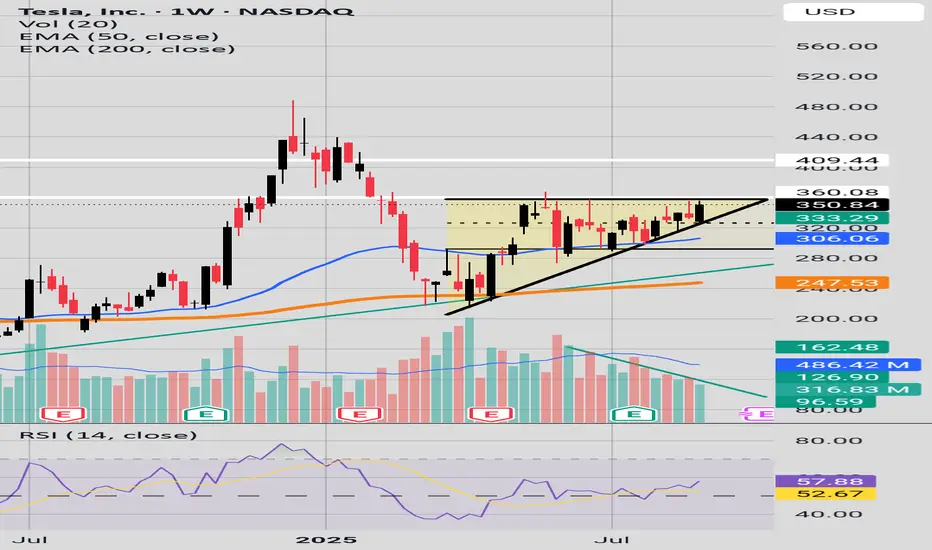
Inflection PointWe have now and ascending triangle forming with key resistance around the 360$ price area.
RSI is above 50.
Volume levels drying up.
Are we soon going to get a possible breakout to the 400$ price levels are a retreat to the green trend line around 290$?
TSLA Market Preview for Monday, September 8, 2025,
Price Action & Market Structure
* TSLA is trading around 354–356, up +3.6% overnight, showing relative strength compared to SPY.
* Price broke out of a descending wedge, now consolidating near upper channel resistance.
* Momentum is cooling after the strong overnight run, but structure remains bullish unless price loses 352 support.
Key Levels
* Resistance Zones (Upside Targets):
* 357.5–360 → Near-term rejection zone.
* 362.5 → 365.0 → GEX cluster + Call Wall resistance.
* 370.0 → Major Gamma Wall / Highest positive NET GEX.
* Support Zones (Downside Risk):
* 352.8–354.0 → Local breakout retest support.
* 343.8–345.0 → Strong structural support + previous demand zone.
* 335.0 → HVL anchor + Put hedge support.
Options Sentiment (GEX & IV)
* GEX: Balanced but slightly tilted bullish → Calls 49.4% vs Puts 3.5%.
* IVR: Low at 8.5, options are cheap → potential for strong directional move.
* Gamma Walls:
* 370 → Strong Call Wall (cap).
* 335 → Strong Put Support (floor).
This positioning suggests TSLA is “boxed” between 335 support vs 370 resistance, with intraday swings possible.
Indicators
* MACD (15m): Just made a bearish crossover after extended green histogram → short-term pullback risk.
* Stoch RSI: Rolling down from overbought → signals cooling momentum.
Scenarios for Today
Bullish Case (favored if 352 holds):
* Hold 352–354 support → reclaim 357.5.
* Targets: 362.5 → 365 test, with potential extension to 370 Gamma Wall.
Bearish Case (watch if 352 breaks):
* Lose 352 → retrace quickly to 345 zone.
* If heavy market weakness (SPY fails), could extend to 335 HVL.
Trading Thoughts
* Scalp Longs: Look for bounces near 352–354 support, aiming for 360+.
* Fade Shorts: If price rejects 357.5–360 zone without volume confirmation.
* Stops:
* Longs → below 352.
* Shorts → above 360.5.
Summary
TSLA remains stronge as long as 352 holds, bulls have room to test 360–365 and possibly squeeze toward 370. If 352 fails, expect a deeper retrace to 345–335. Options flow leans bullish, but intraday volatility is likely.
⚠️ This analysis is for educational purposes only, not financial advice. Manage risk and confirm with live price action before trading.

TESLA Under Pressure! SELL!
My dear followers,
This is my opinion on the TESLA next move:
The asset is approaching an important pivot point 350.79
Bias - Bearish
Safe Stop Loss - 354.45
Technical Indicators: Supper Trend generates a clear short signal while Pivot Point HL is currently determining the overall Bearish trend of the market.
Goal - 343.14
About Used Indicators:
For more efficient signals, super-trend is used in combination with other indicators like Pivot Points.
Disclosure: I am part of Trade Nation's Influencer program and receive a monthly fee for using their TradingView charts in my analysis.
———————————
WISH YOU ALL LUCK

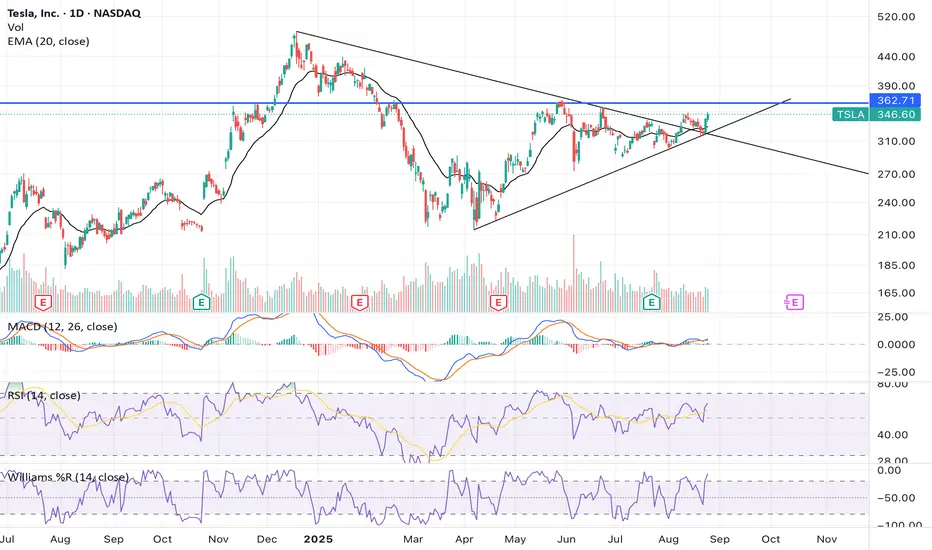
Tesla, it cant be this easy.Tesla is following the trendlines like a FINRA book would have you believe, which makes me suspicious. Just the same, dont fight whats in front of you. Should run into some resistance from 362ish. Stay nimble.
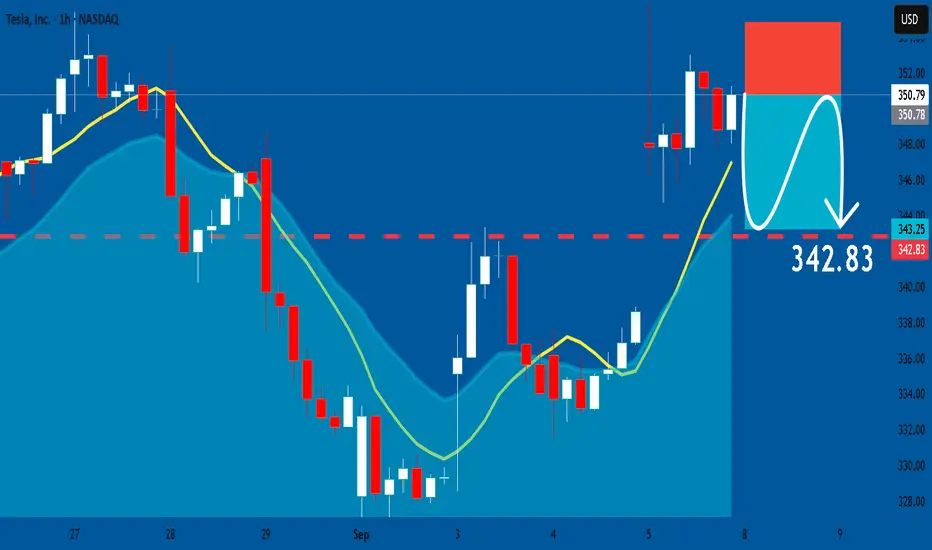
TESLA: Bearish Continuation & Short Signal
TESLA
- Classic bearish setup
- Our team expects bearish continuation
SUGGESTED TRADE:
Swing Trade
Short TESLA
Entry Point - 350.79
Stop Loss - 354.84
Take Profit - 342.83
Our Risk - 1%
Start protection of your profits from lower levels
Disclosure: I am part of Trade Nation's Influencer program and receive a monthly fee for using their TradingView charts in my analysis.
❤️ Please, support our work with like & comment! ❤️
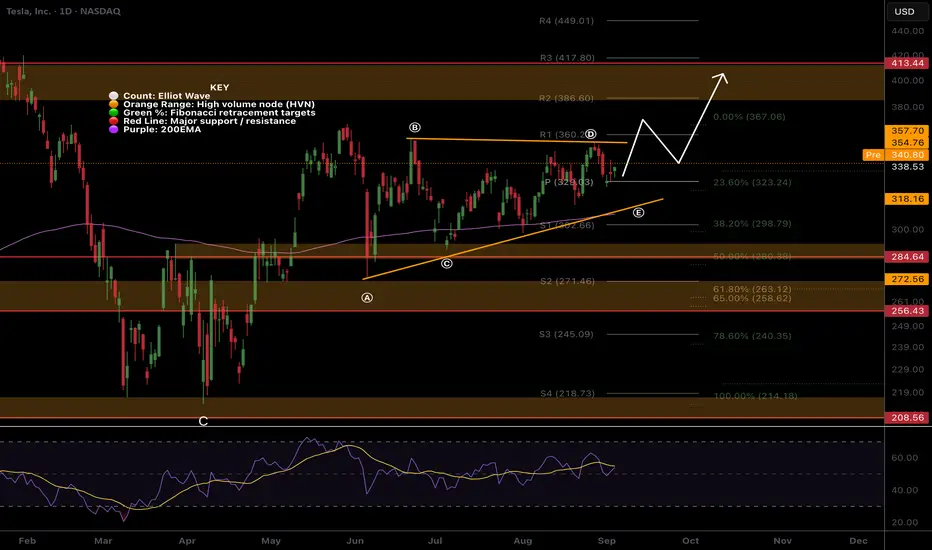
TSLA Creeping up from original triangle, but still in a larger tNASDAQ:TSLA continues to take the stairs of worry up to my trading signal target from the original triangle analysis, $386, but the pattern has morphed into what appears to be a barrier triangle now as price struggles at $360 with a series of higher lows.
RSI is comfortable at the EQ with room to grow while price remains above the daily pivot.
Analysis is invalidated below wave (C) $284
Safe trading
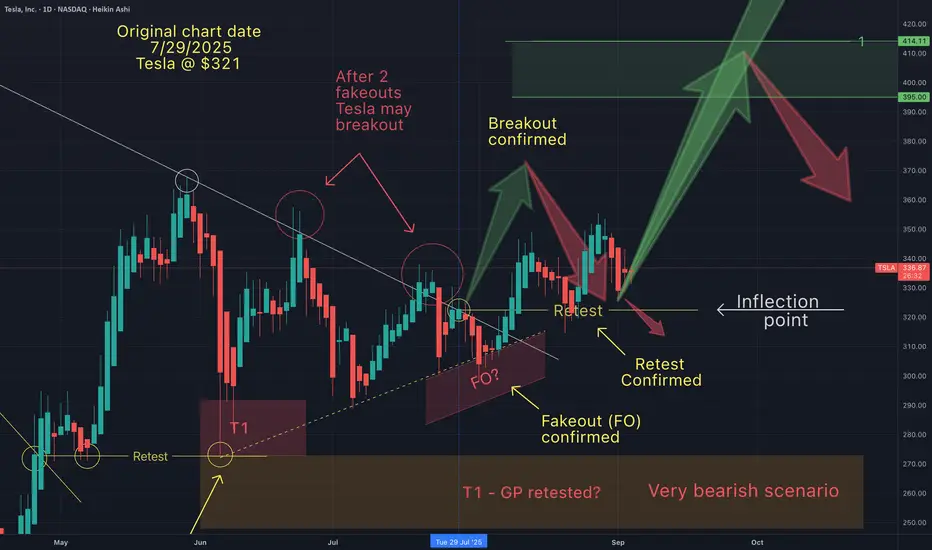
You will ask yourself, "how did he know Tesla would do that"?On July 29th I suggested that Tesla would drop into into my fakeout zone, followed by the usual "stop hunt-rise" and retrace (to test the breakout).
Once I saw 2 fake breakouts of trend, I expected this breakout to occur (after the fakeout). Once the breakout occurs, we always see the retest. The only question that remains is Tesla going to continue to follow the path outlined on my chart?
If Tesla does what it almost always does during this pattern, the answer is yes. There may be a quick liquidity grab below the breakout low, before continuing up towards my Bullish T1 target.
But keeping in mind, that Tesla is at an inflection point, I'm prepared for the possibility of a bearish scenario. Anticpating price action helps me quickly invalidate my trade ideas, so I can pivot accordingly. Therefore if Tesla holds resistance below $300, I expect a test of my bearish T2 target.
For now I remain cautiosly bullish until proven otherwise.
May the trends be with you.
We are not positive about TeslaFollow us and don't miss a next idea on Global Markets
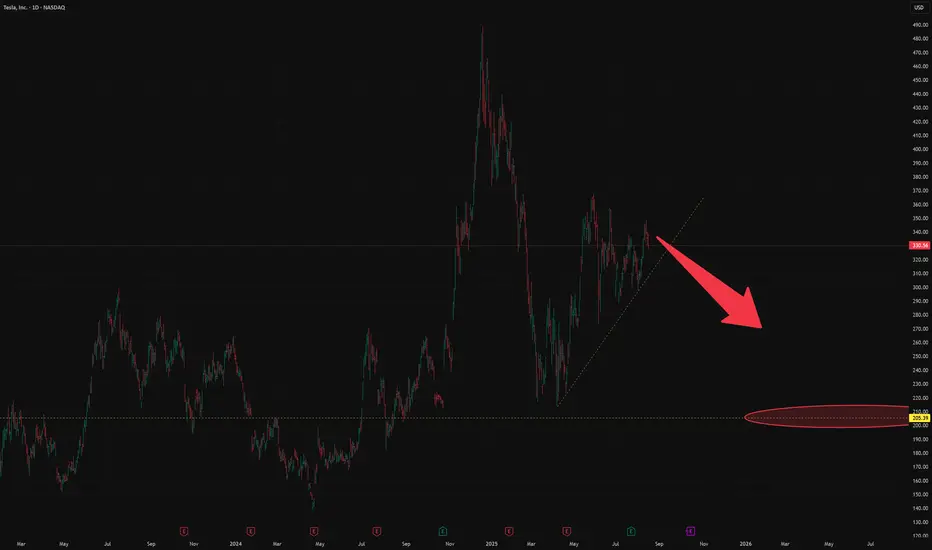
The impact of tariffs and expiring EV credits is expected to pressure future US deliveries and regulatory credit revenue in the near term
Elon Musk: Well, we're in this weird transition period where we will lose a lot of incentives in the US. Slab incentives actually in many other parts of the world. But we'll lose them in the US. Across all of it at the relatively early stages of autonomy. On the other hand, autonomy is most advanced and most available from a regulatory standpoint in the US. Does that mean we could have a few rough quarters? Yeah. We probably could have a few rough quarters. I'm not saying that we will, but we could. Q4, Q1, maybe Q2.
Revenue -12% y/y ( decline for the first time in 10 years)!!!
EPS 0,27 $ agj vs 0,39 $ estimated
FCF -89% y/y but still positive ( just 146 M$)
CAPEX for 2025 increased
EBITDA dropped by 7.8%.
Price to Sales 12,7
P/B 14
Expensive
We expect declining of the stock price to 210 $
And, yes, many still regard Tesla as a car manufacturer, but this is not a correct view of the company. Later in our blog we will touch on the question of how to correctly look at the brainchild of Elon Musk.
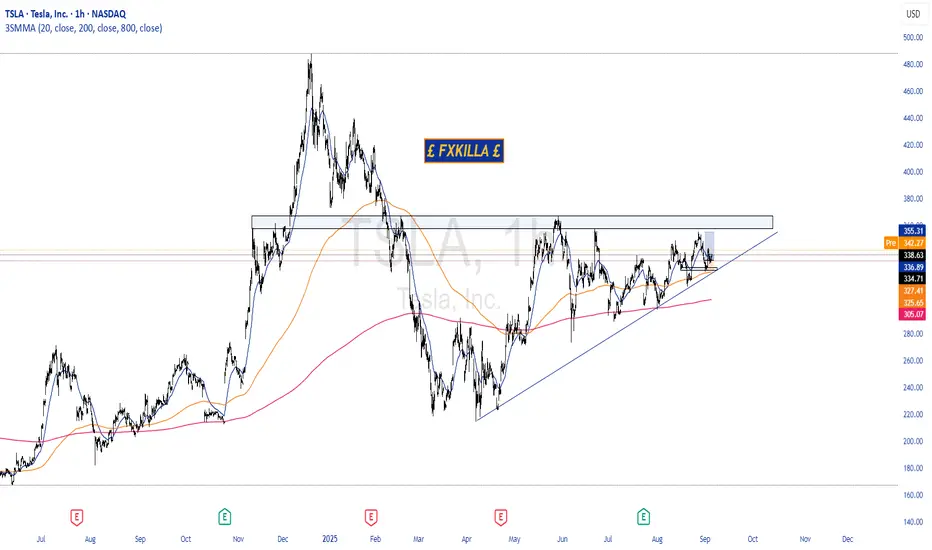
TESLA HIGH PROBABILITY SETUP SOON!!!🚨 TESLA HIGH PROBABILITY BUY SETUP 🚨
* Here We Can See Clearly The Next Potential Move For Tesla Coming Hours/Days.
* Keep Your Eyes Close On Your Trading Positions.
* Happy PIP Hunting Traders.
£ FXKILLA £
tesla sellToday play is a put this is going to be a sell based on the down trend as we can higher lows and lower lows
im doing puts around 325
I understand that gaps will happen but based on this chart
I'm only looking for today's prices
for a average buyer and sell I believe they can get cheaper price
in the long run
i know this is my option but i believe
q1 you buy
q2 you hold
q3 look to take profit or exit position
q4 look for set ups
i don't trades stocks as much just its so slow but that's me
have fun and enjoy the day

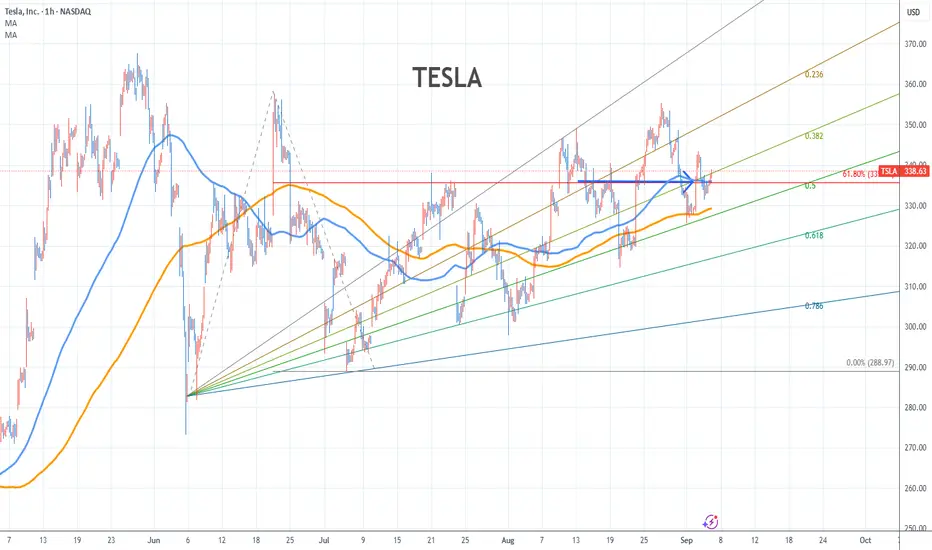
Tesla Stock Chart Fibonacci Analysis 090425Trading Idea
1) Find a FIBO slingshot
2) Check FIBO 61.80% level
3) Entry Point > 335/61.80%
Chart time frame:B
A) 15 min(1W-3M)
B) 1 hr(3M-6M)
C) 4 hr(6M-1year)
D) 1 day(1-3years)
Stock progress:A
A) Keep rising over 61.80% resistance
B) 61.80% resistance
C) 61.80% support
D) Hit the bottom
E) Hit the top
Stocks rise as they rise from support and fall from resistance. Our goal is to find a low support point and enter. It can be referred to as buying at the pullback point. The pullback point can be found with a Fibonacci extension of 61.80%. This is a step to find an entry-level position. 1) Find a triangle (Fibonacci Speed Fan Line) that connects the high (resistance) and low (support) points of the stock in progress, where it is continuously expressed as a Slingshot, 2) and create a Fibonacci extension level for the first rising wave from the start point of the slingshot pattern.
When the current price goes over the 61.80% level, that can be a good entry point, especially if the SMA 100 and 200 curves are gathered together at 61.80%, it is a very good entry point.
As a great help, TradingView provides these Fibonacci speed fan lines and extension levels with ease. So if you use the Fibonacci fan line, the extension level, and the SMA 100/200 curve well, you can find an entry point for the stock market. At least you have to enter at this low point to avoid trading failure, and if you are skilled at entering this low point, with the fibonacci6180 technique, your reading skill of to chart will be greatly improved.
If you want to do day trading, please set the time frame to 5 minutes or 15 minutes, and you will see many of the low points of rising stocks.
If you prefer long-term range trading, you can set the time frame to 1 hr or 1 day
TSLA – Daily Fib Continuation: Watch $350–355 for Break & Go (taTL;DR: TSLA is holding above the 0.5 retrace (~$334). A daily close above $355 opens $366 → $372 → $381. Lose $334 → $330 and the setup degrades toward $324/314.
Thesis
The prior swing’s Fibonacci map shows confluence at $350–355 (0.786/0.886 + round-number supply).
Structure is compressing above $334–335 support. A clean break/hold above $355 would likely trigger an extension leg to 1.272/1.414/1.618 at $366.7 / $372.5 / $381.0.
Below $334, momentum likely rotates back into the $330 → $324 → $314 demand ladder.
Key Levels
Support: $334.5 (0.5), $330.0 (0.382), $323.9 (0.236), $314.2 base
Trigger/Resistance: $347–350 (0.786–0.886), $355.5 (1.0)
Upside Targets: $366.7 (1.272) / $372.5 (1.414) / $381.0 (1.618) then $396.7 / $408.0 / $422.2 / $444.9
Trade Plan (alerts + confirmations, no auto-trading)
Scenario A – Break & Go (preferred)
Confirmation: Daily close above $355.
Execution: Drop to M15 for structure; take a retest of $350–355 as support.
M5 confirm: Bullish engulfing + MACD uptick.
Risk: Invalidation below $347 (or last M15 swing-low).
Targets: $366.7 → $372.5 → $381.0 (scale out).
Scenario B – Pullback Buy
Price tags $334–336 and holds (wicks rejection).
M15 forms HL; M5 prints engulfing + MACD cross.
Risk: Invalidation below $329.9.
Targets: $347 → $355 → $366.7.
Scenario C – Bearish Breakdown
Invalidation of bull idea: Full M15 body below $329.9 → look for $324 → $314. No longs until reclaimed.
Risk (keep it tight)
Risk %: 0.5–1% per idea.
Placement: Below invalidation or last M15 swing.
Scaling: 30/30/40 across targets; move stop to breakeven after Target 1.
What do you think about TSLA?!If it goes down it cannot be a small move. If it goes up it will be a common pattern (consolidation then breakout).
I think we well see it in two or three days!

HOW MUCH HIGHER CAN TESLA GO? (September 17, 2025)Since my last video Tesla stock is up over 25% in the past week and we are breaking a very key Fibonacci levels.
In this video, we look at a higher timeframe charts to determine if Tesla can keep pushing towards $600 and $1000 in the coming months ahead given how much it is outperforming everything else in the stock market

Bullish pennant pattern! This is what I'm looking at on the 2hr chart! It has finally broken out of this bullish pennant that was formed Monday, my price target now is somewhere 478/480 in the next few days! Will see ... this is NOT financial advice! Just sharing my personal analysis! That's all, Thanks!
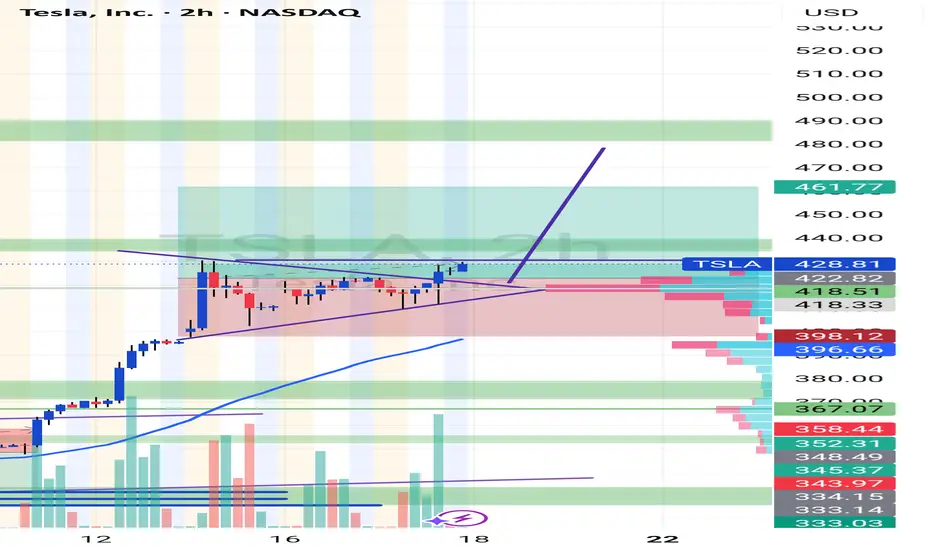
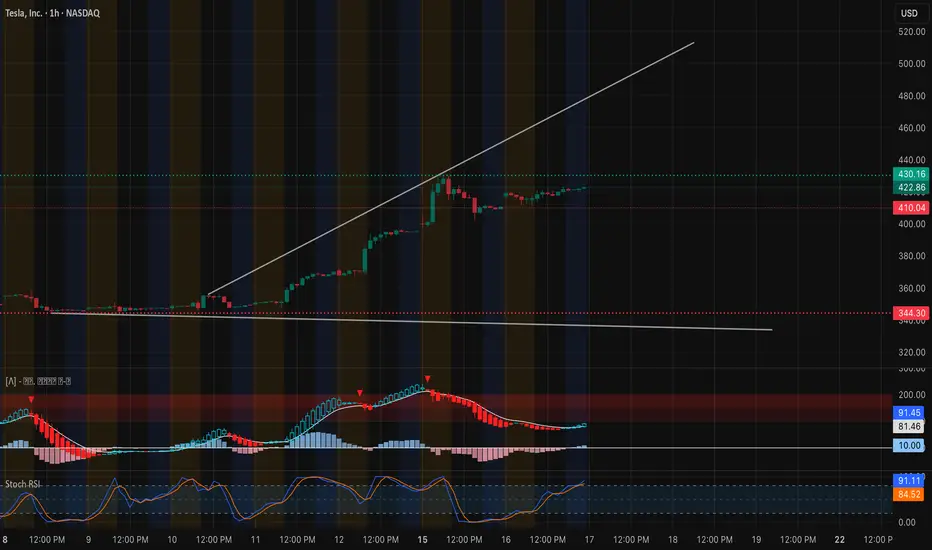
TSLA: Pausing at Key Zone – Swing & Scalp Setups for Sept 171-Hour Chart Technical View
Tesla’s rally from sub-$350 to the $420 area is now consolidating. After an explosive breakout on Sept 12–13, the 1-hour candles are moving sideways in a tight $410–$430 box. MACD has cooled from overbought and is starting to curl back up, while Stoch RSI is hovering in a neutral zone—showing that momentum is recharging, not reversing.
* Immediate Support: $410 (critical breakout retest)
* Major Support: $344 (key demand and high-volume node)
* Near-Term Resistance: $430–$440 (current supply zone)
* Upside Magnet: $450 and $484 if $440 clears with volume
EMA alignment (9 above 21) still favors the bulls, and price continues to respect the uptrend line from the early September pivot.
GEX & Options Flow
Options data underline strong bullish hedging pressure:
* Call Walls: $430 (2nd call wall), $440 (highest positive NET GEX / gamma resistance), $450 next target.
* Put Walls: $407.5 (1st defense), then $385 and $322.5.
* GEX Bias: Calls dominate with 92.8% call-weighted exposure. IVR at 20.1 (IVx ~65.9)
suggests decent option premiums but not extreme volatility pricing.
This configuration typically supports dip buying and favors upward grind, provided $410 stays intact.
Trade Thoughts & Suggestions
* Swing Idea: Accumulation on 1-hour closes above $410 with a stop below $400, aiming for $440–$450, and possibly $484 on continuation.
* Scalp Idea: Intraday traders can fade extremes inside the $410–$430 range, or take a momentum scalp if $430 breaks on strong volume.
* Bearish Scenario: A decisive break under $400 could unwind gamma support and invite a test of $385 and $344.
Quick Take
TSLA is digesting sharp gains in a healthy range. Strong call gamma at $430–$440 is both a near-term lid and a potential springboard. For Sept 17, look for continuation plays if $430 is taken out with conviction.
Disclaimer: This analysis is for educational purposes only and does not constitute financial advice. Always do your own research and manage risk before trading.
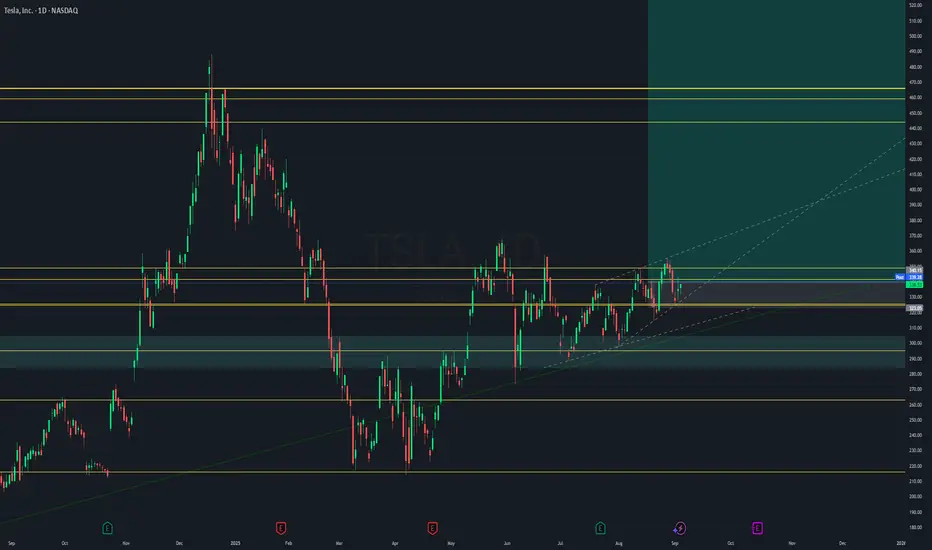
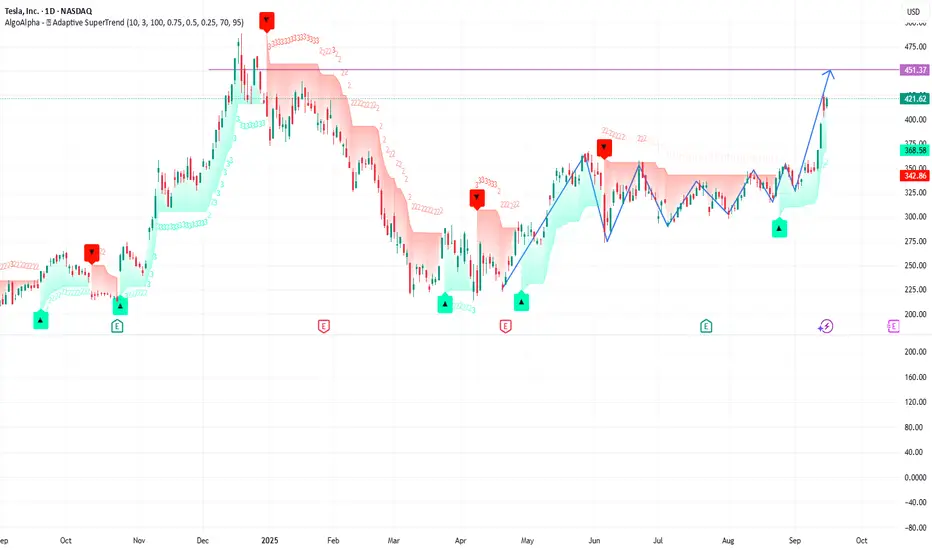
TSLA breaking out a rangeI think TSLA is moving up
The 1D timeframe show us how it was on a range and a few days ago started to go up
Next lvl should be 450, but also can go to 480
What do you think?
Bullish or bearish?
Do you see the bull flag?
Also the size and shape of candles remember me to a bullish movement.
When you see candlesticks all the day, everyday, you can see a pattern!
Lol
Yes, Elon Musk Buys $1 billion of Tesla Stock - $TSLAYes, Elon Musk bought approximately $1 billion worth of Tesla stock on September 15, 2025. We had a nice Fib retracement buy zone on this one around $214-$235 levels. We got in late ourselves and got in at $340. As a value play, this stock still trades at premium valuations, hovering near $410 per share with a trailing P/E above 200x—far higher than both traditional automakers and most growth tech peers.
Risks remain significant. Competition from Chinese rivals, ongoing price cuts that pressure vehicle margins, and regulatory challenges in key markets raise questions about how sustainable current profitability will be. For trading purposes, I would never short the stock, but buy oversold dips and swing trade it.
--------------------------------------------------------------------------------------
Disclaimer:
I do not provide personal investment advice and I am not a qualified licensed investment advisor. I am an amateur investor.
All information found here, including any ideas, opinions, views, predictions, forecasts, commentaries, suggestions, or stock picks, expressed or implied herein, are for informational, entertainment or educational purposes only and should not be construed as personal investment advice. While the information provided is believed to be accurate, it may include errors or inaccuracies. I will not and cannot be held liable for any actions you take as a result of anything you read here.
Conduct your own due diligence, or consult a licensed financial advisor or broker before making any and all investment decisions. Any investments, trades, speculations, or decisions made on the basis of any information found on here, expressed or implied herein, are committed at your own risk, financial or otherwise.
Feel free to give us a follow and shoot us a like for more analysis updates.

CUP AND HANDLE $TSLA TO $515 MINIMUMThe cup and handle is a bullish chart pattern commonly used by traders to spot potential buying opportunities. It features a rounded "cup" formation followed by a slight downward drift forming the "handle." This pattern typically signals a continuation of an upward trend once the handle completes its consolidation phase.
ROBOTAXI BOOM
BUY NOW NASDAQ:TSLL NASDAQ:TSLA
