XBI LongI like XBI as a swing trade here. This is a small cap proxy. With IWM at new ATHs I think XBI is ready to breakout. it's ready to overcome it's downward trendline (drawn from 21 highs).
110 first target. 125 second target.
Good luck. This is not financial advice.
Key stats
About SPDR S&P BIOTECH ETF
Home page
Inception date
Jan 31, 2006
Structure
Open-Ended Fund
Replication method
Physical
Dividend treatment
Distributes
Distribution tax treatment
Qualified dividends
Income tax type
Capital Gains
Max ST capital gains rate
39.60%
Max LT capital gains rate
20.00%
Primary advisor
SSgA Funds Management, Inc.
Distributor
State Street Corp. (Fund Distributor)
ISIN
US78464A8707
XBI provides exposure to US biotech stocks, as defined by GICS, from a universe that invests across the market-cap spectrum. The fund equal-weights its portfolio, which in turn emphasizes small- and micro-caps and greatly reduces single-name risk. Thus, the weighted-average market-cap is much smaller than some competitors. Unlike other funds in this segment, XBI is a pure biotech play, with relatively small pharma overlap. The index is rebalanced quarterly.
Related funds
Classification
What's in the fund
Exposure type
Health Technology
Stock breakdown by region
Top 10 holdings

Biotech Portfolio: Stocks and Long-Term GainsToday, I’ve prepared a topic on biotech portfolio construction, driven by our ongoing need to present clients with ideas offering substantial growth potential. This sector, centered on biotechnology and genetic engineering, stands out due to a significant rise in demand for innovative treatments, wi

$XBI Trade UpdateChannel Breakout
On September 3rd, AMEX:XBI broke out of its previously established, upward-trending channel. This movement was significant, as it marked a departure from the pattern that had been guiding its price action up until that point.
Current Price Action and Potential Setup
Since the bre

XBI eyes on $79.28: Golden Covid fib may mark the BioTech bottomXBI has been getting dumped since Trump and RFK
If biotech is to recover, it might start here and now.
Bulls need to hold or at least orbit this a few times.

XBI-SPY overlay unravels great bear?Undead Bear Captain's Log, Apr 7 2025:
Writing some observations due to a lurking feeling of something ominous about to happen:
Bizarre signs in the wind since mid-March, such as VVIX/VIX
Sudden downslide last week, almost unprecedented
Minimal put action - bear breathen all obliterated
Overlay

Opening (IRA): XBI May 16th -91C/October 17th 60C LCD*... for a 26.56 debit.
Comments: Back in to XBI on weakness, buying the back month 90 delta and selling the front month that pays for all of the extrinsic in the long. (The back month 60C is shown at the 80 so that it fits on the chart).
Metrics:
Buying Power Effect: 26.56
Break Even: 86.56
Max

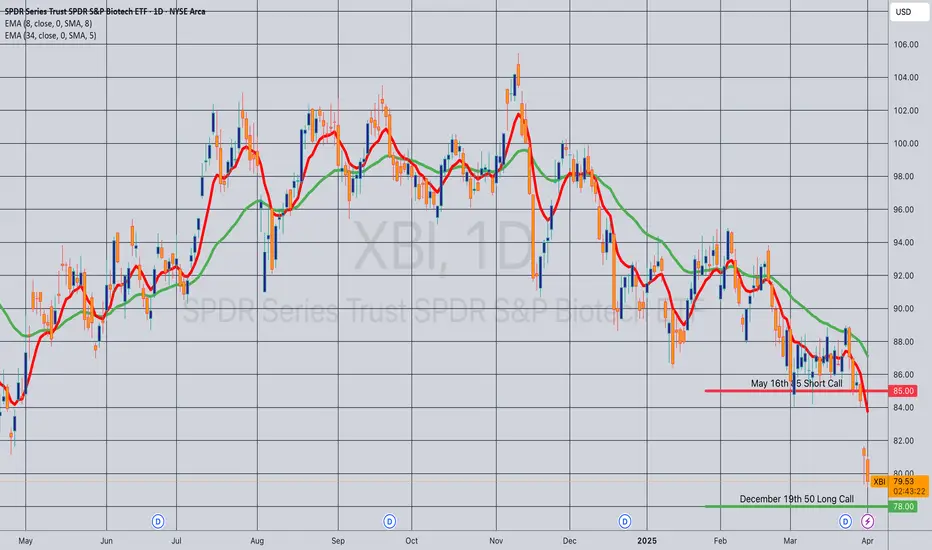
Opening (IRA): XBI May 16th -85C/December 19th 50C LCD*... for a 29.50 debit.
Comments: Adding to my XBI position at or near 52-week lows, buying the back month 90 delta and selling the front month -30 delta that pays for all of the extrinsic in the long. (The 50C is depicted at a higher strike so that it fits on the chart).
Metrics:
Buying Power E
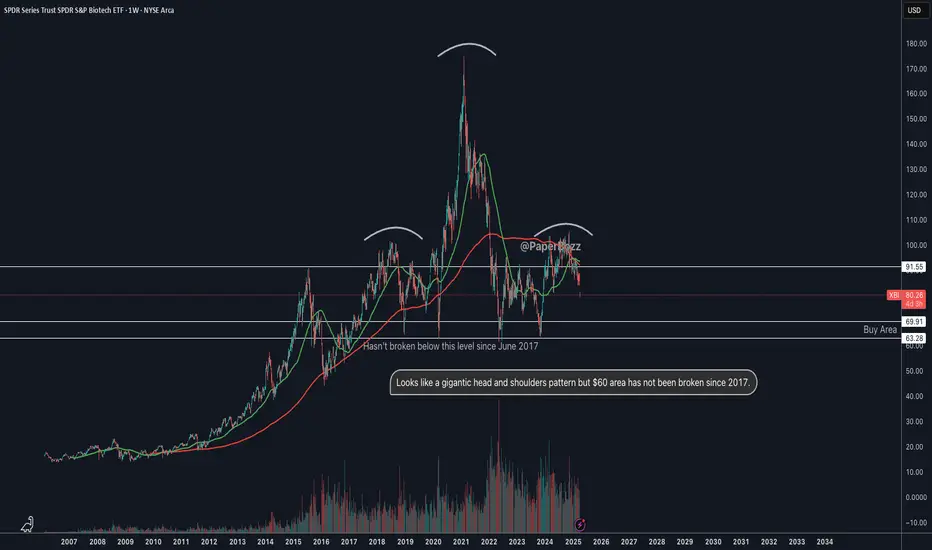
$XBI - Looks scary butAMEX:XBI looks like it is in the process of forming a gigantic head-and-shoulders pattern. However, the stock has not broken below the $60 level since 2017.
Opening (IRA): XBI Sept 19th 60C/April 17th -90C LCD*... for a 26.68 debit.
Comments: Taking a bullish assumption directional shot near 52 week lows, buying the 90 delta back month and selling a front month that pays for all the extrinsic in the long, resulting in a break even that is at or below where the underlying is currently trading. The 60 lo

XBI monthly head and shoulders?Anyone else seeing a head and shoulders pattern in XBI on the monthly?

See all ideas
Displays a symbol's price movements over previous years to identify recurring trends.
Frequently Asked Questions
An exchange-traded fund (ETF) is a collection of assets (stocks, bonds, commodities, etc.) that track an underlying index and can be bought on an exchange like individual stocks.
SSGF assets under management is 4.71 B EUR. AUM is an important metric as it reflects the fund's size and can serve as a gauge of how successful the fund is in attracting investors, which, in its turn, can influence decision-making.
Since ETFs work like an individual stock, they can be bought and sold on exchanges (e.g. NASDAQ, NYSE, EURONEXT). As it happens with stocks, you need to select a brokerage to access trading. Explore our list of available brokers to find the one to help execute your strategies. Don't forget to do your research before getting to trading. Explore ETFs metrics in our ETF screener to find a reliable opportunity.
SSGF invests in stocks. See more details in our Analysis section.
SSGF expense ratio is 0.35%. It's an important metric for helping traders understand the fund's operating costs relative to assets and how expensive it would be to hold the fund.
No, SSGF isn't leveraged, meaning it doesn't use borrowings or financial derivatives to magnify the performance of the underlying assets or index it follows.
Yes, SSGF pays dividends to its holders with the dividend yield of 0.04%.
SSGF shares are issued by State Street Corp.
SSGF follows the S&P Biotechnology Select Industry. ETFs usually track some benchmark seeking to replicate its performance and guide asset selection and objectives.
The fund started trading on Jan 31, 2006.
The fund's management style is passive, meaning it's aiming to replicate the performance of the underlying index by holding assets in the same proportions as the index. The goal is to match the index's returns.