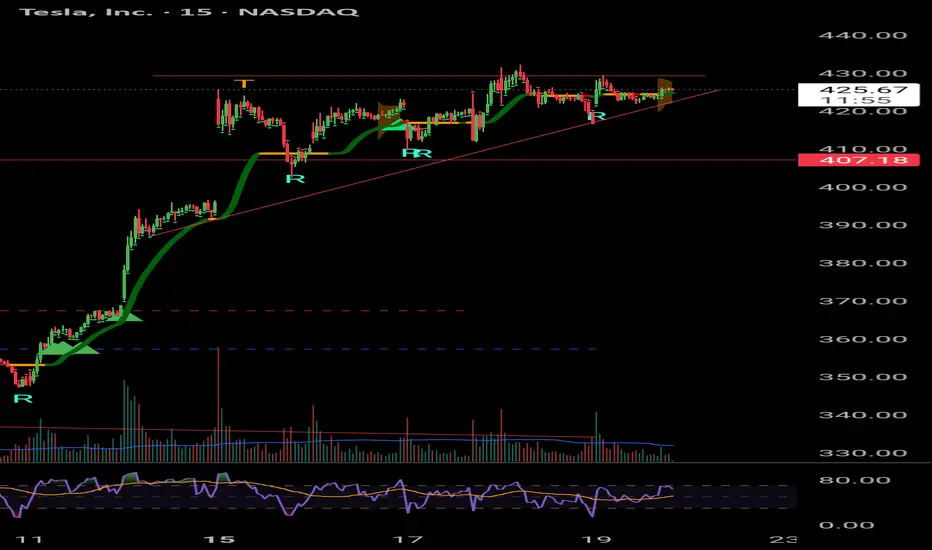
Tesla - SHOW ME THE CHART AND I WILL TELL YOU THE NEWS!Back in June and July, Elon and Tesla were STILL getting a lot of bad press (Elon fighting with President Trump, people burning Tesla cars etc). Those that follow me may recall on July 29th I wrote the following:
"Tesla just needs a narrative shift (ie -new invention etc), & price action changes in a heart beat.
Yet, price action really has less to do with the news making Elon a hero, then a villain and then back and forth...but moreso to do with price action patterns that just keep repeating".
And you'll note that my July chart suggested that the huge pump to $400+ would begin around Sept 1st (Huge green arrow after the retest). What a coincidence that 2 weeks later Elon announces a $1Billion dollar Tesla stock buy (the new anticipated "narrative"). My huge green arrow was there many weeks before this "news". How could I have known?
SHOW ME THE CHART AND I WILL TELL YOU THE NEWS.
On July 29th Tesla was $321 and I suggested that Tesla was about to have a major breakout to at least $400 "with no major retraces". That target has now been hit. Is it because of the news or is it the patterns that just keep repeating?
My T1 targets are probable targets, so I anticipate them almost always getting hit. My ideal buy and sell targets are T2. Tesla now appears to be headed into my T2 target, so it's time to start monitoring price action closely.
TL0 trade ideas

Tesla's New Range. Hello I am the Cafe Trader.
Today we are revisiting Tesla (TSLA).
Last article we identified the Key seller before this big extension. Today I have identified the last key seller, and how you can capitalize.
Price has now entered into the Light Supply Zone , a place where sellers will try to slow things down.
It is likely that you will want to play TSLA at the Extremes. Strong Supply , and Strong Demand levels are going to give you the best chance at a stronger reaction. So if you are playing the short term, These two plays marked on the chart will be your best bet.
If the Strong Buyers hold at around 417, This will put a lot of pressure on that last strong seller at 461. A push through them should see you ATH's (not without a strong reaction from the Strong Supply first).
Missed out on the move and want to add TSLA to your long term?
Long Term
These Prices should match your conviction on TSLA:
Aggressive : 409 - 419.50 (Top of Demand, even better if you get into those strong buyers)
Value : 333-344
Extreme Value : 288-294 or the Conservative Trendline.
Expect big things from TSLA in the coming years. I would not be surprised to see TSLA reach over 1,000 again.
Happy Trading,
@thecafetrader

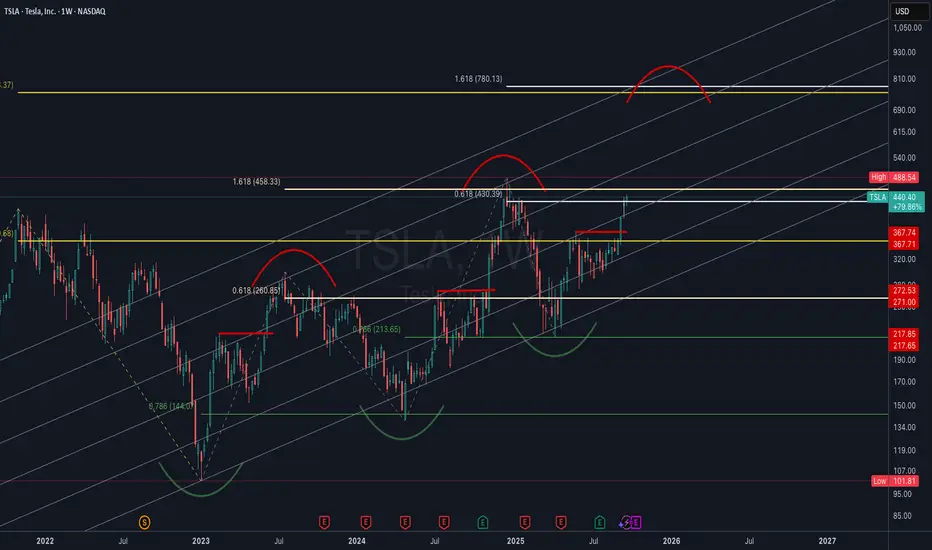
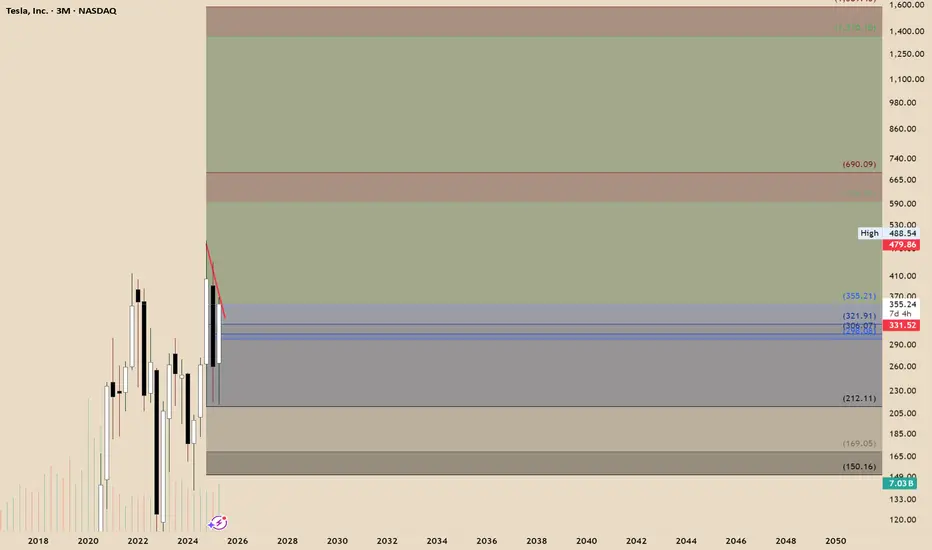
TSLA Weekly | Log Channel Analysis with Fibonacci ConfluenceThis chart presents Tesla (TSLA) on the weekly timeframe, plotted in logarithmic scale using a custom trend channel (not a pitchfork). The analysis combines price structure with key Fibonacci retracement and extension levels to highlight major inflection points in Tesla’s long-term trend.
Channel Structure: The log channel has consistently guided price swings, showing respect for both upper and lower boundaries across multiple cycles. This provides a framework for projecting potential tops and bottoms.
Fibonacci Confluence:
• Price is currently reacting around the 0.618 retracement ($430) from the previous major swing, a historically significant level for Tesla.
• Upside targets align with the 1.618 extensions ($753–$780), creating a strong confluence zone for a potential long-term resistance.
• Key downside supports sit at $367, $272, and $218, each coinciding with fib retracements and historical pivot zones.
Market Structure: The chart highlights repeating rounded top and bottom formations, suggesting cyclical behavior in Tesla’s price action. Rounded bottoms have historically marked accumulation zones, while rounded tops have aligned with distribution phases.
Current Outlook: After reclaiming the mid-channel region and pushing through significant resistance, Tesla is now at a pivotal stage. A confirmed breakout above $488 could open the path toward the higher channel range and eventual fib targets. Failure to hold $430, however, risks a retrace back to $367 or lower channel support.
I know you dont like me but..but... the whole universe is a huge fractal. Repetition inside a repetition repeated over time. Trading and investing is not far away from philosophy.
Look ar my BTC fractal prediction. its simple on point week by week.
Not an investment advice. Go to meditate.
Elon rules.

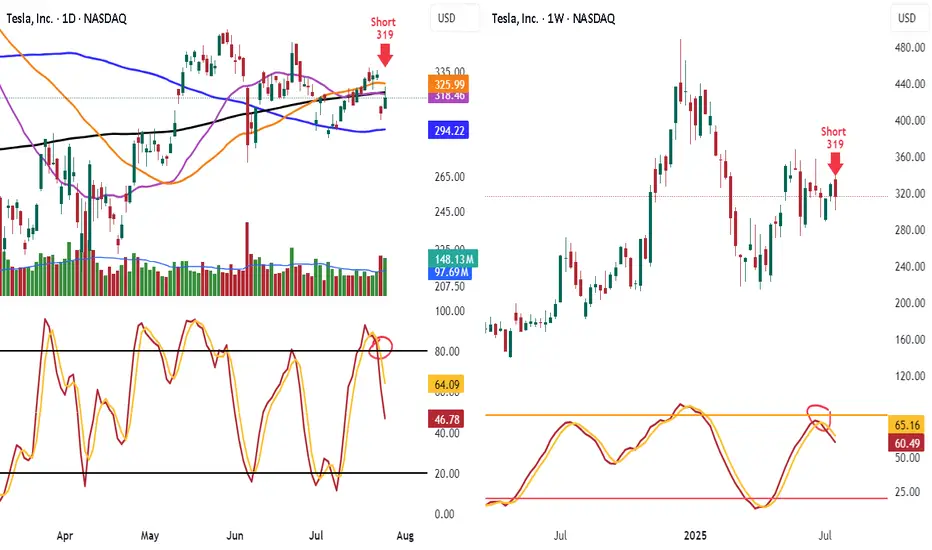
Shorted TSLA 319 Look at TSLA hit 50 day and 200 day MA and failed and know under them
Look at the lower highs and see the stoch heading down
Know lets look weekly stoch heading down and lower highs
Target is 100 day ma 294.22 take some off. When it breaks will add back on
Have trailing stop in place
$TSLA ATH BREAK SOONTons of NASDAQ:TSLA otm puts were sold at the open today.
$5.6 million 370p 10/31
$6.1 million 430p 10/3
$5 million 370p 11/21
$5.2 million 370p 11/21
Also otm calls were bought
$8.5 million 550c 11/21
$3.3 million 500c 11/21

$TSLA broke down today on the 15-minute chart.NASDAQ:TSLA broke down today on the 15-minute chart.
Not with fireworks, but with precision — the type of move that punishes late longs and rewards those who prepared.
The truth? It’s never about guessing the direction.
It’s about setting the framework before the bell: pre-market levels mapped, risk defined, noise filtered.
When the signal confirms, you don’t hesitate. You execute.
Most of the time, the market whispers.
Sometimes, it shouts.
Your edge is built in the quiet hours, so when the move comes, you’re already positioned.
Cut losers fast.
Let winners breathe.
Keep showing up until probability pays you.
TESLA Set To Fall! SELL!
My dear friends,
TESLA looks like it will make a good move, and here are the details:
The market is trading on 440.30 pivot level.
Bias - Bearish
Technical Indicators: Supper Trend generates a clear short signal while Pivot Point HL is currently determining the overall Bearish trend of the market.
Goal - 432.72
Recommended Stop Loss - 444.15
About Used Indicators:
Pivot points are a great way to identify areas of support and resistance, but they work best when combined with other kinds of technical analysis
Disclosure: I am part of Trade Nation's Influencer program and receive a monthly fee for using their TradingView charts in my analysis.
———————————
WISH YOU ALL LUCK

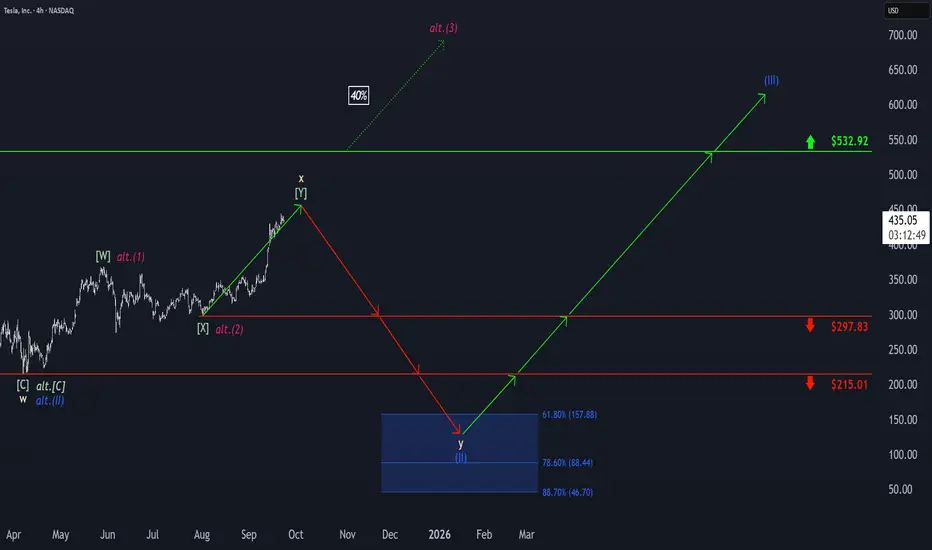
Tesla: Upward Momentum PersistsTesla’s upward momentum has persisted, with the beige wave x still having some room to run. However, we expect the corrective top to form well below resistance at $532.92, which should then trigger the final selling phase within the broader correction. Ultimately, wave y is projected to approach our blue Target Zone between $157.88 and $46.70, completing the large blue wave (II) in that range. Afterward, we anticipate a new wave (III) uptrend. That said, there remains a 40% probability that price may not reach the blue zone, as wave alt.(II) could have already completed at $215.01. In this scenario, TSLA would already be developing a magenta upward impulse and could break above the $532.92 level directly and sustainably.
Tesla: Robotaxi Hype and Breakout WatchNASDAQ:TSLA surged nearly +10% today, driven by growing anticipation around the upcoming robotaxi unveiling on August 8.
Investors are positioning early, speculating this innovation could open new revenue streams for Tesla and redefine mobility.
📊 Technical Setup:
• Price broke out of local resistance near $330
• Approaching major resistance at $370–371 (Bollinger Band + prior support)
• If $370 is broken and held, the stock could enter a new trading range: $370–$440
• RSI and Stochastic are heating up, but no signs of reversal yet
⚙️ Robotaxi Catalyst:
• Elon Musk confirmed the Robotaxi event set for August 8
• Analysts speculate this could boost valuation through AI and self-driving revenue potential
• Option volume and retail interest are rising fast
📌 Levels to watch:
• Breakout level: $370
• Target: $440
• Support zone: $330
• Invalidation: Close below $310
👀 Watch for pre-event momentum. A break above $370 could trigger a squeeze.

Long trade Trade Journal Entry
Pair/Asset: TSLA (Tesla Inc.)
Trade Type: Buyside trade
Date: Friday, 26th Sept 2025
Session: London to New York Session AM (11:00 AM)
Trade Details
Entry: 427.51
Profit Level (TP): 465.20 (+8.82%)
Stop Level (SL): 425.82 (-0.40%)
Risk–Reward (RR): 22.3
Technical Narrative
Pre-Trade Context:
The price consolidated above a demand zone at 423–427, which coincided with the origin of a prior order block. Inducement & BOS (Break of Structure) confirmed bullish intent.
Several fair value gaps (FVGs) were present on the climb, supporting bullish continuation.
Entry Justification:
*Entry at 427.51 aligns with the mitigation of the demand zone and FVG fill.
*The structure flipped bullish after the sweep of local lows, setting the stage for an upside liquidity grab.
Target Rationale:
*TP aimed at 465.20, aligning with the previous swing high and liquidity above.
*Clean imbalances left on the rally offer magnets for price.
Risk Management:
Tight SL at 425.82, just below the demand origin to invalidate trade if broken.
Observations & Notes
The accumulation structure within demand was well-formed before the breakout.
Entry captured an early move with FVG alignment + inducement sweep.
Monitor for potential rejection near 448.96 (intermediate resistance) before TP.

TeslaIf you recall, last week I mentioned that I think Tesla gives us another high before it is all said and done. That would complete what I am calling an ED to finally finish off intermediate wave (B). Currently, price is trading @ $434.32 in the overnights according to Robinhood. This creates the new high I was looking for, and if correct, would conclude this move higher. Also, if this is an ED, then once it finally completes, it will move swiftly towards the $400-$405 area as that is where it started. That move lower would be considered the start of wave (C) and would either be wave a, or the start of wave 1.
In short, I believe the high we got in the overnights should be the last leg of this move higher. Rather it finishes tomorrow or sometime in the upcoming week, I do believe this move higher is finally coming to an end. If this is correct, it would be a good area to short the stock...with stops of course.
The ALT that I am watching for is that this high we're getting now in the overnights is just the last leg of micro-wave 3 with 4 & 5 yet to come. The strength in which it moves lower after completion will answer that question for us. A swift move to the above-mentioned price level = completion. A choppy lackadaisical move lower would likely mean the turquoise count is coming to fruition.

looks more like a breakdown than a breakthroughWith exhausting consolidation, overbought levels at their peak, looks to test 370. Another breakthrough would have bought in 450-500 but it is too early to significantly continue to push without any discourse.
TESLA Wave Analysis – 24 September 2025
- TESLA rising inside impulse wave iii
- Likely to reach resistance level 460.00
TESLA has been rising in the last few trading sessions inside the sharp upward impulse wave iii – which belongs to the intermediate impulse wave C from June.
The price earlier broke above the round resistance level 400.00 - which strengthened the bullish pressure on TESLA.
Given the clear daily uptrend, TESLA can be expected to rise further in the active impulse wave iii toward the next resistance level 460.00 (target price for the completion of the active impulse wave iii).
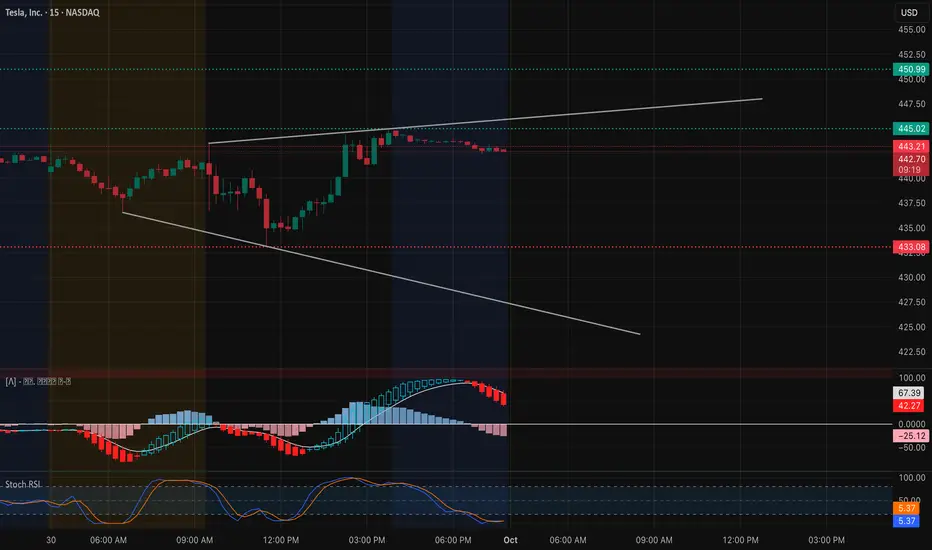
TSLA Oct. 1 – Eyeing the $450 Breakout Zone! 🚀Intraday View (15-Min Chart)
TSLA rebounded sharply intraday and is now consolidating around $443–$444 just under key resistance. Price action has formed a rising channel, but momentum is stalling.
* Support Levels: $442.20, $438.60, $433.08
* Resistance Levels: $445.00, $450.99, $452.50
* Indicators: MACD histogram rolling red, showing fading momentum. Stoch RSI sitting low, suggesting room for a relief bounce.
📌 Intraday Thought (Oct. 1): If $442 holds, expect attempts to push into $445–$450. A breakdown below $442 could trigger a move back toward $438 and $433. Scalpers can play long near $442 support with tight risk, or fade $450 resistance if tested and rejected.
Options & Swing View (1H + GEX)
Gamma exposure shows critical levels:
* Upside: Heavy call wall at $450–$452.5, with more stacked toward $465–$470.
* Downside: Strong put support near $432–$425, deeper wall at $417.5.
This suggests TSLA is coiling between $432–$450. A breakout over $450 could ignite momentum into $465–$470, while losing $432 risks a slide back to $425.
* Bullish Play (Oct. 1): Calls or debit spreads targeting $450 → $465 if price breaks $445 with volume.
* Bearish Hedge: Puts toward $432 → $425 if $442 breaks down.
* Neutral Play: Iron condor between $432–$452 to capture premium during consolidation.
My Thoughts (Oct. 1)
TSLA is parked right below a heavy $450 gamma wall. If bulls clear $445 and sustain, we could see an explosive push toward $465+. But failure to hold $442 opens the door to retesting $432 quickly. For now, this is a make-or-break level, and I’d keep risk management tight with options plays centered around the $450 breakout.
Disclaimer: This analysis is for educational purposes only and does not constitute financial advice. Always do your own research and manage risk before trading.
what is market needs ?market need a huge money to move < money will pass in market pocket to pocket.
each move is not same profit for them they also does not know how much they can earn so to minimize their loss they go for test .in test they have a pool we call it range/side. they feed small institute. they will help them with hedge funds in sharp move /.
when you want to trade . trust in just one trend do not trade by whole moves .

A Bullish Long-Term Outlook Tesla continues to present a compelling case for long-term investors, underpinned by its innovation-led growth trajectory and emerging dominance in autonomous mobility. Technically, recent market structure reveals an imbalance within a quarterly bullish breaker, suggesting further price expansion. If macroeconomic conditions remain favorable, the next algorithmic target zones fall between $594 and $690, signaling potential upside.
On the fundamental front, Tesla’s recent moves—particularly its rollout of the robotaxi network—have ignited fresh investor optimism. Analysts now estimate that autonomous driving could account for a substantial portion of Tesla’s future valuation, with some long-range forecasts placing the stock above $2,000 within the next several years.
While short-term pressures such as softening EV demand and regulatory barriers persist, Tesla’s consistent execution on AI-driven mobility may unlock new valuation territory.
$TSLA: Breakout Wave Dimensions🏛️ Research Notes
Apart from known compression patterns for Tesla, there is another squeeze happening on smaller scale:
That area will be processed to derive the chart-based levels and see how market reacts to them.
Triangle
Breakout Expansion

TSLA looking for rejection around 200HMASo, I've been bearish on TSLA around that $400 mark and was waiting for more PA to evolve before calling the shots. It broke down. Quite rapidly actually. Currently looking to see what happens when price floats around that 200HMA in red. Also looking at weekly RSI that broke down the centre of the channel. If RSI on weekly cannot reclaim above centra at 50 and price has a hard time returning above 200HMA, I'll be looking for another leg down on HTF. I'm looking at weekly timeframe here so be mindful about that. I'm fluid. For me, price doesn't have to get a clean rejection for me to make up my mind. Although, that would make life easier, I'll also look at how price behaves around a certain price level. What I mean by that is: I don't care whether the price will go higher than that 200HMA in daily candles. I care about weekly closes and formations around that area.

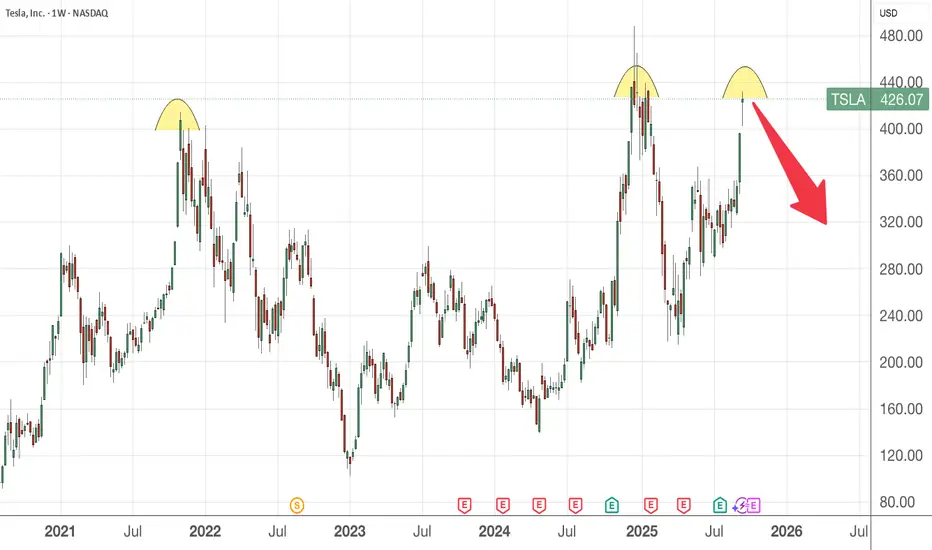
Is it time for TSLA to come down?First thing first, I do not own nor trade this stock. So do take it with a pinch of salt.
From the weekly chart, it seems to display a triple top formation which is bearish in nature. However, market is irrational and though it is highly overvalued, it could still continue to rally if the demand from buyers is there.
SL above 480 and aim for profit target at 299
Tesla, BearishIf the price breaks the 15m Low .. Then i boldly hold a sell after the retest
... Anyways , Happi Trading

TSLA: Mild Pullback but Uptrend Remains IntactHello everyone,
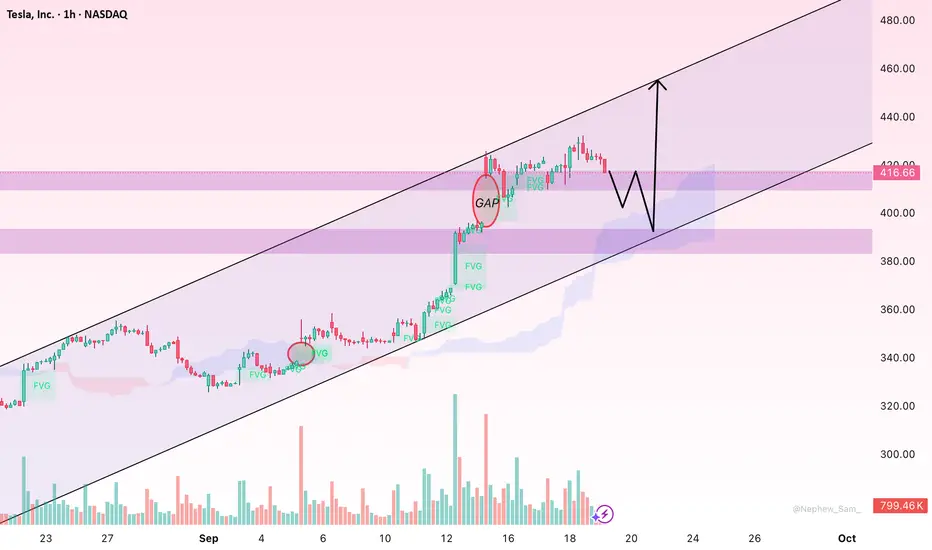
Tesla’s share price (TSLA) slipped slightly today, closing at 416.66 USD, down 5.78 USD or 1.37% compared to the previous session’s high. After a strong rally earlier, the market is now watching closely to see whether Tesla can sustain its upward momentum or enter a deeper correction.
The main driver of this dip has been profit-taking after the stock approached the 430 USD level, creating selling pressure. Alongside this, Tesla’s prior upward moves have left several Fair Value Gaps (FVGs), which may serve as support zones if price revisits them, helping traders identify potential entry levels. In addition, trading volume has picked up significantly in recent sessions, showing strong inflows and active participation from major investors.
Looking ahead, despite the current mild pullback, Tesla shares are expected to extend their uptrend if they can hold above the 416 USD support. This is a crucial threshold—if it holds, price could revisit 430 USD and potentially move toward 440 USD in upcoming sessions.
The reasoning lies in the sustained capital inflows, the supportive role of FVG zones, and the Ichimoku cloud structure, which continues to back the bullish trend as long as price stays above it.
So, what’s your view? Will Tesla keep pushing higher toward 430–440 USD, or is a deeper retracement likely?
Is this bullish enough for you? If elon is buying, I am buying. If he is gonna get trillion, I want my pie too. Help each other.
Not a trading analysis, just a fan.