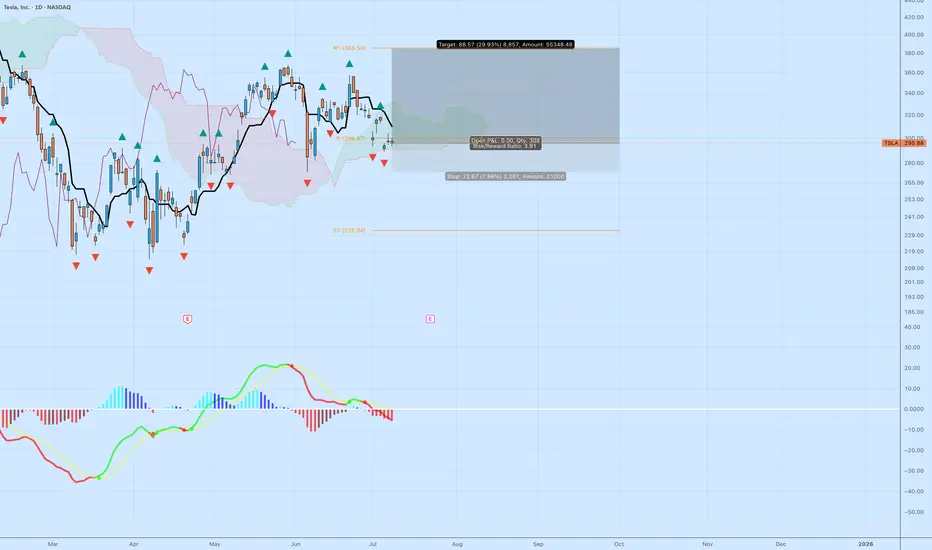
TSLA: High R/R Bounce Play Off the Cloud EdgeTesla NASDAQ:TSLA is sitting at a decision point — testing the edge of the Ichimoku cloud while momentum resets. The setup isn’t confirmed, but the risk/reward is compelling for those watching structure.
🔍 Technical Breakdown
Cloud Support: Price is holding right at the top of the cloud. A breakdown would signal trend weakness, but for now, it's a potential bounce zone.
MACD: Momentum has cooled off, but no bullish crossover yet. Early signs of a flattening histogram could suggest a pivot.
Structure: Horizontal support near $292–295 has held multiple times. If this zone holds again, the upside target opens up quickly.
🎯 Trade Specs
Entry: $296.88
Target: $385.50 (+29.93%)
Stop: $274.21 (–7.66%)
Risk/Reward: 3.91 — solid asymmetry
💡 Trading Insight:
This isn’t about calling bottoms — it’s about defining risk. When price compresses at known support, and you’ve got a 3.9 R/R profile, you don’t need to be right often to be profitable.
TL0 trade ideas
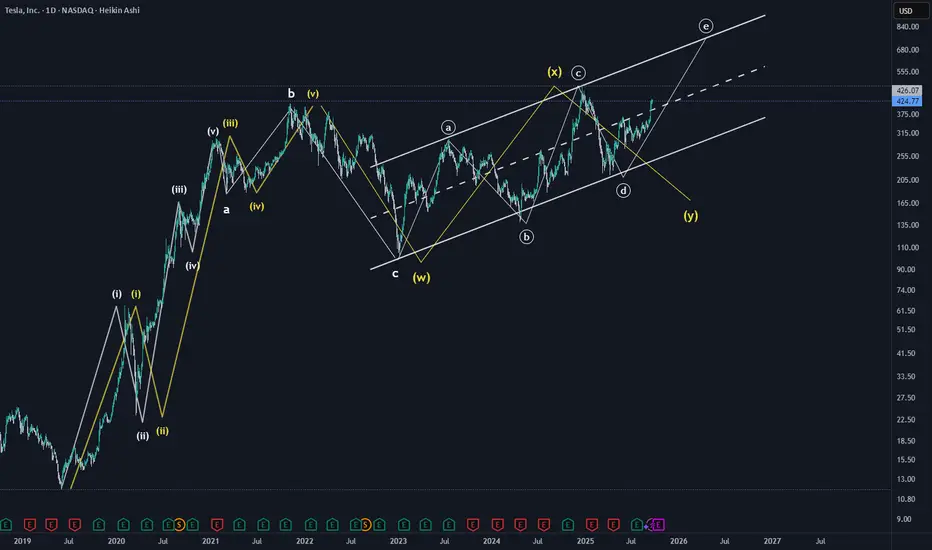
Bullish and Bearish Macro wave patternsThis chart provides a bullish and bearish wave pattern for Tesla. Even though the recent move was very impulsive, both bullish and bearish scenarios are equally possible. This is because the impulsive move seems to be wave C of either X wave or ending diagonal (E of ABCDE).
White represents Bullish scenario and Yellow represents bearish scenario.
Minimum Target reached for the C wave.
Note
**Disclaimer** : All details shared here is for educational purpose only. Please do your own research and consider appropriate risk management before making short term or long-term investment decisions.
Approach Market always with probabilities and make sure risk management in place.
Request your support by like, comment and follow
Ok TSLA.... holding or pullback?TSLA rocked & today it printed a dark cloud candle. Pullback perhaps?
Tesla typically can rally when things look bleak for the rest of the market. However, after that billion dollar move up, maybe we have a pull back before earnings. Or will we range?
<420/420 maybe retest the gap?
That's what I'm looking for.

TSLA Breakout Watch for Sept 18 – Bulls Testing Key Supply LevelHere’s my fresh read on Tesla heading into Wednesday’s session
1️⃣ Market Structure & Price Action
* Clean breakout attempt: TSLA pierced the descending trendline drawn from last week’s highs and closed around $429, holding above the 9 EMA and reclaiming short-term momentum.
* Support shelf: $421–422 zone (prior supply) flipped to support. This is the first line of defense on any early dip.
* Upside pivot: Price is grinding along an ascending intraday trendline that points toward the $435–440 area if momentum keeps up.
2️⃣ GEX (Options Flow) Insight
* Call dominance: Call flow is heavy with ~90% call premium, IVR ~19.6 (low), and IVx ~65.3 (normalizing).
* Big call walls: $432.5 and $436 show strong gamma with 67%+ call concentration, which can attract price if bulls stay in charge.
* Put defense: Major put support sits at $412–417.5. A break below $412 would flip sentiment and invite a fast move to $400.
3️⃣ Trade Thoughts
* Bullish swing / scalp: Buy pullbacks into $423–426 with a stop under $421. Targets $435, stretch $440+.
* Bearish fade: Only if TSLA loses $421 and the hourly closes below it. First target $409, extended $400.
4️⃣ Option Angle
* With call interest stacked and IV still moderate, short-dated call spreads or debit spreads around $430/$440 look attractive for a measured upside shot.
* Aggressive traders could sell puts below $410 for premium, but that’s only if you’re comfortable owning shares on a breakdown.
5️⃣ Personal Take
I like the constructive action. Tesla cleared a multi-day squeeze and is running with the broader tech bid. As long as $421 holds, the path of least resistance is up. I’m watching volume on any morning retest—if buyers show up, I’ll lean long.
Disclaimer: This commentary is for educational discussion only and not financial advice. Always do your own research and manage risk before trading.

My Journey to Building the Adaptive Opening EdgeMy Journey to Building the Adaptive Opening Edge
Like many of you aspiring traders, I was once chasing shortcuts.
I wanted to get rich quick, to find the easiest way out.
Over 10 years ago, I first learned about trading through my mom. I got curious, started exploring, and went on a hunt for the “holy grail.” The history is always the same — I blew up account after account before I finally turned profitable.
The Missing Puzzle
I realized the key wasn’t some secret indicator or magic formula. It was me.
I needed to work on my fundamentals, my psychology, and my discipline.
At the same time, I felt there was a gap in the market — no tool truly fit the trading philosophy I was developing. I wasn’t looking for certainty; I wanted a way to stack probabilities and build expectancy.
Building the Signal
So I invested in myself.
📚 I spent hours in libraries.
💻 I learned coding and logic.
🧩 I started piecing together the type of tool I wished existed.
That’s how the Adaptive Opening Edge was born.
It wasn’t about predicting the future. It was about building a system that:
Risks a fixed % per trade
Avoids overnight risk entirely
Is robust (not overfit, not curve-fitted)
Focuses on expectancy, not win rate
From Testing to Trading
I backtested, forward tested, and finally went live.
I fine-tuned the code, but never broke its logic to “force” more wins. I needed it to be durable — able to handle randomness without collapsing.
For the first time in my trading career, I saw an equity curve I could trust.
The Real Breakthrough
The breakthrough wasn’t just the signal.
It was the combination of:
A robust tool (Adaptive Opening Edge)
The discipline to follow rules without deviation
The patience to let the law of large numbers play out
Trading stopped being about outcome.
It became about process.
Losses stopped hurting — they were just part of the data. Wins stopped exciting me — they were simply the advance payments of my expectancy.
Where I Am Today
I no longer chase predictions.
I don’t need the holy grail.
I’ve built a signal that reflects the way I believe trading should be:
Probability-driven
Rules-based
Consistent over the long run
That’s why I share my trades live on YouTube — every entry, every stop, every exit, no filters.
Final Note
The Adaptive Opening Edge isn’t about being right 100% of the time.
It’s about playing the same game the casinos play — exploiting a small, consistent edge over hundreds of hands.
If you want to learn more about the signal, buzz me.
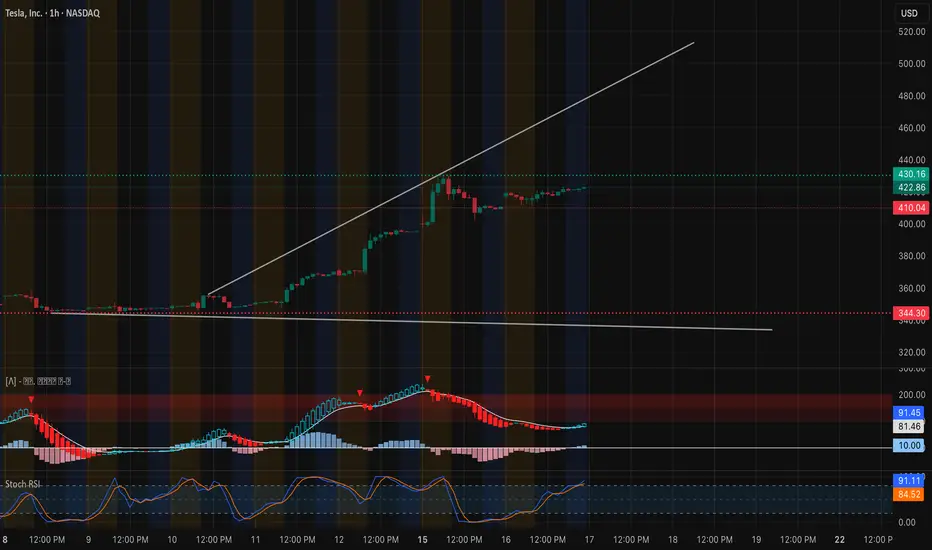
TSLA: Pausing at Key Zone – Swing & Scalp Setups for Sept 171-Hour Chart Technical View
Tesla’s rally from sub-$350 to the $420 area is now consolidating. After an explosive breakout on Sept 12–13, the 1-hour candles are moving sideways in a tight $410–$430 box. MACD has cooled from overbought and is starting to curl back up, while Stoch RSI is hovering in a neutral zone—showing that momentum is recharging, not reversing.
* Immediate Support: $410 (critical breakout retest)
* Major Support: $344 (key demand and high-volume node)
* Near-Term Resistance: $430–$440 (current supply zone)
* Upside Magnet: $450 and $484 if $440 clears with volume
EMA alignment (9 above 21) still favors the bulls, and price continues to respect the uptrend line from the early September pivot.
GEX & Options Flow
Options data underline strong bullish hedging pressure:
* Call Walls: $430 (2nd call wall), $440 (highest positive NET GEX / gamma resistance), $450 next target.
* Put Walls: $407.5 (1st defense), then $385 and $322.5.
* GEX Bias: Calls dominate with 92.8% call-weighted exposure. IVR at 20.1 (IVx ~65.9)
suggests decent option premiums but not extreme volatility pricing.
This configuration typically supports dip buying and favors upward grind, provided $410 stays intact.
Trade Thoughts & Suggestions
* Swing Idea: Accumulation on 1-hour closes above $410 with a stop below $400, aiming for $440–$450, and possibly $484 on continuation.
* Scalp Idea: Intraday traders can fade extremes inside the $410–$430 range, or take a momentum scalp if $430 breaks on strong volume.
* Bearish Scenario: A decisive break under $400 could unwind gamma support and invite a test of $385 and $344.
Quick Take
TSLA is digesting sharp gains in a healthy range. Strong call gamma at $430–$440 is both a near-term lid and a potential springboard. For Sept 17, look for continuation plays if $430 is taken out with conviction.
Disclaimer: This analysis is for educational purposes only and does not constitute financial advice. Always do your own research and manage risk before trading.
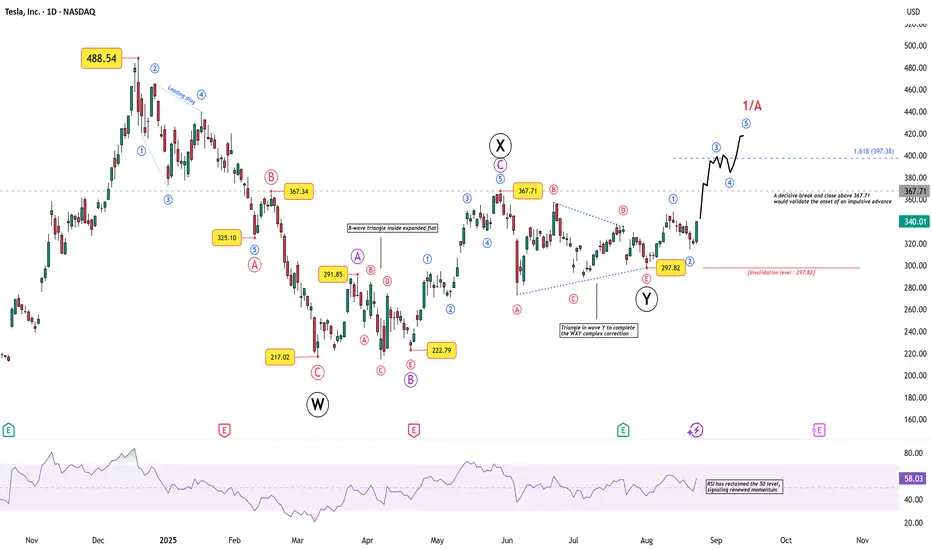
Tesla’s Breakout Test: Impulse or Fakeout?Tesla’s recent price action is stirring interest again, not just for retail traders but also for chart technicians who track Elliott Wave structures across global equities.
After a deep corrective phase that carried price down from 488.54 to 217.02 , Tesla has been carving out a multi-layered corrective structure. Here’s the breakdown:
Wave W completed into 217.02 , marking a sharp low.
This was followed by a complex X wave , which included an expanded flat where the B-wave unfolded as a triangle — a rare but valid corrective formation.
Wave Y then ended with a contracting triangle, neatly completing the W–X–Y correction near 297.82 .
From that point, Tesla appears to have begun an impulsive sequence:
Wave 1 and 2 are already visible, with the 297.82 low as the key invalidation level.
A decisive break and close above 367.71 would confirm the onset of Wave 3, targeting 397.38 (1.618× Wave 1).
Momentum is supporting the structure: RSI has reclaimed the 50 level, hinting at renewed strength.
What Next?
If the count holds, Tesla could be in the early stages of a larger impulsive rally, with Wave 1/A projecting toward the 400–420 zone . However, traders should remember that breaking below 297.82 invalidates the impulsive outlook and revives the broader corrective scenario.
Disclaimer: This analysis is for educational purposes only and does not constitute investment advice. Please do your own research (DYOR) before making any trading decisions.
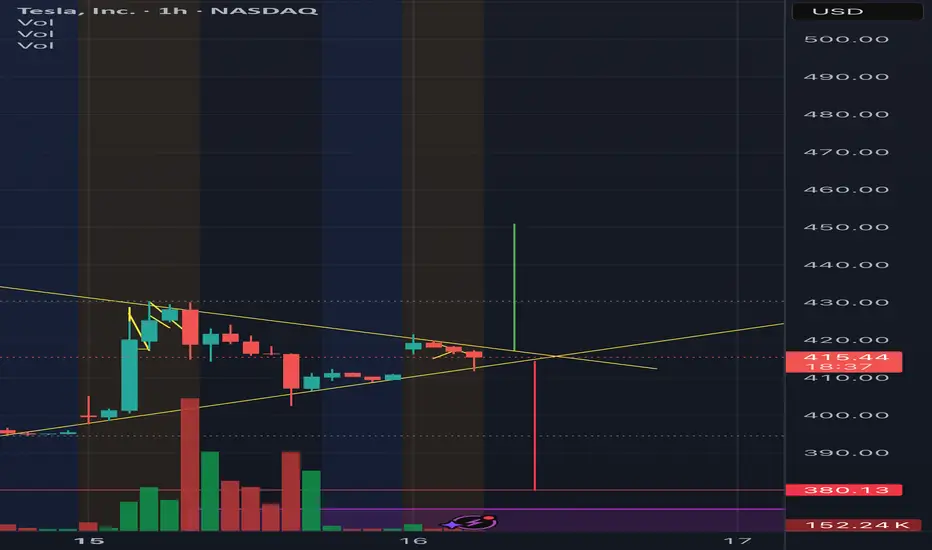
Tesla breakout set up 2 potential moves for Tesla on 15 min chart should happen around the retail data release in the US.
Yes, Elon Musk Buys $1 billion of Tesla Stock - $TSLAYes, Elon Musk bought approximately $1 billion worth of Tesla stock on September 15, 2025. We had a nice Fib retracement buy zone on this one around $214-$235 levels. We got in late ourselves and got in at $340. As a value play, this stock still trades at premium valuations, hovering near $410 per share with a trailing P/E above 200x—far higher than both traditional automakers and most growth tech peers.
Risks remain significant. Competition from Chinese rivals, ongoing price cuts that pressure vehicle margins, and regulatory challenges in key markets raise questions about how sustainable current profitability will be. For trading purposes, I would never short the stock, but buy oversold dips and swing trade it.
--------------------------------------------------------------------------------------
Disclaimer:
I do not provide personal investment advice and I am not a qualified licensed investment advisor. I am an amateur investor.
All information found here, including any ideas, opinions, views, predictions, forecasts, commentaries, suggestions, or stock picks, expressed or implied herein, are for informational, entertainment or educational purposes only and should not be construed as personal investment advice. While the information provided is believed to be accurate, it may include errors or inaccuracies. I will not and cannot be held liable for any actions you take as a result of anything you read here.
Conduct your own due diligence, or consult a licensed financial advisor or broker before making any and all investment decisions. Any investments, trades, speculations, or decisions made on the basis of any information found on here, expressed or implied herein, are committed at your own risk, financial or otherwise.
Feel free to give us a follow and shoot us a like for more analysis updates.

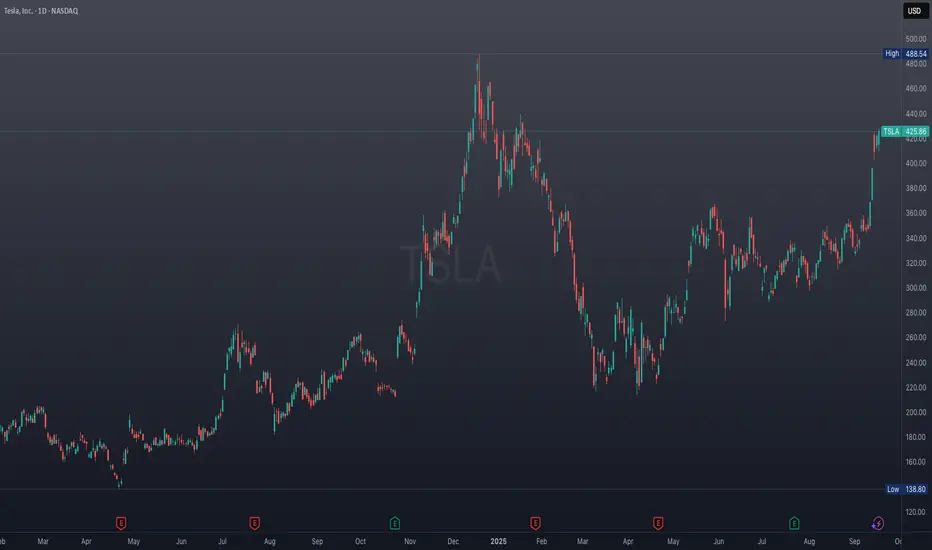
Tesla (TSLA) Stock Price Rises Above $400Tesla (TSLA) Stock Price Rises Above $400
As the chart shows, Tesla (TSLA) stocks are displaying strong market momentum. In particular, the price:
→ is above the psychological level of $400;
→ has reached its highest levels since late January;
→ has gained around 25% since the beginning of September.
Why Is TSLA Rising?
The main news driving the price surge was a media report that Elon Musk had purchased $1 billion worth of Tesla stock. The market interpreted this as commitment and confidence in the company’s future from its founder, which sharply increased demand for the shares.
Other factors contributing to TSLA’s rise include:
→ Expectations of a Federal Reserve interest rate cut to stimulate the economy. This makes growth stocks such as Tesla more attractive to investors.
→ Reduced tensions between Elon Musk and President Trump’s administration. This removes some of the political risks that had weighed on the stock.
Technical Analysis of TSLA Stock
In our August analysis of the TSLA chart, we:
→ noted that the price had broken through the upper boundary of a broad contracting triangle with its axis around $317;
→ suggested that a correction might follow after the rally in early August.
Since then:
→ the price made a minor pullback before reversing upwards (as shown by the arrow);
→ the bullish trend resumed, providing anchor points to construct a rising (blue) channel.
Thus, the chart confirms:
→ a shift in sentiment in favour of buyers;
→ an improving fundamental backdrop (as highlighted in the news) and growth prospects linked to robotaxis and other innovations.
From a bullish perspective, the breakout of $355 followed by accelerated growth points to strong demand.
From a bearish perspective:
→ the RSI indicator has spiked into overbought territory;
→ the price is near the upper boundary of the rising channel;
→ the seven-month high could prompt profit-taking by investors – already reflected in yesterday’s pullback.
Taking this into account, we could assume that while the long-term outlook remains optimistic, a correction is possible, for example:
→ towards the 50% retracement level of the A→B impulse;
→ into the price expansion zone (a bullish imbalance signal, as described by the Fair Value Gap pattern in the Smart Money Concept methodology).
This article represents the opinion of the Companies operating under the FXOpen brand only. It is not to be construed as an offer, solicitation, or recommendation with respect to products and services provided by the Companies operating under the FXOpen brand, nor is it to be considered financial advice.

TSLA 1H + GEX Game Plan for Tue, Sep 16TSLA Cooling After a Monster Run — Will 410 Hold or Is 430 Next? ⚡️
Market Structure (1-Hour View)
* Sharp run-up: TSLA ripped from mid-300s to a peak around 430 and is now consolidating in a broad rising channel.
* Trend support: Current pullback is testing a rising channel floor near 405–410.
* Momentum: MACD still in a bearish cross with fading histogram; Stoch RSI is climbing out of oversold — early sign of a potential rebound.
Key Levels to Watch
* Resistance: 410.8 (current pivot), 420.0–422.0, and 430.4 (recent high / gamma wall).
* Support: 402.2, 395.9, then deeper supports near 346.1 and 340.0 if momentum collapses.
GEX Read (Sep 16)
* Highest positive NETGEX / Call resistance: 430.4
* 2nd Call Wall: ~420–422 area.
* HVL / gamma pivot: 356–357.
* Put walls: 320 and 305.
* Options sentiment: Calls >100% (very call-heavy), IVR ~20, IVx ~65.9 — big bullish skew but with elevated implied volatility.
Implication:
* Dealers may keep TSLA pinned around 400–420 for balance.
* A strong reclaim of >420 with volume invites a retest of 430.4 and possibly higher.
* Lose 402 and a slide to 395–390 is possible.
Trade Scenarios
1) Bullish Continuation
* Trigger: 1H close >412–415 with uptick in volume.
* Entry: 414–415 on retest.
* Targets: 420 → 430.4.
* Stop: Below 408.
* Options: 420/430 call debit spread expiring this week.
2) Range Fade
* Trigger: Failure to clear 415 with repeated rejection wicks.
* Entry: 413–414 short.
* Targets: 402 → 395.9.
* Stop: Above 417.
* Options: 410P or 415/402 put spread for quick fade.
3) Deeper Pullback
* Trigger: Clear 1H break <402 with retest fail.
* Entry: 401–402 short.
* Targets: 395 → 390, with a stretch toward 356–357 (HVL) if heavy selling accelerates.
* Stop: Back above 406.
Options: 400/390 put spread for a measured pullback.
Scalping & Swing Notes
* First test of 410–412 will set the early tone; quick rejections there can produce a 5–10 point scalp.
* If we gap near 400, watch for a sweep into 395 then bounce back toward 410.
Risk & Management
* Keep sizing conservative: TSLA’s elevated IV means sharp intraday swings.
* Scale out partials at first target and tighten stops if momentum accelerates in your favor.
This analysis is for educational purposes only and does not constitute financial advice. Always trade with a plan and manage risk carefully.

TSLA - is it the time for Fireworks ?TSLA - huge base, many breakout failures due to news.
Let's see if this time it sustains this bullish move.
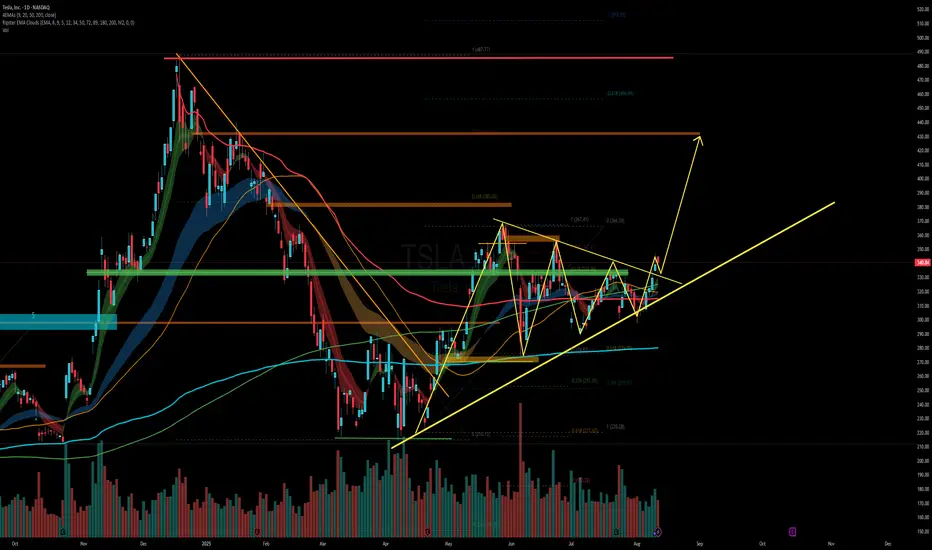
My levels to chase $TSLA bull momentumInvestors are optimistic about potential Fed rate cuts and Tesla’s push into robotics and autonomous driving.
Tesla received a permit to begin testing autonomous vehicles on public roads in Nevada. This follows its limited robotaxi rollout in Austin and signals broader ambitions for nationwide autonomous ride-hailing services.
Elon Musk claims that “80% of Tesla’s value will be Optimus,” referring to its humanoid robot initiative. With EV growth slowing, Musk is pivoting Tesla’s narrative toward AI and robotics.
There are equal numbers of Tesla haters and lovers!

CUP AND HANDLE $TSLA TO $515 MINIMUMThe cup and handle is a bullish chart pattern commonly used by traders to spot potential buying opportunities. It features a rounded "cup" formation followed by a slight downward drift forming the "handle." This pattern typically signals a continuation of an upward trend once the handle completes its consolidation phase.
ROBOTAXI BOOM
BUY NOW NASDAQ:TSLL NASDAQ:TSLA

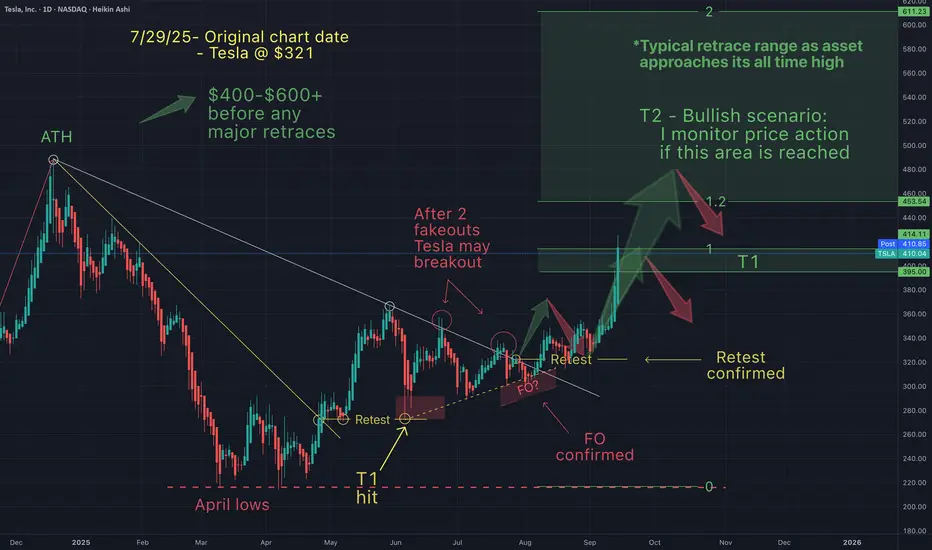
You will ask yourself, "how did he know Tesla would do that"?On July 29th, I posted this chart suggesting that I anticipated a typical pattern to emerge. Things are going according to what I was expecting.
Congratulations to everyone who has been making some gains here based on everthing that was discussed in the charts.
The most important thing in my opinion is a trading strategy...and these strategies have made us incredible gains across the board.
Only question remains, will Tesla hit my T2. What do you think?
May the trends be with you.
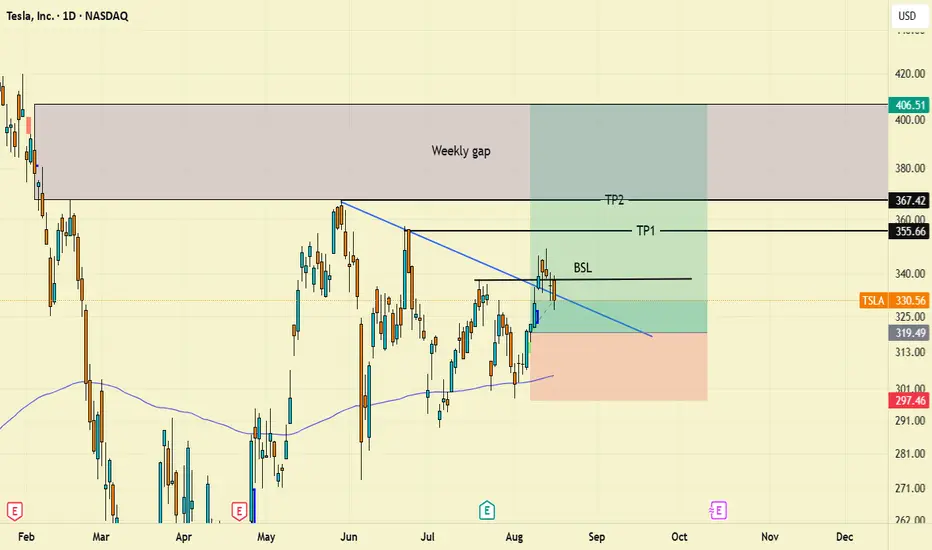
Im already long, but here is a trade idea for swings First of all, I'm just overall in general bullish on tesla.
I'm a firm believer its just one of those stocks that you can always buy and make money on equity if your patient enough.
Ive got about a $320 average on this. Truthly I dont have a stop loss because if we loose this $300 level then I know we can test $225 again and I know I can buy some more shares down there. (Which I'm OK with turning into a long term play)
Elon Musk may have screwed up his Trump friendship, but look how well this stock has held since then. Consolidation above the Daily 200 ema. I love it.
Every time he Tweets and talks shit about trump people sell and buyers are ready at $300.
-That price is the floor in this consolidation.
The Reason to be Long:
So far we have broken out and retested the break out. Good to play options on this if we get a pull back on price on Monday.
So if I was to trade with shares and equity on this then I would play "soft stops" and close the position manually if we have a very bearish red daily close with a huge fair value gap that displaces through the daily 200 ema, the $300 "floor", and a swing low broken to the downside on a higher time frame.
Now we did just sweep BSL (Buyside liquidity) and we are coming down to retest this trendline. I'm not really a trendline trader but I like to throw them up on my chart to see if they respect them.
Price can pull back to $320 and have an explosive move up.
I can see this running into the $400 range but you do have to be careful With $355 and $367.
Those are the two prices that I will look to sell some shares IF price sweeps and rejects that area.
If your overall long term bullish on this stock and Elon Musk, then just buy it here and swing it into all time highs. It will 100% go back there if your patient (:
TSLA eyes on $409.56: Golden Genesis fib to hold "High Ground"TSLA has been surging based on various news.
Now retracing towards a Genesis fib at $409.56
Clean bounce would indicate very strong trend.
Golden Genesis fibs are important milestones.
High gravity fibs can capture price into orbit.
Expect consolidation around it then sling shot.
.
Previous analysis that caught a PERFECT BOTTOM:
Hit BOOST and FOLLOW for more such PRECISE and TIMELY charts.
========================================================
.

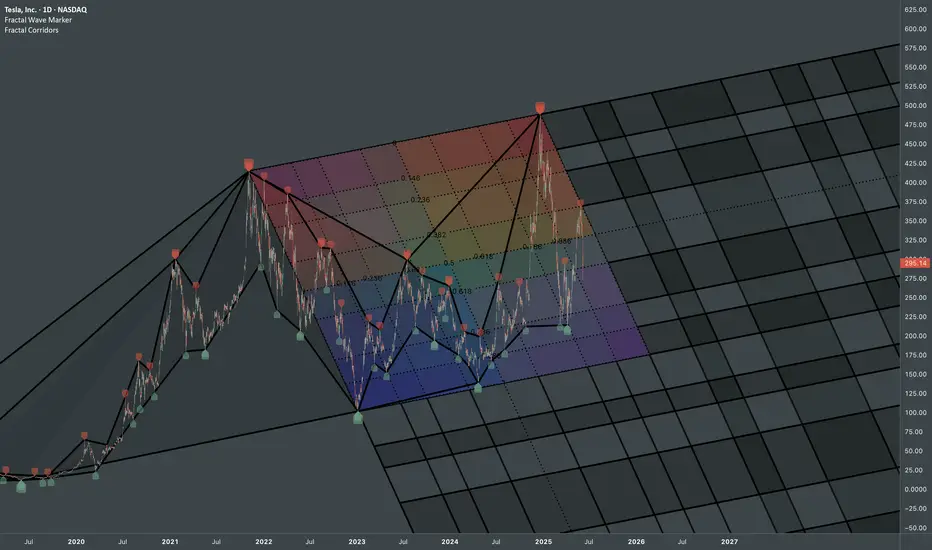
Tesla: Interconnected ATHsStructural update to:
Chronologically connecting pivots via fib channels creates a probabilistic map that captures the rhythm and scale relationships inherent in systematic price movements.
Fractal Wave Marker & Fractal Corridors were used to transform raw price data into a coherent, multiscale structure. Combo of those indicators makes you actually pay attention to ongoing patterns and get an idea how formations on smaller scale can be part of a bigger structural narrative.
TSLA Breakout Above $360 Opens Swing Trade SetupTesla broke the $360 resistance four days ago, a level that had been holding price down for the last 120 days. Once broken, price surged quickly toward the $420 zone.
In my view, if we get a chance to buy again near the 370 green support zone, it would be a great swing trade opportunity — especially with the rising trendline still intact.
🔍 Technical Analysis
Current Price: 420.95
360 acted as resistance for months, now flipped to strong support.
Green zone (360–375) aligns with the uptrend, key area to watch for re-entry.
🛡️ Support & SL
🟢 370 zone | SL: 345
🧭 Outlook
Bullish Case: Hold above 370 → continuation toward 450–475.
Bearish Case: Break below 345 → deeper correction.
Bias: Bullish while above 370.
🌍 Fundamental Insight
Valuation: Tesla trades at a relatively high P/E ratio (60–70 range) compared to traditional automakers, reflecting growth expectations rather than current earnings.
Revenue Growth: While margins have compressed due to price cuts, top-line growth remains supported by strong EV demand and expansion in new markets.
Innovation & AI: Tesla’s positioning in AI, autonomous driving, and energy storage continues to attract investor optimism beyond just vehicle sales.
Risks: Competition from other EV makers and margin pressure are key risks investors are watching.
✅ Conclusion
Tesla’s breakout above 360 ended months of pressure. A pullback into the green support zone would be a strong swing entry with trendline confluence. While valuation is stretched versus peers, bullish momentum and growth expectations continue to support the stock.
⚠️ Disclaimer
This analysis is for educational purposes only and does not constitute financial, investment, or trading advice.

TESLA - Robotaxi will drive the price above 1000This is not a short-term trade as you know from me on FX, Crypto and Indices. This is buy and hold investment. I got already good bag of share and Im still adding without trying to time if perfectly, but now I think its time to buy bigger positions.
Tesla is my 3rd biggest position after the Bitcoin and Strategy (MicroStrategy). Many people see it only as an EV cars company, but it's not all what they do, just read bellow to see why I see a huge potential in this company.
📍Why Tesla is Considered a Top Investment
Tesla stands out as a leading player in the EV market, with a strong brand and a history of delivering innovative products. In 2024, it produced about 459,000 vehicles and delivered over 495,000 in the fourth quarter alone, showcasing its ability to meet growing demand Tesla Fourth Quarter 2024 Production, Deliveries & Deployments.
💾Financially, Tesla reported $97,690 million in total revenue for 2024, with the automotive segment contributing $87,604 million and energy solutions adding $10,086 million Tesla, Inc. Annual Report on Form 10-K for 2024. This diversification into energy, alongside investments in autonomous driving, positions Tesla for long-term growth, making it attractive for investors seeking exposure to future trends in sustainability and technology.
📍What Tesla Does Beyond EV Cars
Beyond EVs, Tesla is deeply involved in energy solutions:
📍Solar Products: Offers solar panels and solar roofs for clean energy generation.
📍Energy Storage: Provides Powerwall for homes and Megapack for large-scale projects, helping stabilize grids and manage energy costs.
📍Charging Infrastructure: Operates a network of Supercharger stations, increasingly open to other EVs.
Services: Includes vehicle maintenance through service centers and body shops.
📍Robotaxi: Plans to launch a fully autonomous ride-hailing service in June 2025 in Austin, Texas, potentially opening new revenue streams Tesla's robotaxis by June? Musk turns to Texas for hands-off regulation.
📍Tesla Optimus: Developing a general-purpose robotic humanoid for tasks like household chores or industrial work, which could lead to new markets.
This expansion into energy and services, along with unexpected ventures like Robotaxi and Tesla Optimus, enhances Tesla's role in the transition to sustainable energy and technology, offering benefits like grid stability and potential robotics applications.
The growth in the energy segment, with a 67% increase from 2023 to 2024, highlights Tesla's expanding role in sustainability, potentially attracting investors focused on long-term trends. Additionally, Tesla's commitment to innovation, particularly in autonomous driving technology, is noteworthy. The company is developing features like Full Self-Driving (FSD), which could open new revenue streams, such as robotaxi services, enhancing its investment appeal.
🤔I think Optimus and Robotaxi will exceed rapidly exceed their EV cars revenue. Elon musk is predicing over 1000% growth in 5 years. Which would be way above $2900 without stocks splits.
I m a bit conservative and I think we can go somewhere between 3 - 4 standard deviations.
Wishing you continued success on your trading journey. May this educational post inspire you to become an even better trader!
“Adapt what is useful, reject what is useless, and add what is specifically your own.”
Perfectly nailed bottom around 200 and our positions are now 50% in profit good luck
David Perk ⚔

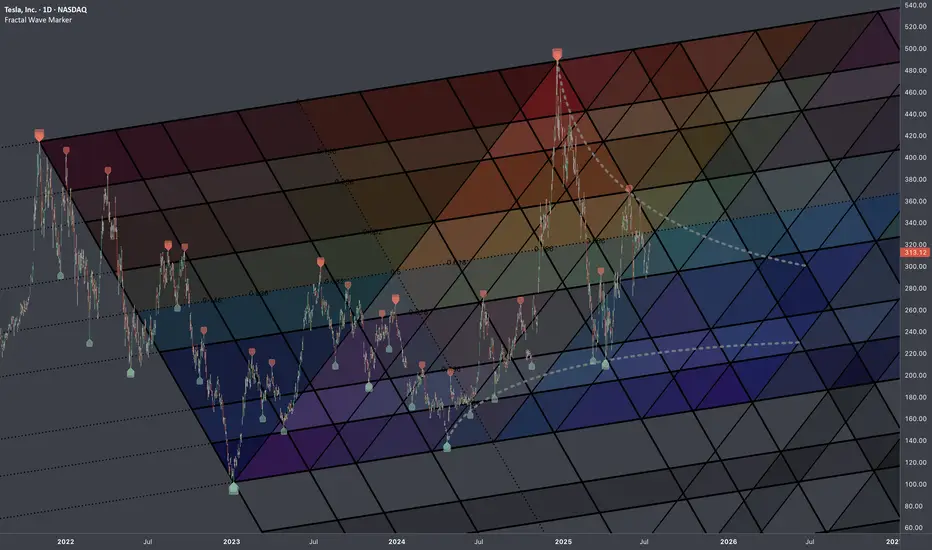
$TSLA: Fib InterconnectionsResearch Notes
Examining interconnection type with regressive angle:
Critical points:
Mapping with 3 fibonacci channels:
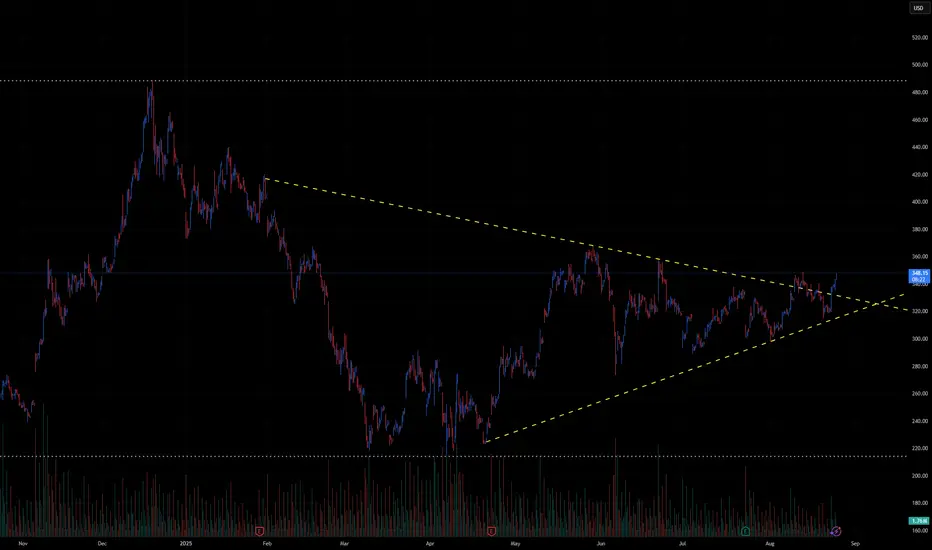
TSLA Technical Outlook – Symmetrical Triangle Breakout Watch🚗 TSLA Technical Outlook – Symmetrical Triangle Breakout Watch
Ticker: TSLA (Tesla, Inc.)
Timeframe: 30-minute candles
🔍 Current Setup
TSLA has been consolidating for months inside a large symmetrical triangle, marked by:
Descending resistance: from ~380 down to ~347.
Ascending support: from April lows near ~240, now rising toward ~320.
Current price: ~348, testing the upper boundary of the triangle.
This structure signals compression after a major downtrend, and the breakout direction will likely define TSLA’s next big move.
📊 Breakout Levels
🚀 Upside (Bullish Scenario)
Trigger: Break and close above 350–355.
Intermediate Targets:
370–380 → First resistance zone.
400–420 → Extension levels.
Measured Move Target: ~450+ (based on the triangle height projection).
🔻 Downside (Bearish Scenario)
Trigger: Failure at resistance and break below 320, confirmation under 310.
Intermediate Supports:
300 → Psychological level.
280–260 → Stronger support zone.
Measured Move Target: ~250 (triangle projection downward).
📈 Volume Analysis
Volume has been contracting steadily during the triangle’s formation.
A major volume spike will be key to confirming whichever direction TSLA chooses.
⚖️ Probability Bias
TSLA is at the make-or-break resistance zone (~350).
A breakout above 355 would strongly favor bulls, targeting 380 → 400+.
But a rejection here and break below 320 would shift momentum bearish, sending TSLA back toward 280–260.
✅ Takeaway
TSLA is at a critical inflection point inside a long-term triangle:
Bullish Break > 355: Targets 370 → 400 → 450+
Bearish Break < 320: Targets 300 → 280 → 250
Watch for volume-backed confirmation, as this move could define Tesla’s next multi-week trend.