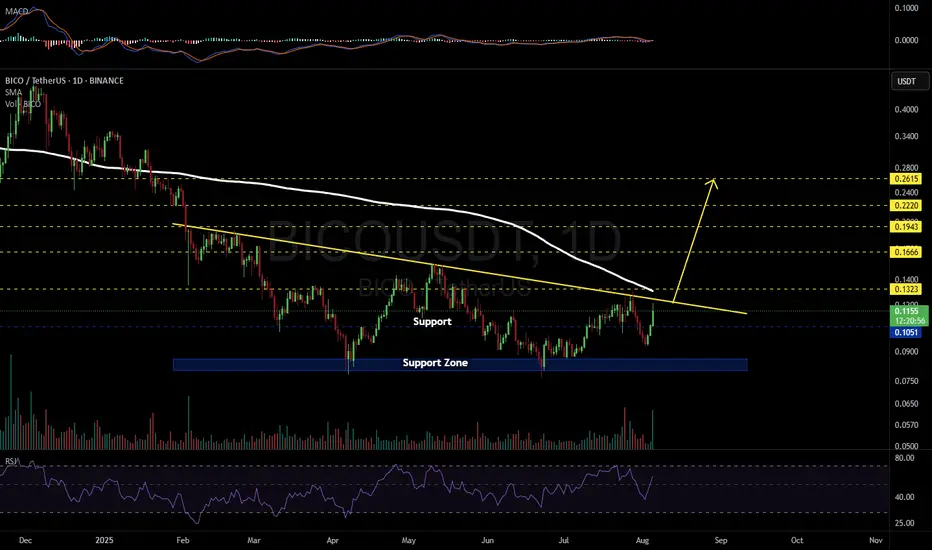
BICOUSDT 1D#BICO has formed a descending triangle on the daily timeframe.
📌 Consider buying at the current price and near the support level at $0.1051.
In case of a breakout above the triangle resistance and the daily SMA200, the potential upside targets are:
🎯 $0.1323
🎯 $0.1666
🎯 $0.1943
🎯 $0.2220
🎯 $0.2615
⚠️ As always, use a tight stop-loss and apply proper risk management.
Trade ideas
BICOUSDT 1D AnalysisBICO ~ 1D Analysis
#BICO This trade is high risk
Buy gradually from here if you still have confidence in this coin with a short term target of at least 15%+ and a long term target of $0.46
BICOUSDT UPDATE
BICO Technical Setup
Pattern: Falling Wedge Breakout
Current Price: $0.1425
Target Price: $0.30
Target % Gain: 200.62%
Technical Analysis: BICO has broken out of a falling wedge pattern on the 1D chart with strong bullish candles. A clear breakout above resistance with increasing volume suggests a potential sharp upside.
Time Frame: 1D
Risk Management Tip: Always Use proper risk management.

bico getting ready for 2x bullish wave after long time, seems like bico getting ready for another breakout, currently testing multiple resistance area, once falling wedge and horizontal area got cleared, it can give solid bullish rally towards 0.2$ waiting for breakout

BICOUSDT📌 Market Overview:
The price is in a downtrend but showing signs of potential reversal.
Currently trading near 0.1264, close to key support (0.1644).
The falling wedge/descending channel suggests a possible breakout.
RSI bullish divergence indicates weakening bearish pressure.
📈 Trade Plan: Long Position (BUY Setup)
🎯 Entry: At Current Market Price (CMP) ~0.1264
🎯 Take Profit Targets:
First Target (Resistance Level): 0.1644
Second Target: 0.22 - 0.25 (Next major resistance)
Final Target (Long-term Potential): 0.30 - 0.35
🔻 Stop-Loss:
Below 0.1152, as a break below this level invalidates the bullish setup.
BICOUSDT: 100% Daily Volume Explosion – A Big Move is Brewing!The Setup is Forming – Huge Opportunity Ahead
"BICOUSDT just delivered a massive 100% daily volume increase. This is the kind of action that gets smart money interested. Are you ready?"
Let’s Talk Strategy:
Blue Box Entry: The chart isn’t fully matured yet, but let me tell you – if we get confirmation from CDV, a lower time frame breakout, and volume profile alignment, the blue box could be a highly profitable entry point.
Patience Pays: Remember, this is about precision. We don’t trade just to trade. We wait for the perfect breakout and the data to support our move. That’s how real traders win.
Key Notes:
"As always, I’ll rely on CDV, liquidity heatmap, and volume profile to ensure the trade aligns perfectly with expectations. No shortcuts, just results."
This is shaping up to be a potential masterpiece of a trade. Stay sharp, watch the confirmation, and let’s ride this wave to success! 🚀
Let me tell you, this is something special. These insights, these setups—they’re not just good; they’re game-changers. I've spent years refining my approach, and the results speak for themselves. People are always asking, "How do you spot these opportunities?" It’s simple: experience, clarity, and a focus on high-probability moves.
Want to know how I use heatmaps, cumulative volume delta, and volume footprint techniques to find demand zones with precision? I’m happy to share—just send me a message. No cost, no catch. I believe in helping people make smarter decisions.
Here are some of my recent analyses. Each one highlights key opportunities:
🚀 RENDERUSDT: Strategic Support Zones at the Blue Boxes +%45 Reaction
🎯 PUNDIXUSDT: Huge Opportunity | 250% Volume Spike - %60 Reaction Sniper Entry
🌐 CryptoMarkets TOTAL2: Support Zone
🚀 GMTUSDT: %35 FAST REJECTION FROM THE RED BOX
🎯 ZENUSDT.P: Patience & Profitability | %230 Reaction from the Sniper Entry
🎯 DEXEUSDT %180 Reaction with %9 Stop
🐶 DOGEUSDT.P: Next Move
🎨 RENDERUSDT.P: Opportunity of the Month
💎 ETHUSDT.P: Where to Retrace
🟢 BNBUSDT.P: Potential Surge
📊 BTC Dominance: Reaction Zone
🌊 WAVESUSDT.P: Demand Zone Potential
🟣 UNIUSDT.P: Long-Term Trade
🔵 XRPUSDT.P: Entry Zones
🔗 LINKUSDT.P: Follow The River
📈 BTCUSDT.P: Two Key Demand Zones
🟩 POLUSDT: Bullish Momentum
🌟 PENDLEUSDT.P: Where Opportunity Meets Precision
🔥 BTCUSDT.P: Liquidation of Highly Leveraged Longs
🌊 SOLUSDT.P: SOL's Dip - Your Opportunity
🐸 1000PEPEUSDT.P: Prime Bounce Zone Unlocked
🚀 ETHUSDT.P: Set to Explode - Don't Miss This Game Changer
🤖 IQUSDT: Smart Plan
⚡️ PONDUSDT: A Trade Not Taken Is Better Than a Losing One
💼 STMXUSDT: 2 Buying Areas
🐢 TURBOUSDT: Buy Zones and Buyer Presence
🌍 ICPUSDT.P: Massive Upside Potential | Check the Trade Update For Seeing Results
🟠 IDEXUSDT: Spot Buy Area | %26 Profit if You Trade with MSB
📌 USUALUSDT: Buyers Are Active + %70 Profit in Total
🌟 FORTHUSDT: Sniper Entry +%26 Reaction
🐳 QKCUSDT: Sniper Entry +%57 Reaction
📊 BTC.D: Retest of Key Area Highly Likely
This list? It’s just a small piece of what I’ve been working on. There’s so much more. Go check my profile, see the results for yourself. My goal is simple: provide value and help you win. If you’ve got questions, I’ve got answers. Let’s get to work!

Bico capitulation or pump? BINANCE:BICOUSDT
Lets take a look on Biconomy chart, are we one step to capitulation or ready for massive pump?
✅Before we start to discuss, I would be glad if you share your opinion on this post's comment section and hit the like button if you enjoyed it.
Thank you.
Possible Targets and explanation idea
➡️Fib by lines since drop in April. Bico strong hold 0 level and grab all stop losses who opened longs in May at the bottom
➡️The same day got Strong Buy signal on Trade ON indicator. Positive signal
➡️In next days strong signal to buy on Direction indicator (confirmation)
➡️1st resistance we can find out at 0.38 level by fib
➡️Strong Short I think we can see at 1.34-1.41 maybe with wicks
➡️Not now but this is targets for next 2-3 months
➡️Capitulation zones is like usual -0.18 level by fib and -0.27 and forming lower low since listing on Binance
Hope you enjoyed the content I created, You can support with your likes and comments this idea so more people can watch!
✅Disclaimer: Please be aware of the risks involved in trading. This idea was made for educational purposes only not for financial Investment Purposes.
* Look at my ideas about interesting altcoins in the related section down below ↓
* For more ideas please hit "Like" and "Follow"!

BICOUSDT 1WBICO ~ 1W
#BICO This is a very good support block for now,. Buy in stages from here with a minimum target of 20%++
Biconomy is at a critical crossroads!$0.55 is the only resistance holding Bico from reaching new highs. We can see two scenarios based on the market:
1. If we see a green market, Biconomy can try to break this resistance. If it succeeds in breaking it, the price can have a pullback to $0.35, then we can wait for $1 or even $2.
2. If it fails to break the resistance, we can see new lows with potential targets of $0.10 - $0.095.
However, if we don't see an attempt to break the $0.50 resistance (if Bico fails to break the lost support at $0.30 and also loses $0.25), the price can go down to $0.19, then a pullback for breaking $0.30 can be expected and if it fails then the second scenario targets are expected.
For now since Bico is holding on to the $0.25, it is a good buying opportunity.
Dyor

BICOUSDT 1WBICO Update ~ 1W
#BICO So far it continues to maintain its bullish structure. the price is currently still maintaining this support block,. Buy in stages from here. with a minimum target of 20%+
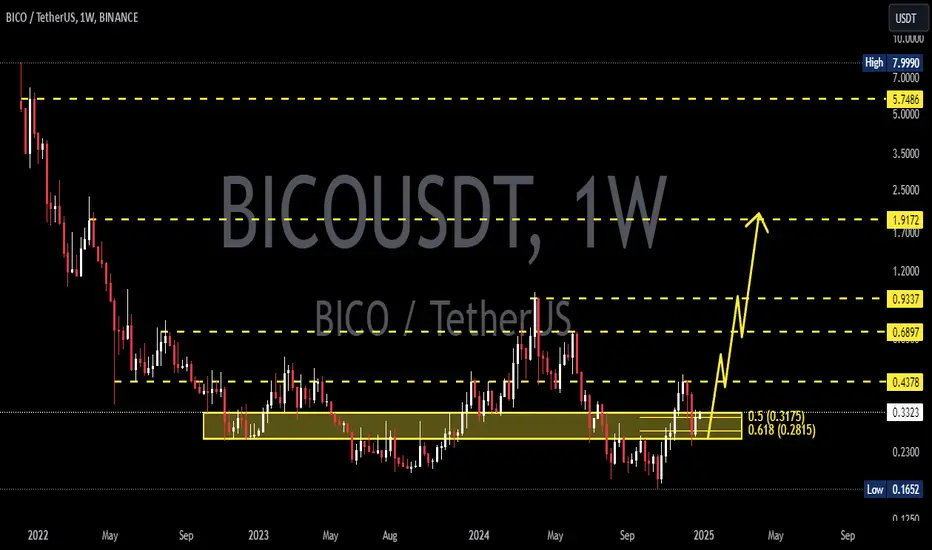

BICO Go to $0.62 soonHello,
BICO first target is $0.62.
second target and third target shown in chart.
I think Target 2 and 3 is available after $0.62 reached with strong candle.
Thank you

Analysis of bico/usdt by ict price action Bico/usft tps:
Tp1 0.5298 $
Tp2 0.66$
2p3. 0.98$
Tp4 1.8$
Tp5. 2.5$
Finally 4.5$

#BICO/USDT#BICO
The price is moving in a descending channel on a 1-day frame and sticking to it well
We have a bounce from the lower limit of the descending channel and we are now touching this support at a price of 0.1676
We have an upward trend on the RSI indicator that is about to be broken, which supports the rise
We have a trend to stabilize above the moving average 100
Entry price 0.2170
First target 0.2555
Second target 0.3027
Third target 0.3628

Is BICO About to Surge or Plunge? Critical Levels!Yello, Paradisers! Is #BICOUSDT gearing up for a significant move, or are we staring down another potential dip? Here’s what we’re seeing on the charts and why you should pay close attention.
💎#BICO is showing bullish momentum after successfully breaking through its descending resistance. The current price is testing the demand zone around 0.0205, a critical area to watch. If the price manages to rally from here and breaks above the 0.267 resistance level, we could see a significant shift in market structure, leading to a strong upward movement toward major resistance targets.
💎However, there's a caveat to keep in mind. Should BICO break below this demand zone, it may test the key support level once more. This support level coincides with a previous low and serves as an essential price floor. For the bullish scenario to remain valid, BICO must rebound and reclaim the 0.0205 level. Any failure to hold above this point could signal trouble.
💎If a daily candle closes below this crucial support, the bullish outlook would be invalidated. In that scenario, BICO would create a new lower low, increasing the risk of further dips.
Stay disciplined and patient, Paradisers. Monitoring these levels and acting strategically is the key to long-term success. Trade smart and play it safe!
MyCryptoParadise
iFeel the success🌴

BICO SHORTWith sell print and price exhaustion, we have an opportunity to short.
Target : 0.36 area
SL: above our sell print
DYOR
For indicator access, you can contact me.

Trading opportunity for BICOUSDTBased on technical factors there is a Buy position in :
📊 BICOUSDT
🔵 Buy Now
🪫Stop loss 0.2650
🔋Target 1 0.3900
🔋Target 2 0.4900
🔋Target 3 0.6900
💸RISK : 1%
We hope it is profitable for you ❤️
Please support our activity with your likes👍 and comments📝

Trading Signal Alert: BICOUSDT - BuyDear Traders,
We have identified a promising trading opportunity for the BICOUSDT currency pair using our EASY Quantum Ai strategy. The current analysis suggests a Buy signal with the following parameters:
Enter Price: 0.2533
Take Profit: 0.26623333
Stop Loss: 0.23783333
Analysis and Justification:
The decision to go long on BICOUSDT is based on several key factors.
1. Technical Indicators: Our strategy incorporates advanced technical analysis tools that have detected a bullish trend formation. Key indicators like the Moving Average Convergence Divergence (MACD) and Relative Strength Index (RSI) are showing positive momentum, indicating strong buying pressure in the market.
2. Market Sentiment: There has been a recent shift in sentiment among traders and investors towards digital assets, particularly favoring projects like BICO. An increase in positive market news and developments is supporting the upward momentum.
3. Volume Patterns: A consistent increase in trading volume suggests a heightened interest in BICO, aligning with our trend-based entry strategy.
4. Support and Resistance Levels: The entry price aligns well with previously established support levels, providing a solid foundation for the anticipated move upwards.
As always, please exercise caution and proper risk management when executing trades.
Happy Trading!


Biconomy could be huge.Hello, fellow traders!
This is my analysis on Biconomy (BICOUSDT).
I've covered Biconomy a lot in my account - it actually has second highest coverage after BTC.
1️⃣ Analysis
The price has recently crossed the resistance line (red line) of the monthly downtrend with notable volume spike. The line used to be the support line of the previous downtrend until the lower breakout in July when it became the resistance of a newer downtrend. The line was constantly being respected, and with the price nearing the ATL (All time low), we see a wedge pattern. The price recorded new ATL before making a breakout. This could be interpreted as a falling wedge pattern where the price reverse the downtrend with explosive increase in volume - starting a strong uptrend.
2️⃣ Expectations
I think the breakout and the volume spike is something to pay attention to. The resistance line has been showing very strong price actions for over half of Biconomy's entire history - crossing such line could potentially signal a strong reversal of the trend. The unusual, explosive volume spike also backs this up. Take a look at the similar attempt in July where the breakout eventually failed without the volume. The price is also very close to the strong support level of 0.1987. With all these information together, we might see a strong uptrend in near future.
3️⃣ Key approach
4️⃣ Other approach
- I'm going to skip all the approaches for this analysis because I am not going to trade but just watch. But if I were, I would set my initial target price to 0.3667 which is key resistance level and exit all when the price reaches the green line which is a support line of early uptrend. Reason I am not going to trade is because it will be based on a raw assumption (prediction) that the breakout is true - this personally does not align with my trading rules. I know I am not strong enough to endure that kind of stress.
5️⃣ Considerations
1. If you are willing to trade, keep in mind that this is not going to be a short time trade. It might take months or even years for us to reach our targets. Or it might not reach at all.
2. 0.2530 - 0.3047 zone (where the price is currently in) is very difficult to cross. This is because the zone represents the gap between Biconomy's high and close on its first trading day. It might take a long period of consolidation for the price to finally break through.
3. The selling pressure is very high right now. This is not a surprise though considering the historical background of the current price range. Also the reversal of trend always bring high opposite pressure in order to maintain the current trend - older the trend is, higher the pressure.
4. This is an adventure. Nobody knows what's going to happen. Once a breakout happens, you really can't see what's next. You cannot comfortably rely on the historical data. Yes, the price may respect historical levels and zones but even that contains some uncertainty - if a line gets broken, what makes you think others won't? The breakout also has possibility of failing or being false. New trend means no historical data, no background information, and no idea what to expect or where to expect next pivot points. This could give you a lot of stress which is why I am not going to trade this one.
5. Biconomy has no news in TradingView. It doesn't even have a section for it, which I thought was odd. However, I've done some research on the internet and I felt pretty positive about their active engagements on Social media and their innovative ambition of the project.
💡 Breakout might allow you great fortune but contains a lot of risks and contingencies. And this is why I prefer trading inside the trend - granted, trend does not last forever and past does not always represent the future, but we can definitely take profit with proper understanding of how the market moves and confirmation of trend continuing. Just like surfing. But if you insist on trading Biconomy, make sure to set multiple layers such as price rebound or break of structure to confirm the uptrend.
💡 Analysis on Biconomy I've done so far were mostly based on the hourly chart. But analyzing the daily chart gave me a broader idea and perspective of how price might move in the future. Lesson I learned here is that larger timeframe gives us wider view of the movements. Watching the hourly chart or lower timeframe could also be pretty stressful. Funny thing is even if I enter at the same price, doing so based on the hourly chart analysis gives me anxiety whereas daily chart gives me more confidence. If you zoom out and set your holding period longer, it's a lot less stressful and also safer. So don't be anxious, don't be emotional, do your best and the rest is up to God. Thank you for reading my long analysis and I hope you got something out of it!
React, don't predict! Stay disciplined and patient. Don't get greedy and be thankful.
Nehemiah 13:7-9

BICO with the election hypeHello, fellow traders!
I never thought I'd post about BICO again but here it is.
For the last 5 days, BICO attempted the breakout three times.
Last two times failed, price being unable to sustain above the resistance line.
Two consecutive failures mean that the seller pressure is still strong, but I decided to keep watching since the third breakout might happen with the election today.
And there you finally have it! BICO on its THIRD attempt.
BICO is now above 0.25 and with this exceptional volume spike and the promising outcome of the election, it might start rallying very soon. However, don't get too excited- we still have some steps left to confirm the uptrend.
We want one of these two scenarios to happen:
1. Rebound near the resistance line (red line)
2. Rebound at the demand zone (red box)
If we see both, that's even better.
Then we will feel confident enough to enter.

BICO final analysis: What's the future of BICO?Hello, traders!
I've posted a lot about BICO lately, and this will be my final remark for this cryptocurrency.
BICO is about a year old, its ATH was 0.9877 USDT on April 1st when it continued to decline ever since.
BICO's average daily volume was very low for last few months, being approx. 5M USDT.
However the volume from October 30th to November 4th (yesterday) was 456M in total. This is average volume of 76M a day.
With this exceptional rise of volume, BICO is attempting to escape months old resistance line of the downtrend.
Looking at the 1H chart, we see more details of the current movement: the crypto had two breakouts, both failing to sustain above the resistance line. This tells us that the sellers are still in charge - despite the promising volume spike, price failed to remain above the line longer than 24 hours, not once but twice.
BICO's selling pressure still being high, there are two scenarios we can expect:
1. BICO remaining in consolidation for another breakout attempt. If current attempts are fueled with upcoming US election (and interest rate announcement), it might succeed in its third attempt. If this is the case, I will wait for the third breakout, confirm the uptrend with (1) rebound at the resistance line and (2) break of structure at 0.2529. Normally, I don't put much hope for any crypto or stock that shoots for the third attempt, but I'll give it a try since the US election is just about to happen.
2. BICO continuing the downtrend after two failed attempts. You will see a orange line in the chart at price of 0.2106. This price has acted as a key support level for past few days. If you go further back in the past, you will also notice this price had numerous occasions of price action. The level has acted as a solid support after the first breakout. You can see two strong rebounds as the price reached this level. It is still working as a support after the second breakout, though it is a lot weaker.
If the price drops below the level, I think the third breakout is far less likely to happen. I'm not going to say it is impossible (considering the election) but I'd lean towards the SHORT opportunities more. If the price drops below 0.2, I think that's a valid sign for a continued downtrend.
Let's see how it turns out!

BICO's second attempt?In the previous breakout, we see BICO failing to keep up the uptrend and falling below the resistance line.
We now see its second breakout. While the high was lower than the first, its momentum is bigger. IF we see a reversal in 1️⃣ and BoS in 2️⃣, we will enter LONG.
