BIGTIMEUSDT — Descending Triangle Nearing Breakout or Breakdown?Full Analysis
The BIGTIME/USDT chart on the 4D timeframe (OKX) shows a prolonged downtrend with consistent lower highs, capped by a strong descending trendline (yellow). At the same time, price has been holding within a major support zone between 0.038 – 0.055 USDT (yellow box).
This structure form

#BIGTIME #BIGTIMEUSD #BIGTIMEUSDT #Analysis #Eddy#BIGTIME #BIGTIMEUSD #BIGTIMEUSDT #Analysis #Eddy
A reversal structure has formed on the weekly and daily time frames, and the necessary confirmations have been given on the weekly time frame. Considering the structure formed on the above time frame, as well as the behavior of this currency in the

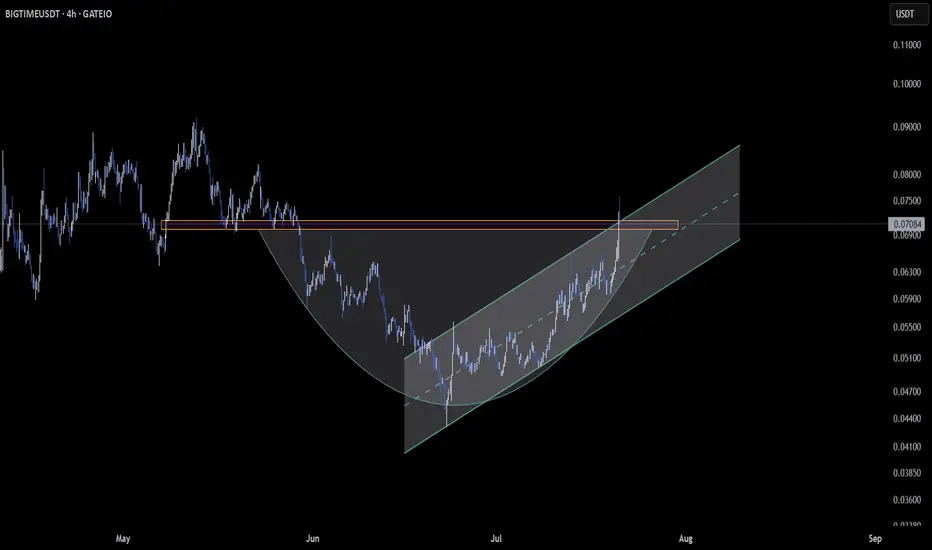
BIGTIME – Dual Breakout Unfolding Across Timeframes $BIGTIME is stepping into the spotlight with back-to-back breakout signals across multiple charts 🚀.
On the 12-hour timeframe, price is breaking out of a round bottom formation—a classic accumulation pattern shifting into momentum mode 🔄. This kind of structure often precedes strong moves if follow
BIGTIME current chart and possible indicators (daily)MEXC:BIGTIMEUSDT is not the easiest chart to analyze - due to it's short story and thus lack of information. BIGTIME had a huge ralley to 1 dollar back in December 2023 and was, since then, in an downtrend.
That downtrend found its bottom in August 2024 at around 5 cent and consolidated out of th

BIGTIME/USDT Ready to Explode! End of a Long Downtrend? Breakout🧠 Chart Pattern & Technical Structure:
✅ Main Pattern: Descending Triangle Breakout Setup
A Descending Triangle has formed from the 2023 high to mid-2025, indicating consolidation after a strong downtrend.
Strong horizontal support between $0.05266 – $0.06550 has been tested multiple times, showi

$BIGTIME LONG TRADE
**🎯 Entry:** 0.1625 – Entering at a strategic level for potential upside.
**📈 Targets:** 0.1694, 0.181, 0.1937 – Key levels to watch for profit-taking.
**🛑 Stop Loss:** 0.1568 – Manage risk by sticking to this stop to limit downside.
💡 *Always manage your risk and adjust your position size ac

BIGTIME/USDT Analysis (1H Timeframe)Price has successfully broken the descending trendline, signaling a trend reversal from bearish to bullish. The market is now testing a key supply zone around $0.07450 – $0.07550.
Trend Shift: A bullish breakout from the downtrend line indicates buyers are gaining control.
Support: Previous resist
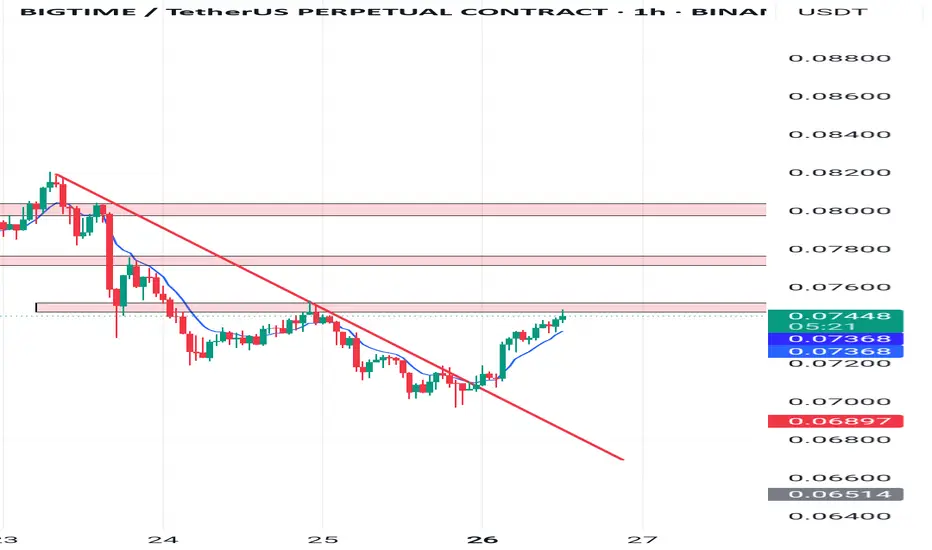
BIGTIME/USDTKey Level Zone: 0.07500 - 0.07690
HMT v8.1 detected. The setup looks promising, supported by a previous upward/downward trend with increasing volume and momentum, presenting an excellent reward-to-risk opportunity.
HMT (High Momentum Trending):
HMT is based on trend, momentum, volume, and market s

$BIGTIME LONG TRADE
**🎯 Entry:** 0.1625 – Entering at a strategic level for potential upside.
**📈 Targets:** 0.1694, 0.181, 0.1937 – Key levels to watch for profit-taking.
**🛑 Stop Loss:** 0.1568 – Manage risk by sticking to this stop to limit downside.
💡 *Always manage your risk and adjust your position size ac

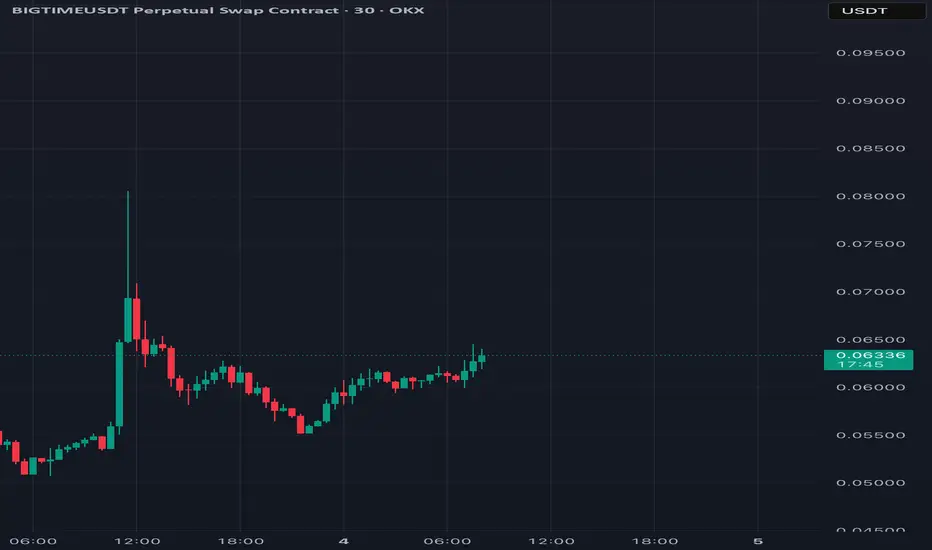
BIGTIME/USDT Analysis – 30-Minute Chart (OKX)BIGTIME/USDT Analysis – 30-Minute Chart (OKX)
Key Support Levels:
Immediate support: 0.06043 USDT
Stronger support: 0.05960 – 0.05515 USDT (Potential entry zone)
Stop-loss (SL): Below 0.04916 USDT (-12.19% risk)
Key Resistance Levels:
First resistance: 0.06485 USDT (Take Profit 1)
Next resistanc
See all ideas
Summarizing what the indicators are suggesting.
Oscillators
Neutral
SellBuy
Strong sellStrong buy
Strong sellSellNeutralBuyStrong buy
Oscillators
Neutral
SellBuy
Strong sellStrong buy
Strong sellSellNeutralBuyStrong buy
Summary
Neutral
SellBuy
Strong sellStrong buy
Strong sellSellNeutralBuyStrong buy
Summary
Neutral
SellBuy
Strong sellStrong buy
Strong sellSellNeutralBuyStrong buy
Summary
Neutral
SellBuy
Strong sellStrong buy
Strong sellSellNeutralBuyStrong buy
Moving Averages
Neutral
SellBuy
Strong sellStrong buy
Strong sellSellNeutralBuyStrong buy
Moving Averages
Neutral
SellBuy
Strong sellStrong buy
Strong sellSellNeutralBuyStrong buy
Displays a symbol's price movements over previous years to identify recurring trends.