RPL/USDT Enters Prime Buy Zone: Accumulation Before Next Leg Up?Firstly, our Algo-based indicators are used to create this analysis. Please Follow, Boost and leave your comments if you profited with our posts, so we may continue:
This 4-hour chart for RPL/USDT highlights a key support area that could serve as a launchpad for the next bullish impulse.
An
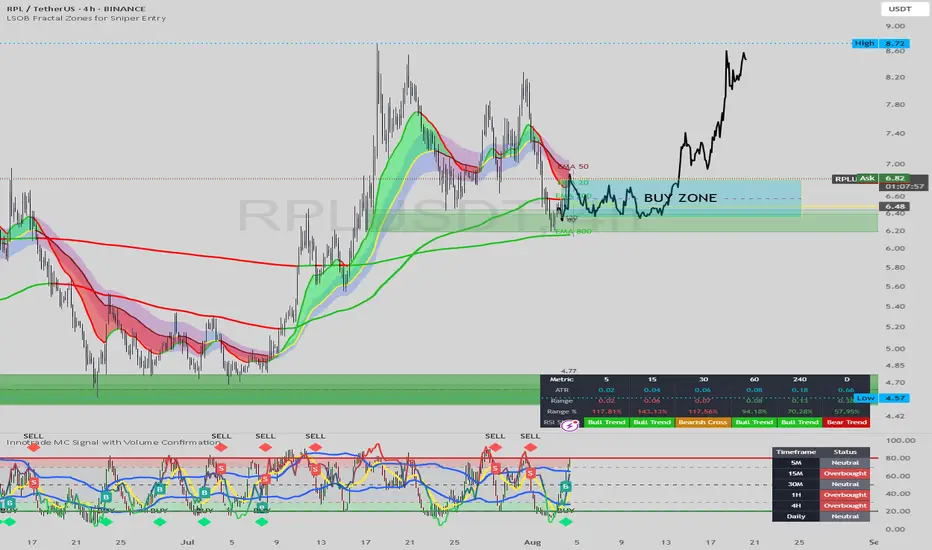
RPLUSDT Forming Strong Bullish StructureRPLUSDT is currently showing a strong bullish structure, with price action reclaiming a key support zone after a temporary retracement. The chart reveals a textbook market cycle with higher highs and higher lows, indicating a possible continuation of the uptrend. The current price level is sitting j

RPL/USDThas spent over 100 days in consolidation, and is now beginning to break through major resistance levels, signaling a structural shift in momentum. Price is currently forming a new base support above the breakout zone, indicating strong buyer interest and commitment to higher prices.
This behavior r
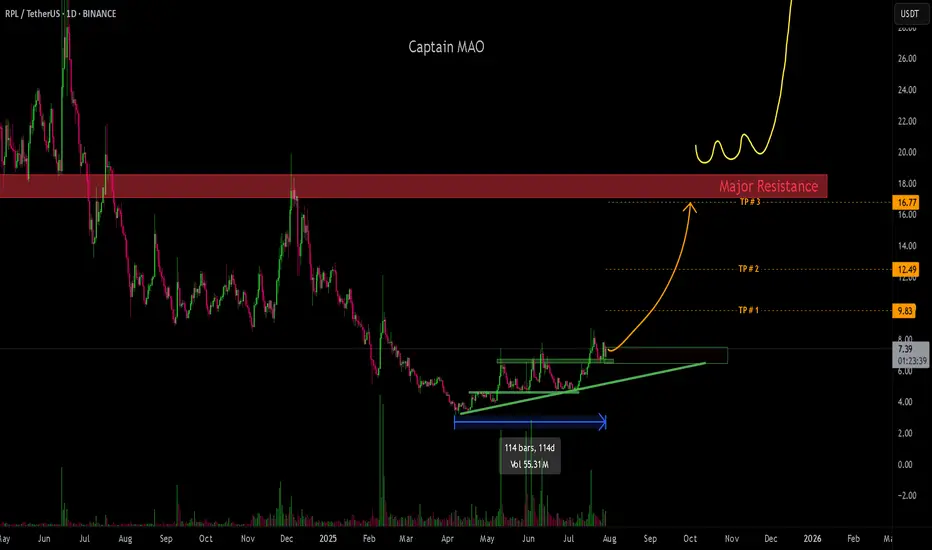
RPLUSDT 1D#RPL is currently sitting on a key support zone, which is further strengthened by the daily EMA200. If the daily candle closes above this zone, we expect the bullish momentum to continue. In that case, the potential upside targets are:
🎯 $8.64
🎯 $10.35
🎯 $12.05
🎯 $14.47
🎯 $17.55
However, if BTC dr

Using PAR 60/90 min to short blow off topsUsing PAR 60/90 min to short blow off tops. Looking at Demark pivots for pois

RPL | Waiting to Reclaim PivotRPL appears to be at a critical juncture on the weekly timeframe, having recently broken below its long-term descending trendline. The price is currently consolidating near the pivot level, which represents a key technical inflection point.
Current Setup:
Price trading below descending trendline

$RPL 4H AnalysisGETTEX:RPL 4H Analysis 🔥
RPL is currently trading at the lower boundary of a parallel ascending channel, which has acted as strong support multiple times in the past. The price action shows a clear higher high, higher low structure, indicating an ongoing uptrend.
Currently, the price is hovering a

840% Rocket Pool—500% Potential Profits @$30 Conservative TargetI found a good chart setup. Rocket Pool peaked its initial bullish breakout 11-May and has been sideways for the past few weeks. The chart is showing that the retrace is over/complete.
The initial breakout, between 7-April and 11-May, produced a total of ~135% growth. This happened in a little over

$RPLUSDT broken out BINANCE:RPLUSDT has broken out! 🚀
Clean breakout from descending trendline triangle with volume.
Targeting $17.72 (+263%).
Retest zone: $4.60–$5.00
Momentum looks strong, don’t sleep on this move!
DYRO, NFA

See all ideas
Summarizing what the indicators are suggesting.
Oscillators
Neutral
SellBuy
Strong sellStrong buy
Strong sellSellNeutralBuyStrong buy
Oscillators
Neutral
SellBuy
Strong sellStrong buy
Strong sellSellNeutralBuyStrong buy
Summary
Neutral
SellBuy
Strong sellStrong buy
Strong sellSellNeutralBuyStrong buy
Summary
Neutral
SellBuy
Strong sellStrong buy
Strong sellSellNeutralBuyStrong buy
Summary
Neutral
SellBuy
Strong sellStrong buy
Strong sellSellNeutralBuyStrong buy
Moving Averages
Neutral
SellBuy
Strong sellStrong buy
Strong sellSellNeutralBuyStrong buy
Moving Averages
Neutral
SellBuy
Strong sellStrong buy
Strong sellSellNeutralBuyStrong buy
Displays a symbol's price movements over previous years to identify recurring trends.