$SOLANA 250+ or bearish trend to 225/200With the recent solana pump, major profits have been taking place.
However, SOL stopped out at 249. Just under the Psychological level of 250.
On this chart we can see the following:
- Supply & Demand
- Anchored Volume
- Pattern: BF / BC /SR
- Two 4 hour FVG's below price, with HTF GP on the seco

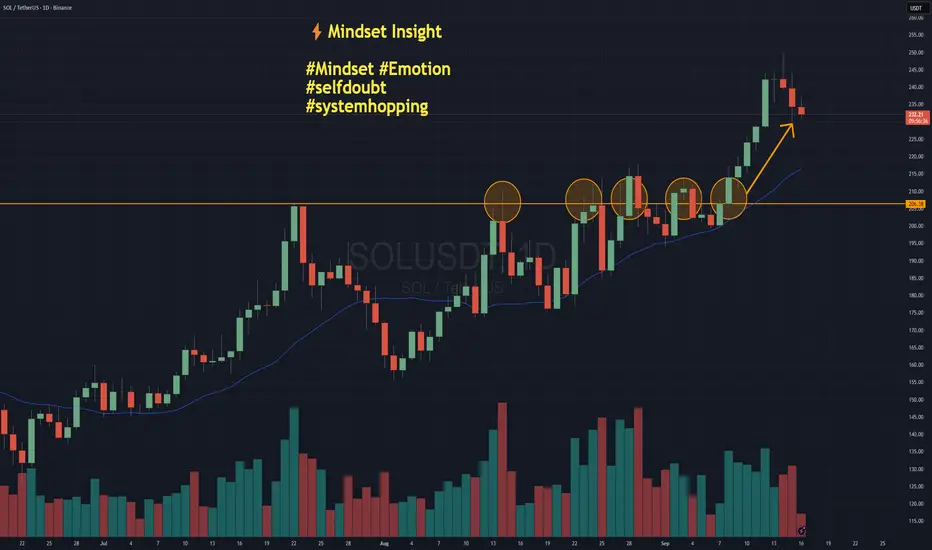
System Hopping - The Hidden Cost of Self-DoubtNOTE – This is a post on Mindset and emotion. It is NOT a Trade idea or strategy designed to make you money. If anything, I’m taking the time here to post as an effort to help you preserve your capital, energy and will so that you are able to execute your own trading system as best you can from a pl
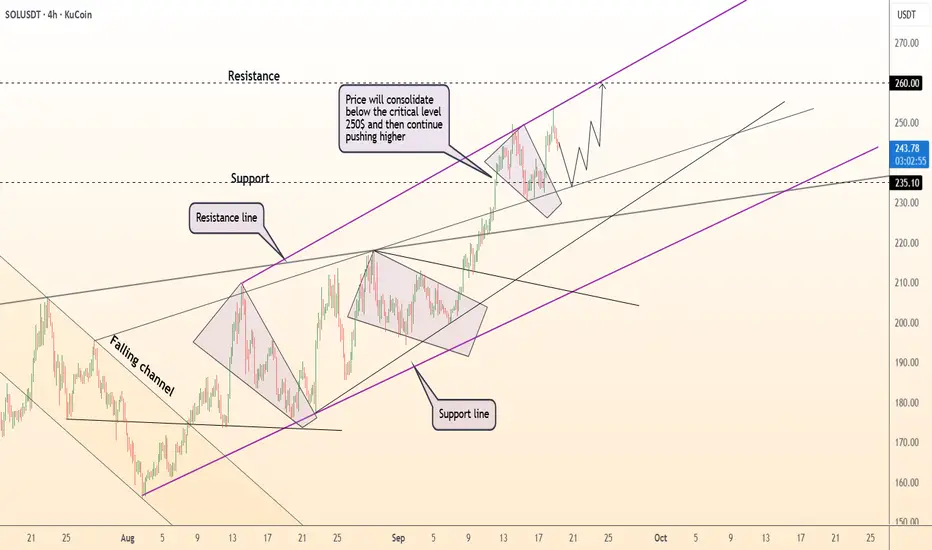
DeGRAM | SOLUSD seeks to the $260 level📊 Technical Analysis
● SOL/USD maintains a rising channel, consolidating just below the $250 resistance after strong rallies from $200 support.
● Structure suggests a bullish continuation, with a breakout targeting $260 if buyers defend $235–$240 as short-term support.
💡 Fundamental Analysis
●
SOLUSDT under Bearish Pressure.SOL remains under bearish pressure after showing divergence on both MACD and RSI, signaling potential weakness despite holding near recent highs.
Key Levels:
Immediate support at 232.6 (Fib 0.618).
If broken, deeper downside targets lie at 218–215, with extension toward 210–206 zone.
Resistance

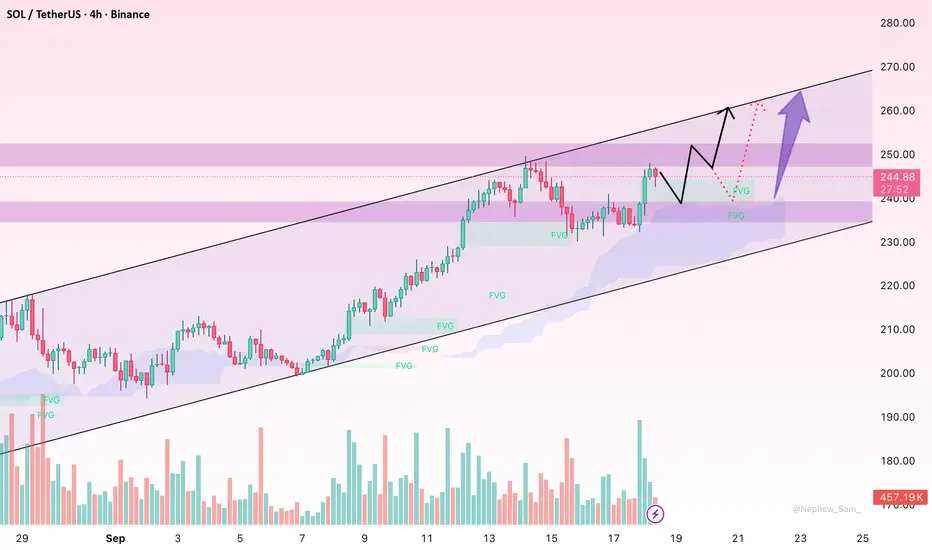
SOL/USDT: Correction or Ready for Further Upside?Hello everyone, today I’d like to share a brief analysis of Solana (SOL) and the current market dynamics.
Currently, Solana is experiencing a slight pullback after a strong rally in recent weeks. During this phase, Fair Value Gaps (FVGs) are forming, which could provide potential opportunities for

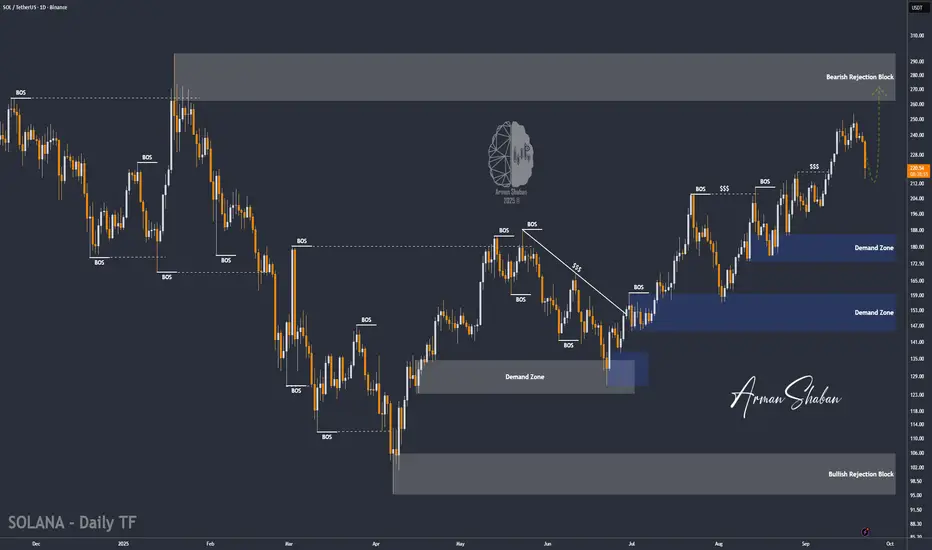
SOL/USDT | Solana at $220.5 – Bulls Preparing for Next Rally!By analyzing the Solana chart on the daily timeframe, we can see that, as expected, the price started a correction and entered the $220 demand zone. After that, some buying pressure appeared, and SOL is now trading around $220.5.
If the price can hold above this level, we can expect the start of th
SOL/USDT: Keep Rising or Time for a Correction?Hello everyone, recently SOL/USDT has seen a strong upward movement, and now it’s at a quite sensitive price zone. The big question now is: will the uptrend continue, or is the market due for a correction before pushing further?
On the chart, SOL is still holding above the Ichimoku cloud, a sign th
Solana Eyes 14% Upside, Approaching $275 Breakout Target SoonHello✌️
Let’s analyze Solana’s price action both technically and fundamentally 📈.
🔍Fundamental analysis:
The SIMD-0326 upgrade could cut Solana’s block finality to just 150ms, possibly bringing big traders and fresh capital. But new validator fees might be tough on smaller player
📊Technical

SOLANA ??sooo this is how i think write comment and let me know your idea
i dont use so many pattern and i thing its better to make levels and wait till they brake just using dynamic and static lines is enough BUT also you need to analyse candle by candle with EYES and use some basic candle patterns like pin

SOLUSDT → Correction amid a strong bullish trend BINANCE:SOLUSDT , after updating its next high, formed a false breakout of local resistance and returned to the trading range as part of a correction. What to expect from altcoin?
The main driver of the crypto market, Bitcoin, is consolidating above 115K and facing fairly strong resistance at

See all ideas
Summarizing what the indicators are suggesting.
Oscillators
Neutral
SellBuy
Strong sellStrong buy
Strong sellSellNeutralBuyStrong buy
Oscillators
Neutral
SellBuy
Strong sellStrong buy
Strong sellSellNeutralBuyStrong buy
Summary
Neutral
SellBuy
Strong sellStrong buy
Strong sellSellNeutralBuyStrong buy
Summary
Neutral
SellBuy
Strong sellStrong buy
Strong sellSellNeutralBuyStrong buy
Summary
Neutral
SellBuy
Strong sellStrong buy
Strong sellSellNeutralBuyStrong buy
Moving Averages
Neutral
SellBuy
Strong sellStrong buy
Strong sellSellNeutralBuyStrong buy
Moving Averages
Neutral
SellBuy
Strong sellStrong buy
Strong sellSellNeutralBuyStrong buy
Displays a symbol's price movements over previous years to identify recurring trends.