Bio swing trade bio has a good entry today
entry: ±2% from 0.154
tp: 0.20 – 0.32
nb: don’t put all your funds in one basket
BIOUSDT.P trade ideas

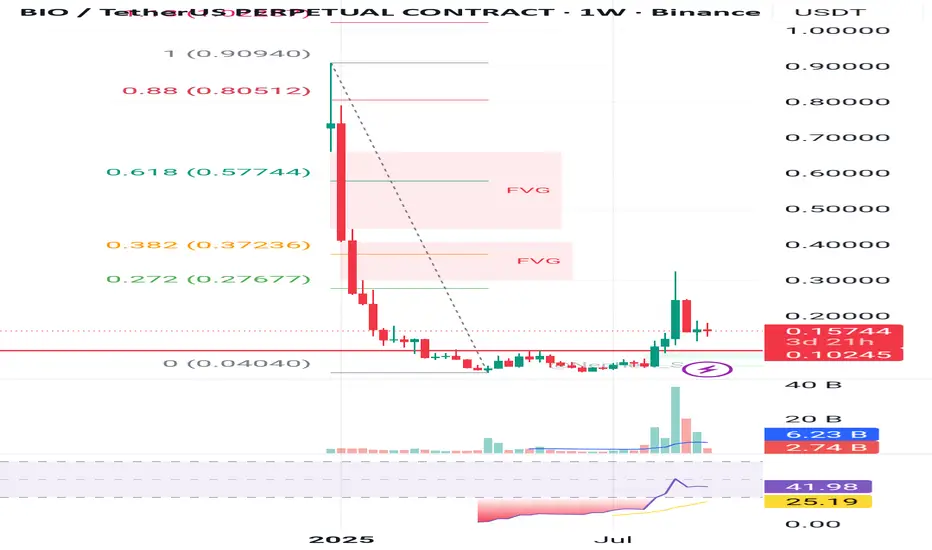
Bio 2nd roundBio is starting engine to bounced back.
Confluence
target price 1: 0.65
2nd tp : fibo 0.88
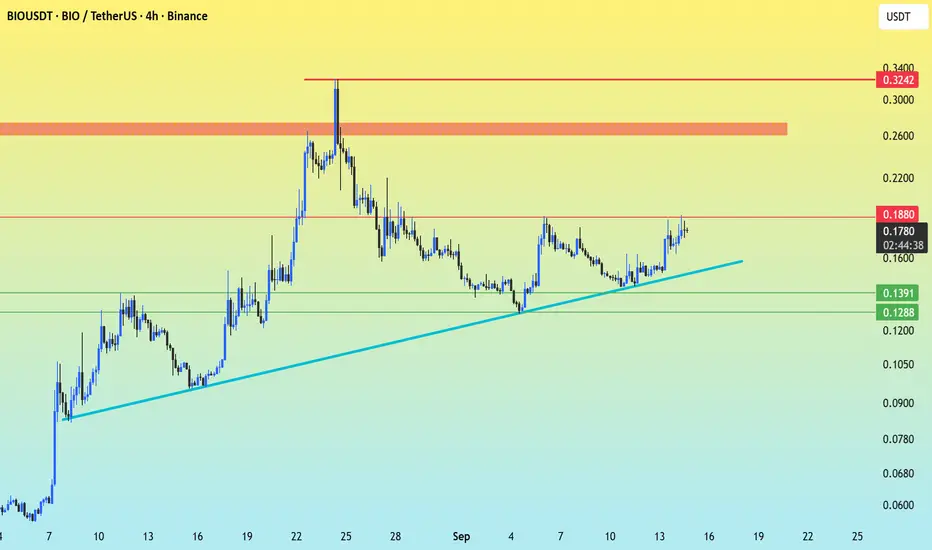
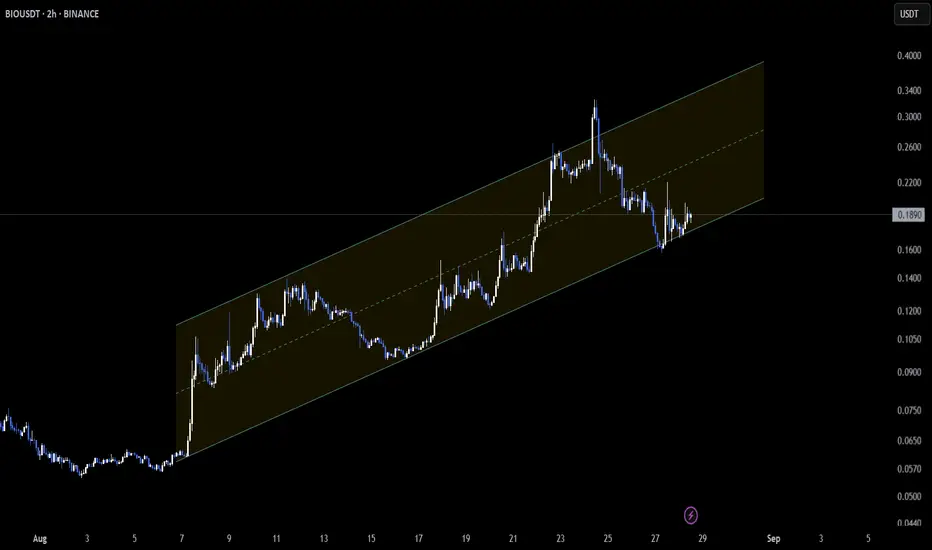
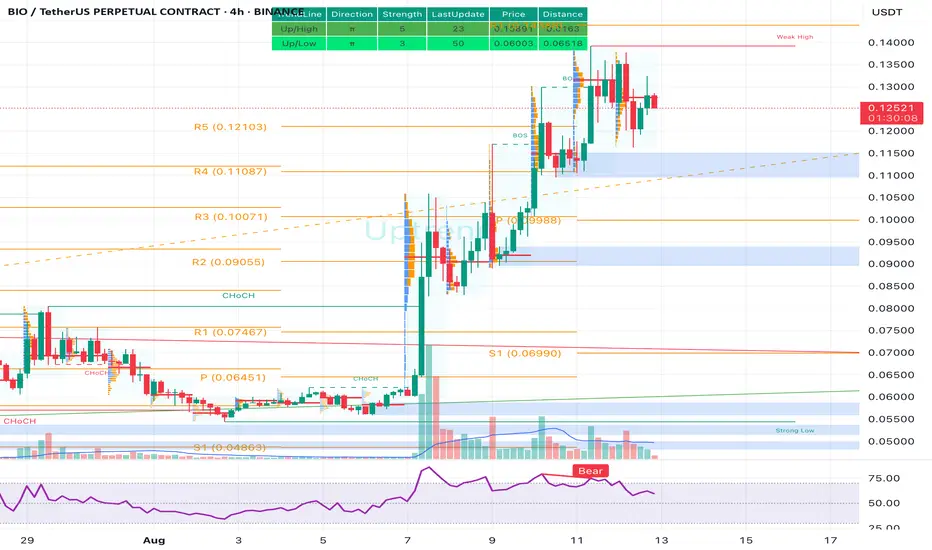
BIO/USDT Technical (4H Chart)The asset is currently in an uptrend, supported by a rising blue trendline. This indicates strong buyer interest and a potential continuation of the bullish move—unless the trendline is broken.
Bullish Case:
A breakout above $0.1880 with strong volume could lead to a rally toward $0.22 and possibly $0.32.
As long as the ascending trendline holds, the bullish structure remains intact.
Bearish Case:
A breakdown below the trendline and $0.1298 support could trigger a correction toward $0.1181 or lower.
Weak volume near resistance may signal exhaustion among buyers.
BIOUSDT Elliott Wave OutlookBIOUSDT has successfully completed the projected Wave 3 rally, with price now approaching a strong support zone to finalize the corrective Wave 4. From here, we anticipate another strong rally to unfold, targeting the provided zone for the last leg (Wave 5) of the current cycle.
Our previous analysis nailed the Wave 3 movement with precision ✅.
👉 Check it out here:
Now the question is will Wave 4 hold at this demand zone to fuel the final push?
🔹 Share your thoughts about BIOUSDT in the comments your views matter!

Short again, liquidity takenThese are my thoughts, based on my knowledge on technical analysis, this is not financial advice.
I still believe that we will reach 0.15 soon, going short again

BIO/USDT - Long Entry | Smart Risk Management + Big Targets🚀 Trade Setup Details:
🕯 #BIO/USDT 🔼 Buy | Long 🔼
⌛️ TimeFrame: 1H
--------------------
🛡 Risk Management (Example):
🛡 Based on $10,000 Balance
🛡 Loss-Limit: 1% (Conservative)
🛡 The Signal Margin: $783.7
--------------------
☄️ En1: 0.1556 (Amount: $78.4)
☄️ En2: 0.1487 (Amount: $274.3)
☄️ En3: 0.144 (Amount: $352.67)
☄️ En4: 0.1394 (Amount: $78.4)
--------------------
☄️ If All Entries Are Activated, Then:
☄️ Average.En: 0.1465 ($783.7)
--------------------
☑️ TP1: 0.1738 (+18.63%) (RR:1.46)
☑️ TP2: 0.1888 (+28.87%) (RR:2.26)
☑️ TP3: 0.2097 (+43.14%) (RR:3.38)
☑️ TP4: 0.2397 (+63.62%) (RR:4.99)
☑️ TP5: 0.2778 (+89.62%) (RR:7.02)
☑️ TP6: Open 🔝
--------------------
❌ SL: 0.1278 (-12.76%) (-$100)
--------------------
💯 Maximum.Lev: 4X
⌛️ Trading Type: Swing Trading
‼️ Signal Risk: 🙂 Low-Risk! 🙂
--------------------
🔗 www.tradingview.com
❤️ Your Like & Comments are valuable to us ❤️

Road to 0.15?This is pure technical analysis, these are just my thoughts, this is not an invest advice.

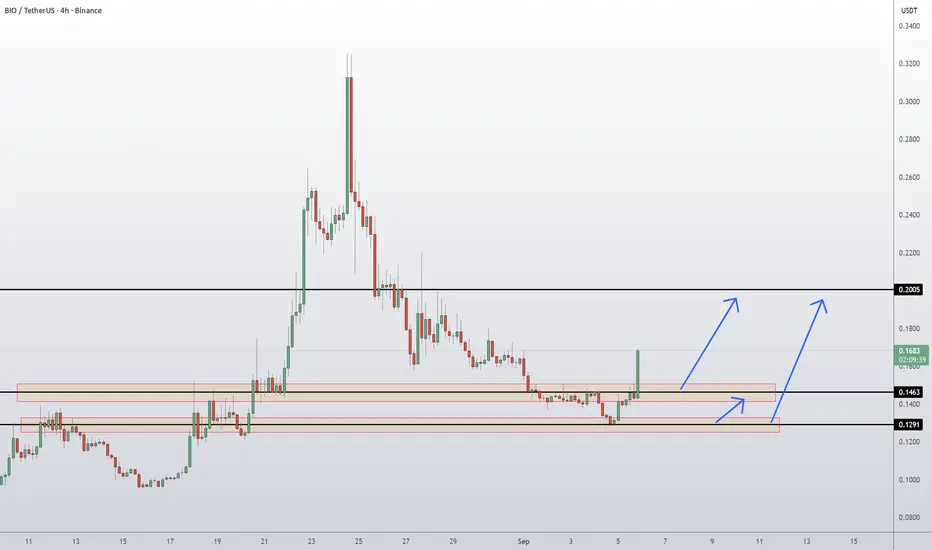
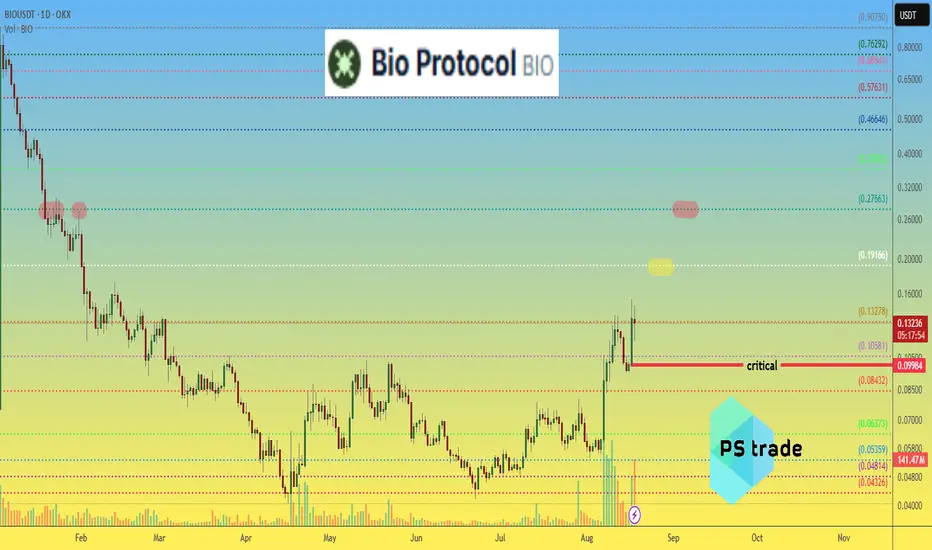
BIO Coin Bio Protocol Token- Price Prediction and Technical AnalBIO/USDT has recently bounced strongly from the 0.1291 demand zone, showing renewed bullish momentum after a prolonged decline. Price has reclaimed above the 0.1463 resistance level, which is now acting as short-term support. If this breakout sustains, the next upside objective lies at the 0.2005 resistance zone, where sellers are likely to reappear. However, if price slips back under 0.1463, a retest of the 0.1291 demand base could unfold before another attempt higher.
📈 Key Levels:
Buy trigger: Rejection bounce from 0.1463 or 0.1291 support zones
Buy zone: 0.1291 – 0.1463 region
Target: 0.2005 resistance
Invalidation: Daily close below 0.1291 (would weaken bullish structure)
👉 Follow me for More Real Time Opportunities.
Share your Thoughts if you have any?
Push and downLooking up to a retracement to a 5 min chart breaker, then maybe a downfall to 0.1630. These are my thoughts, based on my knowledge on technical analysis, this is not financial advice.
BIO – Testing Ascending Channel Support📆 On the 4H timeframe, NYSE:BIO is sitting right on the ascending channel support, showing early signs of strength at this level 🛡️.
This zone has acted as a pivot in previous swings, so whether it holds or breaks will likely dictate the next strong move.
A bounce here could confirm trend continuation, while a breakdown risks invalidating the current channel structure ⚠️.
👀 Critical support test — watch closely for confirmation before reacting.
Not financial advice.
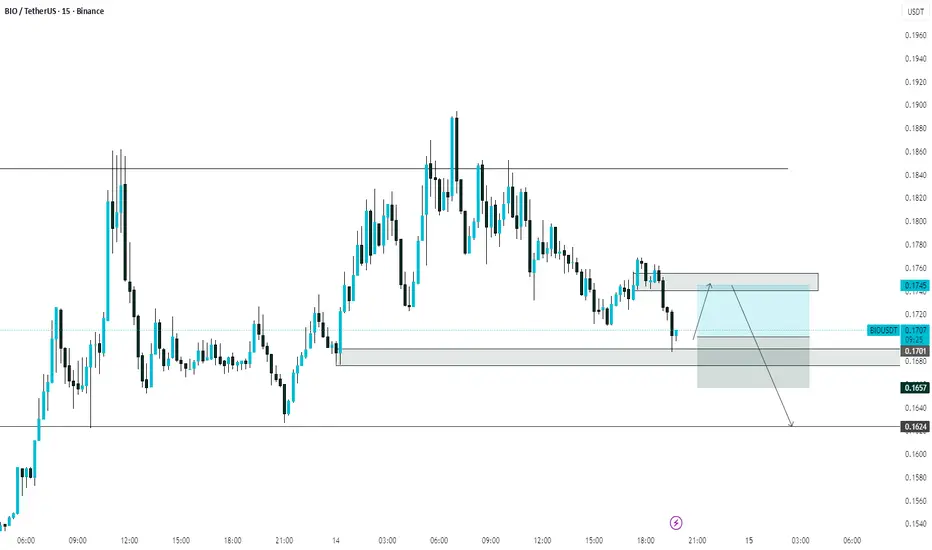
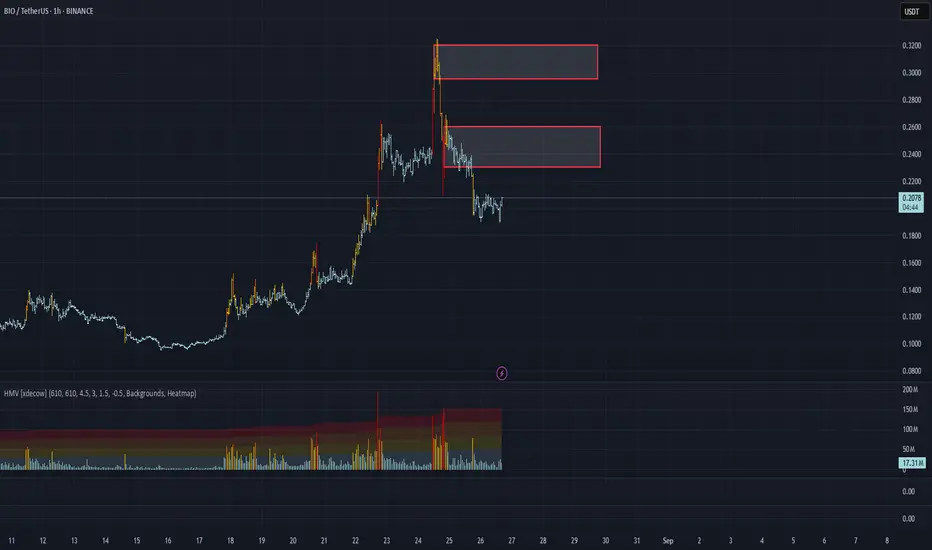
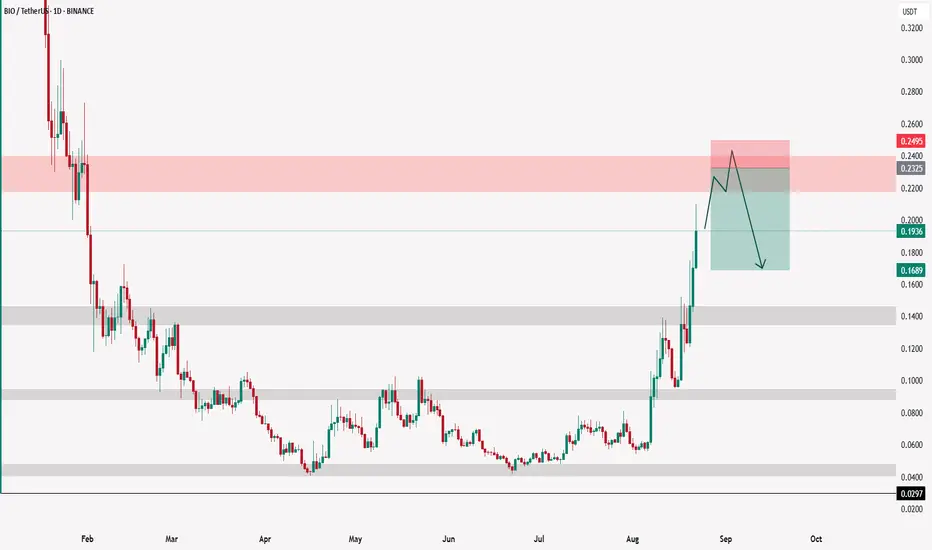
BIO/USDT Analysis. Short Setup
This asset has shown a trend break. Above the current price, there are volume zones that have already received positioning. If one of them is tested and we see a reaction, we consider short entries. Target potential — ~$0.17.
Sell Zones:
$0.23–$0.26
$0.295–$0.32
*This post is not financial recommendation. Make decisions based on your own experience.
BIOUSDT Reversal Structure Forming at Demand ZoneBIO is currently reacting from a key immediate demand zone following a falling wedge structure. This setup suggests a potential trend reversal, especially with price holding above the $0.06 base.
We're eyeing a breakout toward the first target at $0.1039, with further continuation possible to $0.1725 if bullish momentum sustains. Failure to hold the current zone could send price lower toward the strong demand zone around $0.0405–$0.0480 for another buy opportunity.
Structure looks promising keep this on your radar.

BIO protocol price analysis📉 While the market is going through a correction phase, it's worth paying attention to coins that show resilience… or even push upward 💪
💥 One of the clearest examples is $BIO. The current price action signals strength — especially in contrast to the general downtrend across the market 🔻
🗓 We first highlighted OKX:BIOUSDT back on April 17, when we noticed the first signs of increased trading volumes. But the current volumes are significantly higher 🚀
🎯 Our previously mentioned targets from April remain valid:
• Mid-term target: $0.18–0.19
• Main target: $0.27–0.30
⚠️ Key support zone: $0.10 — a breakdown below this level would invalidate the current bullish structure.
⁉️ Are you still holding your #BioProtocol tokens — either from the airdrop or from early buys at higher prices? Let us know in the comments 👇
📌 Not financial advice — just personal opinions. Always DYOR.
_______________
◆ Follow us ❤️ for daily crypto insights & updates!
🚀 Don’t miss out on important market moves
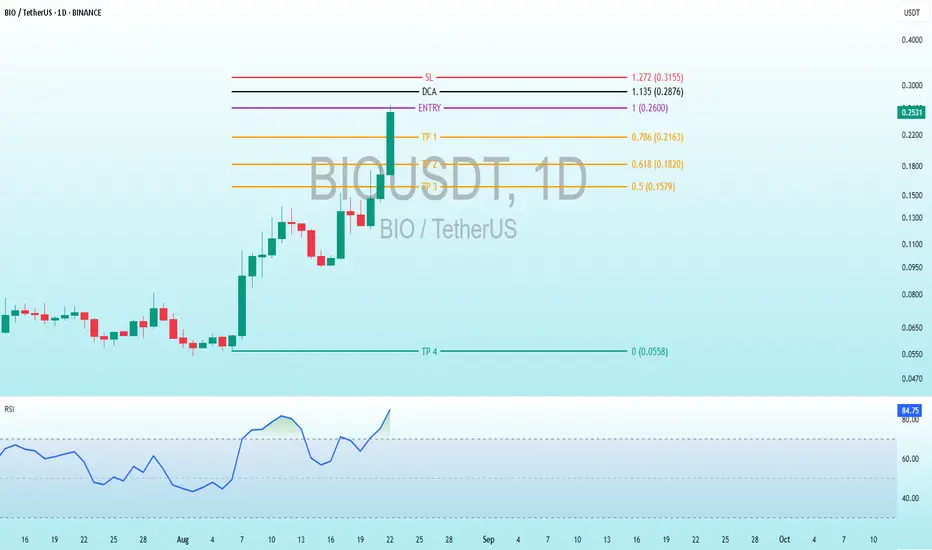
$BIO 1D Trading Explosion - Unlock Key Levels & RSI SecretsBINANCE:BIOUSDT
Key Levels (marked with lines):
SL (Stop Loss): 1.272 (0.3155 USDT) - A level to close the position at a loss.
DCA (Dollar Cost Averaging): 1.135 (0.2876 USDT) - A level for additional purchases if the price drops.
Entry (Entry Point): 1 (0.2600 - 0.2570 USDT) - The price where the position was opened.
TP1: 0.786 (0.2163 USDT) - The price where the position was opened.
TP2: (Take Profit 1): 0.618 (0.1820 USDT) - The first profit target.
TP3: 0.5 (0.1579 USDT) - The second profit target.
TP4: 0.0558 (no specific price marked, but it is a low profit level).
Price Movement:The price had a noticeable increase up to the entry level (0.786), but then experienced a sharp decline, approaching the TP levels.
The latest candlestick is green, suggesting a positive daily close, but it is still far from previous highs.
RSI Indicator (Relative Strength Index):RSI is around 85.13, indicating an overbought condition. This suggests that the price may be overextended and could see a reversal or consolidation.
Interpretation:Strategy: The chart suggests a trading strategy with an entry at 0.786, with profit targets (TP) and a stop-loss (SL) for risk management. The DCA level indicates a plan for additional purchases if the price drops.
Current Status: With a high RSI and the price near TP1, it might be time to take profits or monitor for a potential pullback.
Risk: The SL level is relatively high, suggesting tolerance for losses, but the risk increases if the price continues to drop toward DCA.
BIO CON PRICE ANALYSIS AND POSSIBLE TRADE IDEAS !!NYSE:BIO Coin Update 🎣.
• Currently NYSE:BIO Coin Price trading in overbought zone on LTF's and HTF's.
• If you get bearish confirmation right now or Until it's Price trading below 0.23$ ( Daily resistance) then you are able to execute quick short scalp on it. ( with tight SL)
• Personally if i take trade then i will update✅
Warning : That's just my analysis DYOR Before taking any action🚨🚨
BIO UPDATE Not have to tell you how crazy thats it right? RT-Tool 3.0 is the language of the market fam

Bio Short - back to 0.0840 to 0.0940.. Shorting Bio - back to 0.0840 to 0.0940..
Bio has been rising and not retesting support. hype due exchange listing.. stuck under major resistance 0.14 and has not revisted support area 0.0840 to 0.0940... Candle sticks and pivots confirmin reversal.
BIO : BUY MARKET!!!Hello friends🙌
✅Given the good upward wave we had, the price has now corrected, providing a good opportunity to buy in steps in the specified areas with risk and capital management and move towards the specified goals.
🔥Follow us for more signals🔥
*Trade safely with us*

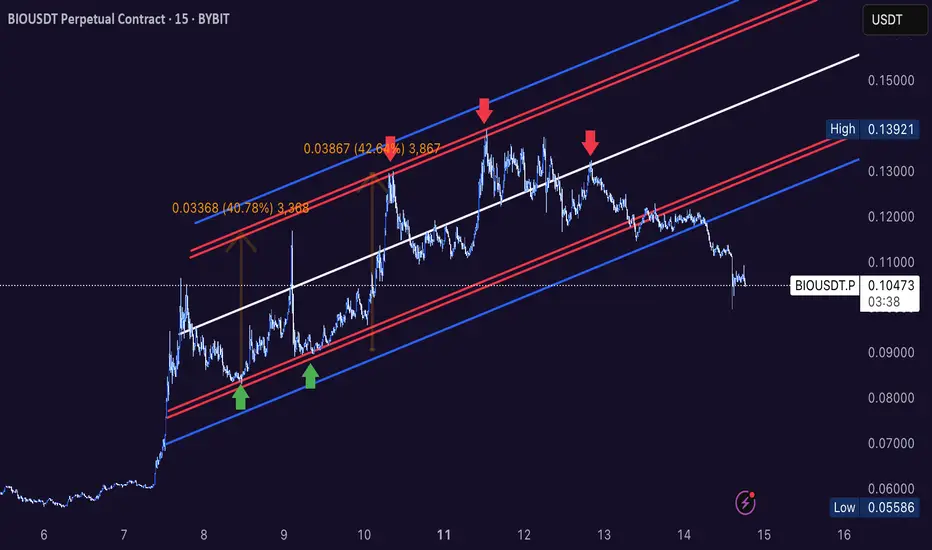
Analysis on Roids!I swear guys. i cant describe how thankful I am. we traded all 5 touches, a volatility range of at least 40% spot! Thank me that i failed a 1000 times but always stood up. Thanks to my soul that changed aura and brought me out of 90.000euro tax debt. It was all my fault fam but i told you as much as depressed I appear my fire for mastering this will only go out when I die. Nobody can take this knowledge from me thanks thanks thanks
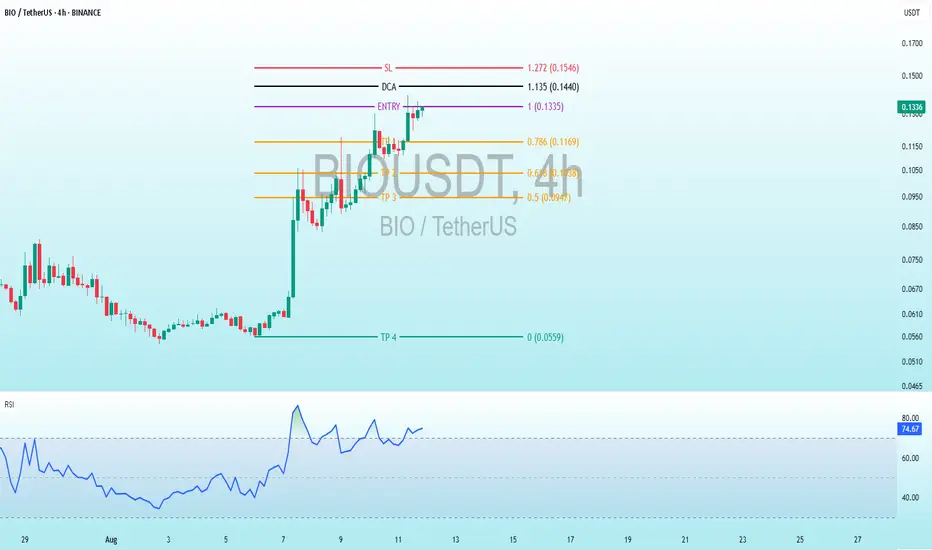
Comprehensive Technical Analysis of BIOBINANCE:BIOUSDT
Fibonacci Levels and Trading Setup
These levels appear to be Fibonacci retracement/extension levels, drawn from a low (0% at 0.0559 USD) to a high (100% at 0.1335 USD), but used for a short setup. This is unusual for an uptrend but suggests the chart creator (AltcoinPioneers) expects a decline after the pullback. Here are the detailed levels (with prices in brackets):
SL (Stop Loss, red): 1.272 (0.1546 USD) – Extension level above 100%, where the position closes if the price rises further (maximum risk).
DCA (black): 1.135 (0.1440 USD) – Possibly a level to add to the short (average down) if the price rises slightly, to lower the average cost.
ENTRY (purple): 1 (0.1335 USD) – Entry level for short (sell). The current price is very close (0.1310), so it might be active or pending.
TP1 (orange): 0.786 (0.1169 USD) – First Take Profit, a retracement level.
TP2 (orange): 0.614 (0.1038 USD) – Second TP, near the golden ratio (0.618).
TP3 (orange): 0.5 (0.0947 USD) – Third TP, half of the range.
TP4 (green?): 0 (0.0559 USD) – Final TP, at the previous low.
RSI Indicator Analysis
Current Value: Around 70-73, with the blue line peaking at ~80 and now slightly declining.
RSI Trend: Started from ~30 (oversold) during the price decline, rose sharply with the upward impulse (indicating bullish momentum), but is now in the overbought zone (>70). This signals the asset might be "overpriced" in the short term, and a correction downward is possible (bearish divergence if the price doesn’t confirm upward movement).
Interpretation: An RSI above 70 often precedes a pullback or bearish reversal, especially on a 4h timeframe. If it falls below 50, it confirms weakness.
BIOUSDT - Long*BIOUSDT CMP - $0.1122 / Positional Trade*
*Buy Range $0.1122 - $0.12 / Strict Stop Loss $0.05600*
Target 1 - $0.20
Target 2 - $0.25
Target 3 - $0.30 / $0.40 / $0.50 +
Disclaimer: This is my view and for educational purpose only.

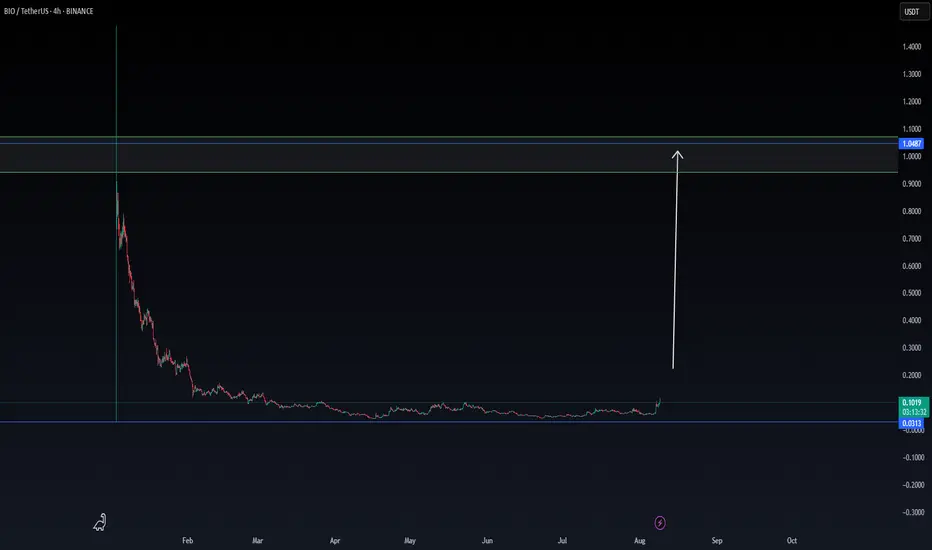
BIO THE next hype coin that can return up $1There is a high chance BIO is going to return up $1
We will follow to see if this is going, depending Data
The coin is now moving between $0,09 and $0,10
Data shows that this coin has the volume power to break back to $1 , next targets could be $0,25 and $0,43
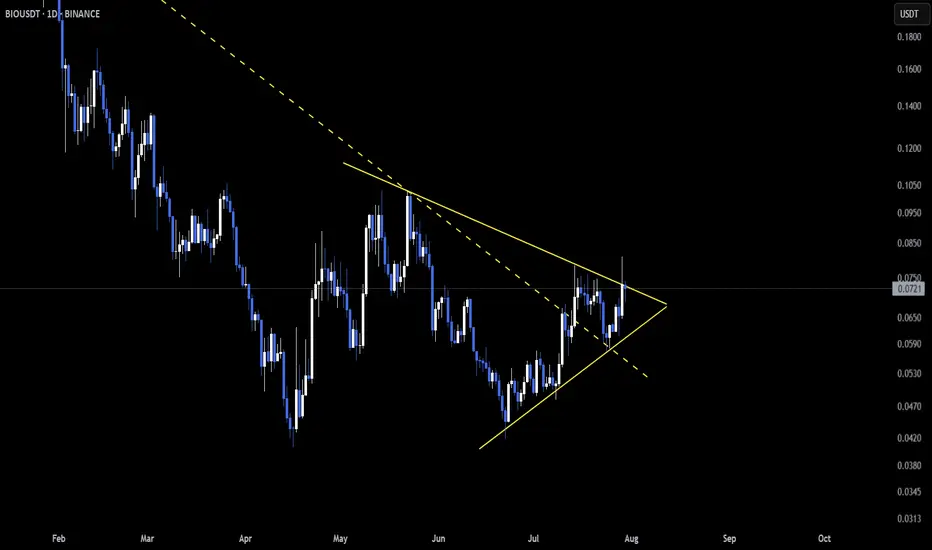
$BIO – Symmetrical Triangle Breakout WatchNYSE:BIO is pressing against the upper boundary of a symmetrical triangle on the daily timeframe 🔺
The structure has tightened significantly, indicating potential for a breakout ⚡
If price closes above resistance with volume, it may signal the start of a bullish leg 🚀
This is a key inflection point — closely watching for confirmation 👀