Gold "Breakout" - Dollar Tank EditionBought some GLD this morning because I couldn't think of any other play, and I'm watching the market drop and bond yields rise. Then I look at the dollar index and saw it dropping too. The Euros are selling off all US assets, that's why the drop happened between midnight and noon.
The 2% "pump" wasn't really a pump, the dollar dropped 2% this morning. (Though there was a 0.5% actual pump before close.)
Gold (in dollars) will break out if the dollar index drops below support (I posted a chart). I've been looking for a high confidence big trade, I'm going big on gold if the dollar loses support, and that can happen as early as tomorrow. Keep an eye on the dollar index, I'll be at work so I will not be posting my trade entry.
Note that it's not really a breakout, if you look at gold futures in Swiss francs, it's not even near the top. Also, this trade does not apply to people trading in other currencies like Euros or yens.
I think Trump ruined confidence in the dollar, the US market, and bonds. If that's the case, then gold is the way to go.
XAUTRY1! trade ideas

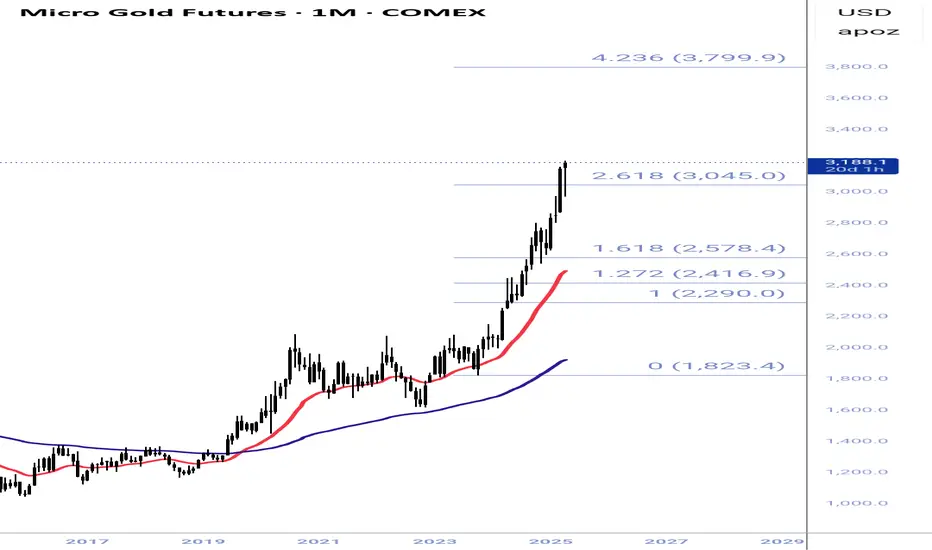
Gold - The Blow Off TopAs gold hit a high today I took a look at the chart. Incredible run going back many years. But what goes up must come down. Based on a Fib-extension we can see where price has hit resistance and turned it into support. It happened at 1, 1.272, 1.618, and briefly at 2.618. It has remarkably pushed through that. So in my studies of markets and fibonacci I've found that 4.236 often times bring about the top on a parabolic move. So by following that logic I would put the top, at least a local one, at $3,800. Roughly 25% from here. Anyways, that's my 2 cents on Gold. Happy trading.
Short trade
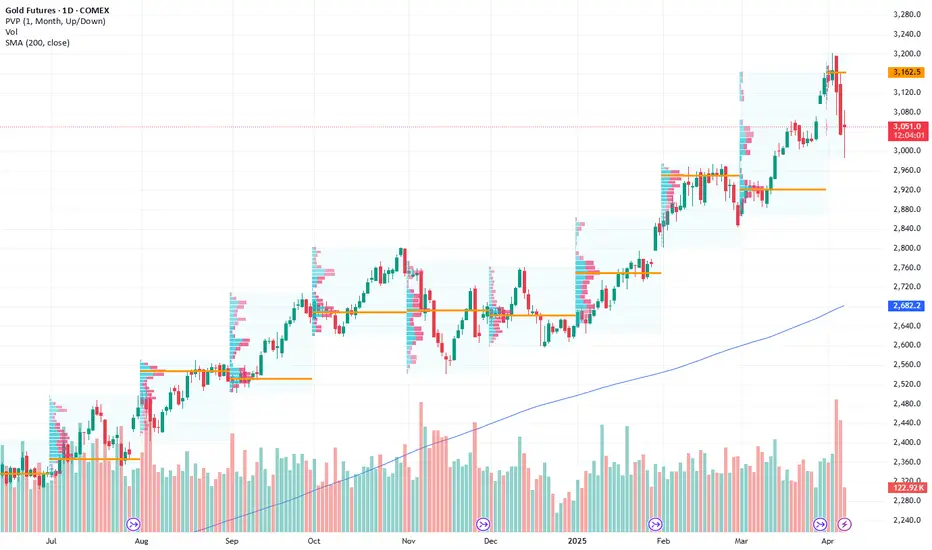
📉 Trade Breakdown – Sell-Side (CG1! Futures)
📅 Date: Thursday, April 10, 2025
⏰ Time: 11:45 AM (New York Time)
🕒 Session: London to NY Overlap – Late NY AM
📉 Pair/Instrument: CG1!
📈 Trade Direction: Short (Sell)
Trade Parameters:
Entry: 3179.7
Take Profit (TP): 3149.7 (–0.94%)
Stop Loss (SL): 3186.0 (+0.20%)
Risk-Reward Ratio (RR): 4.76
Reason: Observing exhaustion in a rally before NY closes liquidity window with a price sweep into high (supply zone) signalling a reversal.

Gold4 10 25 this is a relatively short video 15 minutes maybe a little bit more looking at the dollar and looking at Gold. I think gold is getting ready to go higher and it's because of a pattern that developed last night. the way the bars are moving and expanding is triggering a belief for me that the market is going higher. there are reasons why it might go lower since it's in a Range box. the dollars going lower the Gold's going higher you have 1 or 2 bars that make incredible swings and those swings are bi-directional in that one goes up by a lot and then the next bar goes down by a lot..... this is because it's an expanding Market that makes money for buyers and sellers and expanding markets can be very stressful because they make big changes and then on the next bar you get a big change in the other direction.... so you have to think a little bit differently and count on what you think where both sides of the market.... the buyers and the seller and know where they are. if there's 1 point that I think is very important and that is that the 2 bar reversal when the market was at support is really where you would take the best trade based on the way I look for opportunity in a market and it's important to look at where that is and what it looks like because it makes a total difference and how your experience with your entries will change for the better.

GOLD MCX MINOR RESISTANCEGOLDMCX
Gold Mcx has seen huge bull run today on 10th April 2025 (Thursday), Looking at the chart it can be clearly seen yellow metal on MCX is trading in upwrad trending channel pattern and around 92400-92500 Channel Pattern Resistance can be observed. There can be some profit booking seen from current levels, One can get out of long positions and reenter long position once GoldMCX closes above 92500, till then book profits on Long positions, or sell Gold MCX with Small stoploss of 92600

GC heading down againGold is respecting the 2-2.5 stdv like clockwork. After reaching 3130 I expect gold to return down to first 3034, and then eventually down to 2959. This will retrace back to fib 0 for the original manipulation legs as showed on chart. There is also an RSI div on 1H

Short XAU (Gold) Gold Futures are showing a very clean impulsive move through Elliot Wave TA. You can see the running flat on the 2nd wave leading to a very strong move on the Wave 3 major move. The Wave 5 is shorter than the Wave 3 to confirm the possible completion of this 5 Wave move up.
A weaker DXY (USD) is throwing an obstacle to this beautiful setup. Let's see some stability to the bonds market which should lead to stability in the equities market. This should help propel traders taking profits on this Gold rush.

GC Swing Short Trade idea based on supply and demand, intermarket analysis and cross market valuation. Following a structured approach with clear entry, risk management, and confluence factors.

Weekly Market Analysis - 9th April 2025Here we are with another market analysis. This time, a bit late in the week on a Wednesday, but it is what it is! We have CPI today and PPI tomorrow, so this should be an interesting week. Overall, gut instinct tells me we would be pushing lower for the DXY, but again, i'm not betting anything on it. I trade the candles, I trade the structure, I don't trade guesses.
I hope you find the video analysis useful. Take care this week!
- R2F Trading

Likely bottom values-SUB 30 SILVER at 100 GSR-BACK THE TRUCKStocks are pulling the entire market, every sector, down, as it approaches a final 4 year cycle low. Here are the criteria most probable to be met in anticipating a bottom

Gold Longs 8/4/25Testing longs from this weekly buyside imbalance sellside inefficiency. H4 Inversion FVG targeting buyside liquidity

We might get a play on Gold soon! Been waiting for price to come for these levels for almost a month now. Now that we are finally here I'm just trying to keep my cool and wait for things to line up inside of the killzone. We could get a nice bullish swing here. We just have to wait for price to show us thats what it wants to do.

GC1!: Buy ideaGold is in an oversold zone, as indicated by our RSI indicator. Therefore, we should expect a rise.

Inverse Head And ShouldersGold has a clear IH&S(Inverse Head & Shoulders. It shows gold will move upwards all the way to 3200.

Gold Is Trading Near Record Highs. What Does Its Chart Say?Gold TVC:GOLD hit a record high recently on global trade tensions before pulling back following release of President Donald Trump’s tariff plans. What does fundamental and technical analysis say could be next for the precious metal?
Let’s check it out:
Gold’s Fundamental Analysis
The Atlanta Federal Reserve Bank recently revised its well-known GDPNow model for first-quarter gross domestic product to a -2.8% seasonally adjusted annual rate.
However, the bank also estimated Q1 GDP at just -0.8% when adjusted for rising U.S. gold imports vs. exports.
Wait a minute! Do you mean that the Atlanta Fed runs two GDP models -- one that includes the cross-border gold trade and one that doesn’t? Yes, I do.
U.S. gold exports have been rising because some of the world’s central banks -- most notably, China and Russia’s -- have become large net buyers of physical gold.
Both countries are members of the so-called “BRICS” -- a group of non-Group of Seven nations like Brazil, Russia, India, China and South Africa (hence the “BRICS” name).
The BRICS have often hinted at creating some kind of a monetary union that would produce a single currency to rival the U.S. dollar’s current status as the world’s “reserve” form of cash.
This new BRICS form of money could either exist alongside each country’s own national currency or actually replace them (along the lines of what happened with the European Union’s creation of the euro).
Now, EU nations participating in the single-currency zone have had to largely surrender their monetary sovereignty. That's something I really could never see China, Russia, India or Brazil being willing to do.
That said, there’s talk of the BRICS creating something like the International Monetary Fund’s Special Drawing Rights. But unlike SDRs, the BRICS would back their new currency by a hard asset like gold. That could put the U.S. dollar on the defensive.
Such a currency could become the preferred unit of trade for global commodities, or at least some global commodities between certain trading partners.
Gold’s Technical Analysis
Coupled with all of the recent global trade tensions, the central-bank purchases have created incredible demand for gold – boosting the metal’s price. Let’s the chart for check out Comex gold futures COMEX:GC1! going back to September 2022 and running through midweek last week:
Readers will see in this chart of Comex front-month gold futures (presented in the form of one continuous contract) that the metal been in a steady uptrend for more than 2-1/2 years. I’ve captured this in a Raff Regression model above.
After testing the model’s lower bound for much of late 2023/early 2024, gold recently brushed up against the model's upper trendline, then broke out.
Not surprisingly, Comex gold’s Relative Strength Index -- the gray line at the chart’s top -- is now rather strong and even close to technically overbought territory (above 70).
That’s historically where gold futures weaken briefly prior to pushing even higher. (Obviously, past performance is no guarantee of future results.)
Meanwhile, the Comex contract’s daily Moving Average Convergence Divergence index (or “MACD,” marked with gold and black lines and blue bars at the chart’s bottom) looks very bullish.
The 9-day Exponential Moving Average (or “EMA,” marked with blue bars) is above zero, as is the 12-day EMA (the black line) and 26-day EMA (the gold line). The 12-day line is also above the 26-day line. All of that is typically positive when charting a security.
Also note that this contract has been above all three of its key moving averages since testing the 21-day EMA (denoted with a green line above) on March 13.
Additionally, the contract has been solidly above both its 50-day Simple Moving Average (or “SMA,” marked with a blue line above) and its 200-day SMA (the red line) going back to mid-January.
That sort of set-up will often slow down portfolio managers who might otherwise be thinking about reducing their overall gold exposure.
(Moomoo Technologies Inc. Markets Commentator Stephen “Sarge” Guilfoyle owned gold ETF shares and physical gold at the time of writing this column.)
This article discusses technical analysis, other approaches, including fundamental analysis, may offer very different views. The examples provided are for illustrative purposes only and are not intended to be reflective of the results you can expect to achieve. Specific security charts used are for illustrative purposes only and are not a recommendation, offer to sell, or a solicitation of an offer to buy any security. Past investment performance does not indicate or guarantee future success. Returns will vary, and all investments carry risks, including loss of principal. This content is also not a research report and is not intended to serve as the basis for any investment decision. The information contained in this article does not purport to be a complete description of the securities, markets, or developments referred to in this material. Moomoo and its affiliates make no representation or warranty as to the article's adequacy, completeness, accuracy or timeliness for any particular purpose of the above content. Furthermore, there is no guarantee that any statements, estimates, price targets, opinions or forecasts provided herein will prove to be correct.
Moomoo is a financial information and trading app offered by Moomoo Technologies Inc. In the U.S., investment products and services on Moomoo are offered by Moomoo Financial Inc., Member FINRA/SIPC.
TradingView is an independent third party not affiliated with Moomoo Financial Inc., Moomoo
Technologies Inc., or its affiliates. Moomoo Financial Inc. and its affiliates do not endorse, represent or warrant the completeness and accuracy of the data and information available on the TradingView platform and are not responsible for any services provided by the third-party platform.

Consider Shorting Gold Amid Continued Volatility
- Key Insights: Gold has been experiencing significant volatility, with a recent
sell-off despite being in an uptrend. The current risk-off sentiment in the
market is leading investors towards safety and liquidity, creating downward
pressure on gold. Fed comments and inflation fears are strengthening the
dollar, further impacting gold prices negatively.
- Price Targets: For a short position next week, consider targeting a decline in
prices.
- T1: Approximately $2,950
- T2: Approximately $2,900
- S1: Approximately $3,050
- S2: Approximately $3,100
- Recent Performance: Gold’s market performance has been volatile, mirroring
broader market trends across various asset classes, including stocks and
cryptocurrencies. The initial technical uptrend for gold was short-lived,
with recent market conditions driving a significant sell-off.
- Expert Analysis: Analysts suggest a short-term bearish outlook for gold, given
the market dynamics and current economic policies. The stronger US dollar
against commodities is expected to maintain pressure on gold prices.
Although gold has served as a temporary safe haven, the rally seems
unsustainable.
- News Impact: The potential for a BRICS-backed gold currency introduces
possible shifts in financial dynamics that could affect demand and
valuations. Ongoing global inflation concerns and the dedollarization
strategy pose further complexities, emphasizing the role of geopolitical
factors in gold's market performance. Investors are advised to maintain a
cautious approach and consider gold within a diversified portfolio.
We Have direction. We wait on confirmation! GOLD!Looking for price to give is a little more indication that it wants to continue bullish. We have areas to fill on larger time frames before it gives us a stronger play for bigger moves. Just have to be patient and wait for price to give us more solid indication. As Always #NOFOMO!

GOLD - Prepare for Extreme Volatility**Week of:** April 7–11, 2025
**Status:** Parabolic Phase | Euphoria Peaking | Structure Fragile
---
## 🧠 Thesis
Gold has shifted from trending to **momentum-driven price action**. We're now in the parabolic stage of the breakout — where belief is at its highest, structure is at its weakest, and volatility becomes the release valve.
This is no longer a trend-following environment. It’s a **sentiment-pressure zone** where intraday risk expands sharply.
---
## 🔍 Key Signals
- Parabolic curve formation
- COT shows aggressive commercial selling
- Open interest is peaking with sentiment extreme
- Weak closes despite strong highs = possible exhaustion
- Structure thin above breakout zone = high whipsaw risk
---
## ⚠️ What to Expect
- Intraday **fakeouts and rejection candles**
- **Range expansion** in both directions
- Emotional breakout chasing followed by sharp reversals
- Market-wide volatility spillover if rejection confirms
---
## 🛠️ Strategy Guidance
- Avoid breakout chasing — look for **confirmation first**
- Fade emotional spikes only after rejection candles
- Focus on **tight invalidation and reduced size**
- If it holds and extends, trail stops closely — **don’t get greedy**
---
> “When price goes vertical, risk doesn’t rise gradually. It explodes.”
---
## ✅ Summary
Gold is in its most unstable phase — euphoria is priced in.
Whether this is continuation or climax, **volatility is guaranteed.**
Trade with precision, or not at all.

GOLD - WEEKLY SUMMARY 31.3–4.4 / FORECAST🏆 GOLD – 6th week of the base cycle (15–20+ weeks), nearing the end of phase 1. Market turbulence usually weighs on gold, so the sharp correction on Thursday–Friday, which wasn’t supported by any extreme or pivot forecast, didn’t come as a surprise. That’s what stop-losses are for.
⚠️ The working range of the long position from the March 3 extreme forecast to the March 19 pivot forecast in GC futures exceeded USD12K per contract. The working range from the March 24 extreme forecast to the stop was USD6K per contract. Congrats to those who entered. Special thanks to Mercury retrograde, as the March 24 extreme forecast was its midpoint. The next extreme forecast is on April 7. The next pivot forecast is on April 14.

Gold futures trend directionGold futures 88130 - is at raising flag pattern. Expected to drop down to test 86163

Gold Weekly Orderflow and Outlook for next weekExpecting more meltdown on Gold. Need rapid displacement. Retracement Market Profile. Quarterly Power of Three.


Gold 2025What does Gold have in store for us, i still believe we get a deeper correction before we continue the rally higher. The way I see the market playing out is indicated. I do think that $3000 will be a reasonable target before we probably revert to a range of $2000/$3000
