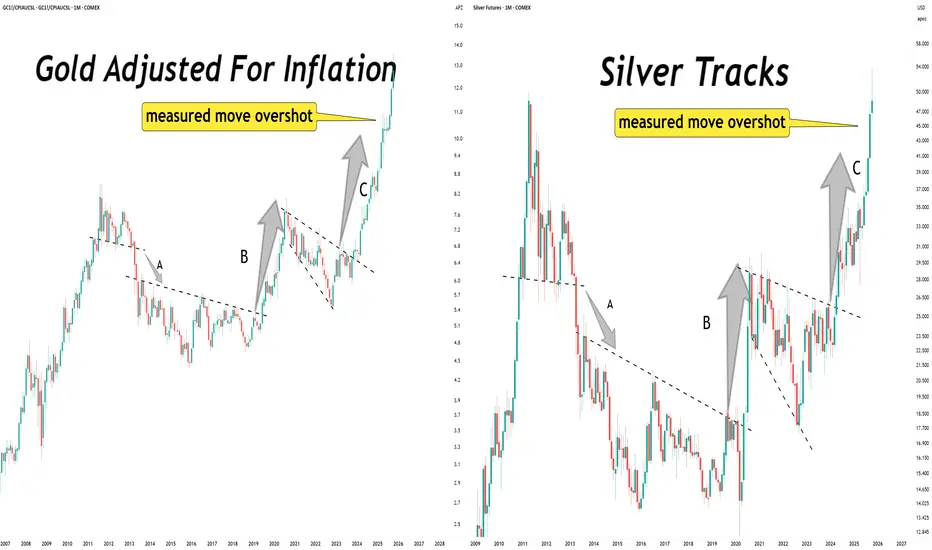
Launch patterns have exceeded their measure move targets.Gold. Silver.
Launch patterns have exceeded their measure move targets.
What comes next?
I would expect more launch patterns to morph into existence. Those are the building blocks of a long term uptrend.
Related commodities
GOLD: Bullish, But Retracing! Short Term Sell Opportunity!In this Weekly Market Forecast, we will analyze the Gold (XAUUSD) for the week of Oct. 27 - 31st.
Gold is still bullish, the current pullback it's in notwithstanding. Waiting patiently for valid buy setups is the sure way to go.
That being said, there is sell setup that could present an short-term

GC (Gold Futures): Towards $3900?This is MGC chart.
Current Market Situation
The chart shows MGC trading around $4,000 with a bearish outlook projected through the end of the week.
What We're Seeing
Price Movement:
- Price is trapped in a descending channel (purple trendlines)
- Currently attempting to push up near the $4,00

Short the Pop Near Intraday Highs — Gold Dec ’25Timeframe: 30m with 15m confluence
Symbol: COMEX_MINI:MGC1!
Thesis
Price pushed into a confluence resistance area and printed rejection. I’m positioned short from ~ 3,980 , looking for a fade back toward mid/low-day supports unless we accept above the resistance shelf.
Confluence (15m + 30


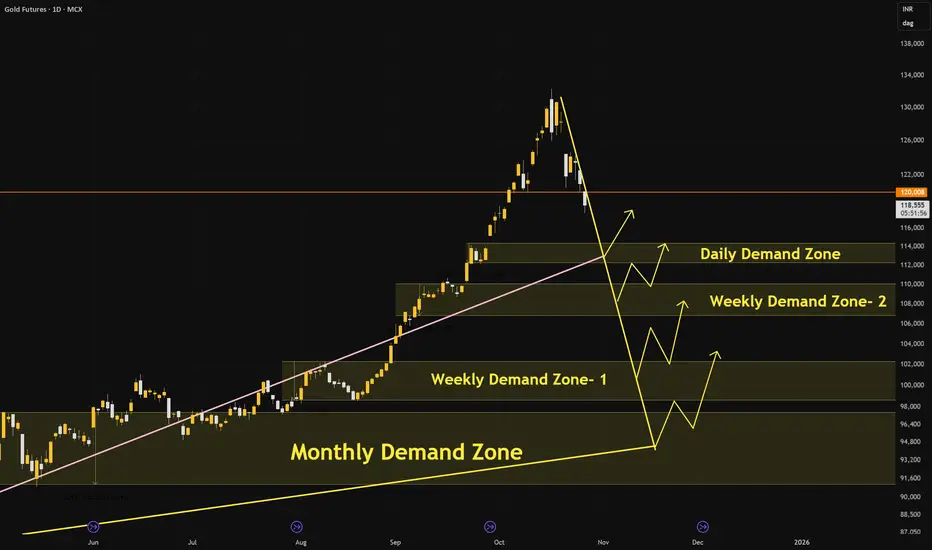
A Case Study: GOLD probable price ProjectionA Spectacular and exponential price movement was observed in GOLD for last 3 months.
A Mega BullRun is witnessed in the bullion market across the globe. Gold is considered as the best among multi asset classes. Especially in Indian subcontinent Gold is not only considered as precious metal which h
GC Futures – Are We Flipping Bearish Into Midweek?Tuesday closed below Monday’s low, hinting at a potential shift in sentiment.
Currently, price is approaching a 1H FVG inside the prior Asian range, just below the Weekly Low (W-L) and Daily High (D-H) — a perfect liquidity pocket.
I’m watching for signs of rejection here to confirm a bearish conti

GOLD - Sell off when u see a crowd entering - always workingGOLD - Sell off when u see a crowd entering - always working
New that in Argentina people buying al ot of phisical GOLD was a perfect signal of retail FOMO
$3400 isa key support

GOLD | Intermediate Top ReachedI believe gold has reached an intermediate-term peak and is positioned for a significant pullback. However, this correction doesn't signal the end of gold's long-term bullish trajectory.
Price Targets:
Initial target: ~$4000 level
Final target: ~$3700 level

GOLD POSTING SELL TD COMBO 13On October 2, a NINE setup was completed. The setup started on September 22.
TDST is at 3705.8 (Friday September 19, close)
TD COMBO day 13 was completed on Monday October 20 at the close 4359.4
A overbought are are is thus established
The support of the structure TDST is at 3705.8

See all ideas
A representation of what an asset is worth today and what the market thinks it will be worth in the future.
Displays a symbol's price movements over previous years to identify recurring trends.