APPLE INC SHIFTED TO BULLISH TREND STRUCTURE IN DAILY CHARTTechnical Analysis: Apple Inc. (AAPL) Shifts to Bullish Daily Trend
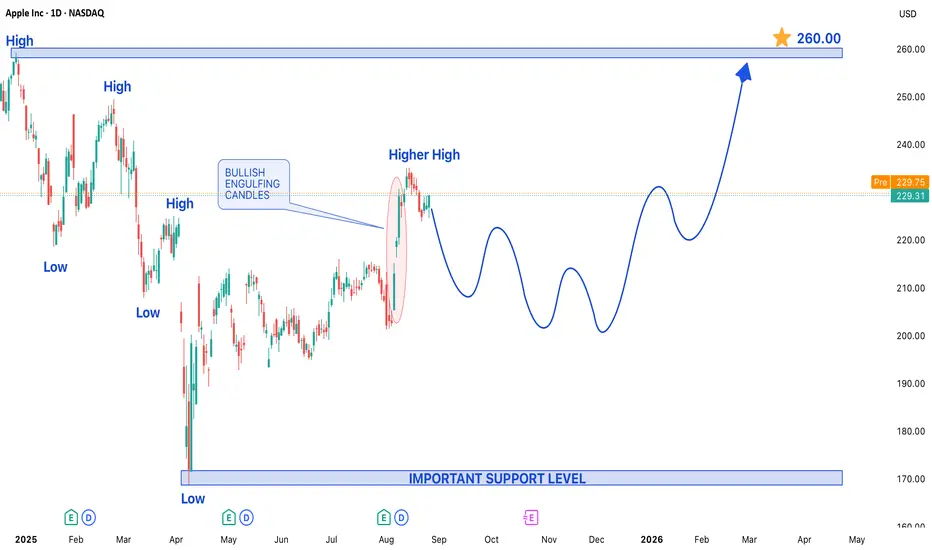
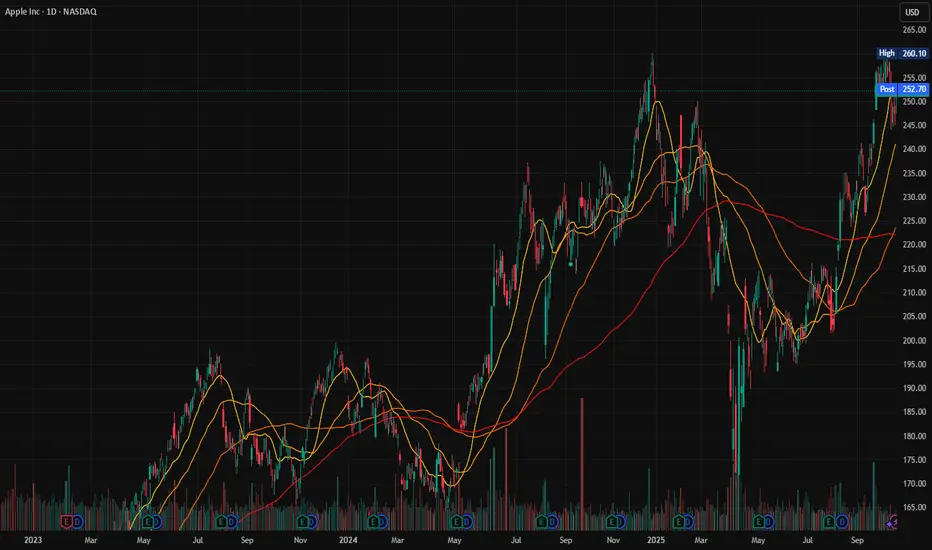
A significant technical development is underway for Apple Inc. (AAPL), as its daily chart has conclusively shifted into a bullish trend structure. This critical change in market posture indicates that buyer momentum has successfully overwhelmed previous selling pressure, setting the stage for a potential sustained upward move. The emergence of this new trend is characterized by a clear pattern of price action that signals growing confidence among buyers.
The primary evidence for this bullish shift is the formation of a higher high. This occurs when the price surpasses a previous significant peak, breaking the sequence of lower highs that defines a bearish or corrective phase. This achievement demonstrates that buyers are not only active but are also willing to bid up the price to new interim levels, establishing a new upward trajectory. This price-based evidence is powerfully confirmed by a key candlestick pattern: the **Bullish Engulfing candle. This pattern materializes when a large bullish candle completely "engulfs" the real body of the preceding bearish candle. It represents a decisive victory for the bulls within a single trading session, marking a clear shift in sentiment from selling to aggressive buying and providing strong confirmation of the underlying strength.
Given the confluence of this new bullish trend structure, the higher high formation, and the potent Bullish Engulfing candlestick pattern, the expectation is for AAPL's price to remain bullish in the upcoming trading sessions. The path of least resistance appears to be firmly to the upside, with momentum favoring the buyers.
Key Levels to Watch:
Upside Target: Based on this technical structure, the price is projected to aim for a target level of $260.00 on the higher side. This objective will likely serve as a key profit-taking zone and a significant psychological resistance level that the market will test.
Downside Support: While the outlook is bullish, it is prudent to identify key risk management levels. On any pullback, the support level of $170.00 is expected to act as a crucial floor. This level should hold to keep the newly established bullish structure intact. A decisive break below this support could invalidate the current bullish thesis and signal a return to a neutral or bearish consolidation phase.
In summary, the technical evidence for AAPL has turned convincingly positive. Traders and investors may look for opportunities on the long side, targeting the $260.00 level, while using any moves toward $170.00 as a potential value area, always with appropriate risk management strategies in place.
Trade ideas
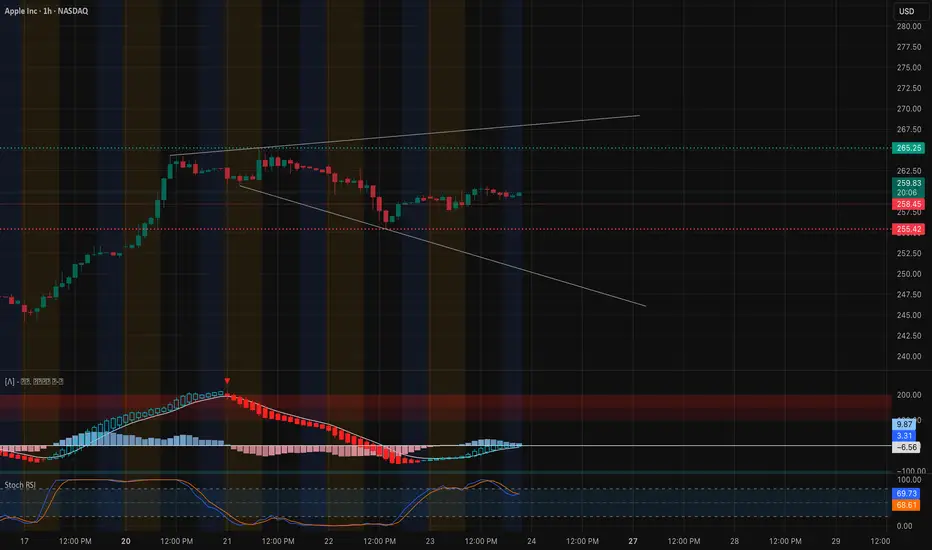
AAPL Testing Mid-Range Balance: (Oct. 24 Outlook)Can Bulls Reclaim $262 or Will It Slip Back to $252? 🍏
1. Market Structure (1H & 15M)
Apple’s recent price action shows a fragile equilibrium forming between supply and demand after a clean recovery from the $252 zone. On the 1-hour chart, we’ve got a CHoCH confirming short-term buyers stepping back in around $255, but price remains capped below a key mid-range resistance zone at $260–$262, where several prior breakdown candles originated.
The BOS from earlier in the week was followed by a retracement that created a local higher low structure, hinting at possible accumulation between $255–$258. However, the failure so far to push decisively through $262.50 shows hesitation — likely due to overhead liquidity and the GEX call wall there.
On the 15-minute chart,
Apple is consolidating inside a rising channel with small BOS/CHoCH rotations that reflect indecision. The latest CHoCH suggests short-term exhaustion, but as long as price respects $257–$258, bulls still have a chance to retake control into Friday.
2. Supply and Demand / Order Blocks
* Demand Zone (Support): $252.5–$255.5, aligning with a previous BOS level and high-volume accumulation area.
* Near-Term Demand: $257–$258 (15M fair value gap + local retest zone).
* Supply Zone (Resistance): $262–$265 — key order block cluster where sellers previously initiated the drop; breakout beyond this range could ignite a trend continuation toward $268+.
The chart shows clear liquidity resting above $262 and below $252 — suggesting that whichever side gets swept first will likely define Friday’s directional bias.
3. Indicator Confluence
* 9 EMA / 21 EMA: On the 15M, both EMAs are converging with a mild upward slope, indicating an early transition from consolidation to possible upside momentum. The 1H EMAs are flattening — a neutral but stabilizing signal.
* MACD: The 1-hour MACD is curling upward with histogram bars flipping positive, suggesting bulls are slowly regaining control. On the 15-minute, MACD shows mild bearish divergence but flattening momentum — setting up for a potential premarket expansion.
* RSI: 1-hour RSI is sitting near 68, close to bullish control but not yet overbought. 15M RSI oscillates between 52–60, ideal for a momentum reset phase.
* Volume: Volume picked up during the $252 bounce but has cooled — typical of compression before a possible breakout.
4. GEX (Gamma Exposure) & Options Sentiment
Friday’s GEX chart paints a tight battleground between the $252.5 HVL support and the $262–$265 gamma wall. The highest positive gamma lies right at $259–$260, meaning dealers may attempt to pin price near that zone through hedging.
Below that, the PUT support around $250 aligns perfectly with structural demand and previous BOS support — this is the line bulls must defend. Above, $265 represents the dominant call wall, making it the near-term ceiling unless a gamma squeeze takes hold.
The current IVR (20) and IVX avg (29.8) show low volatility, and call sentiment remains modest (7.1%), implying traders are cautious but not overly bearish. If momentum accelerates past $262, gamma positioning could flip and lead to a controlled squeeze toward $267–$270.
5. Trade Scenarios for Friday, Oct. 24
Bullish Setup 🟩
* Entry Zone: $258–$259 retest or breakout above $262.2
* Targets: $264 → $267 → $270
* Stop-Loss: Below $256.8
* Confirmation: Hold above 9 EMA on 15M + MACD histogram rising + RSI > 60
Bearish Setup 🟥
* Entry Zone: $261–$262.5 rejection or CHoCH under $257
* Targets: $255 → $252 → $248
* Stop-Loss: Above $263.5
* Confirmation: MACD crossdown + RSI divergence + BOS to downside
6. Closing Outlook for Oct. 24 (Friday)
Friday looks to be a compression breakout setup for Apple — momentum is tightening between $257 and $262. If bulls reclaim $262 with conviction, watch for a potential gamma-driven squeeze toward $267+. Conversely, a rejection there with fading volume could pull Apple back toward its $252–$255 accumulation base.
My personal view: AAPL remains neutral-to-bullish as long as $257 holds. Buyers have shown up at every dip this week, and Friday’s session might reveal whether that base was genuine accumulation or just short-term relief. Keep your eyes on $262 — that’s the key trigger level.
📊 Final Thought:
“AAPL is balancing between $257 and $262 — the calm before the breakout. If bulls crack $262, the gamma unwind could send it flying toward $270. If not, expect a cool-off back to the $255 zone.”
This analysis is for educational purposes only and not financial advice. Always do your own research and manage your risk before trading.
Apple: New All-Time High as Low Is Adjusted Apple has recently seen a period of heightened volatility, marked by sharp gains and notable pullbacks. In response to the latest price action, we’ve made a slight adjustment to our wave count and revised the low for magenta wave (4). We’re now allowing for magenta wave (5) to break above the $260.10 resistance level, which would complete green wave . Our alternative scenario, which carries a 34% probability, still calls for a new corrective low in blue wave alt.(IV). In this case, Apple would have just finished beige wave alt.b slightly above $260.10 and would next decline in wave alt.c, falling below support at $212.94. Even so, the alternative corrective low would remain above the $168 level.

Apple: New All-Time High!Apple has recently seen a period of heightened volatility, marked by sharp gains and notable pullbacks. We’re allowing for magenta wave (5) to break above the $260.10 resistance level, which would complete green wave . However, our alternative scenario, which carries a 34% probability, calls for a new corrective low in blue wave alt.(IV) . In this case, Apple would have just finished beige wave alt.b slightly above $260.10 and would next decline in wave alt.c , falling below support at $212.94. Even so, the alternative corrective low would remain above the $168 level.

Apple Smashes Expectations with iPhone 17Apple Smashes Expectations with iPhone 17: Sales Up 14% in Just 10 Days
By Ion Jauregui – Analyst at ActivTrades
Apple (NASDAQ: AAPL) has made another bold move with the launch of its iPhone 17. According to Counterpoint, the latest model sold 14% more than the iPhone 16 in its first 10 days in key markets such as China and the United States. Growth is even more remarkable in China, where the base model almost doubled its sales compared to the iPhone 16. Overall, sales across both markets surged 31%, consolidating Apple as the undisputed leader in the sector.
The secret behind this success seems simple but effective: a better chip, enhanced display, upgraded front camera, and larger storage capacity, all while maintaining the same price as last year. Apple’s “more for the same” strategy has, at least so far, proven highly profitable.
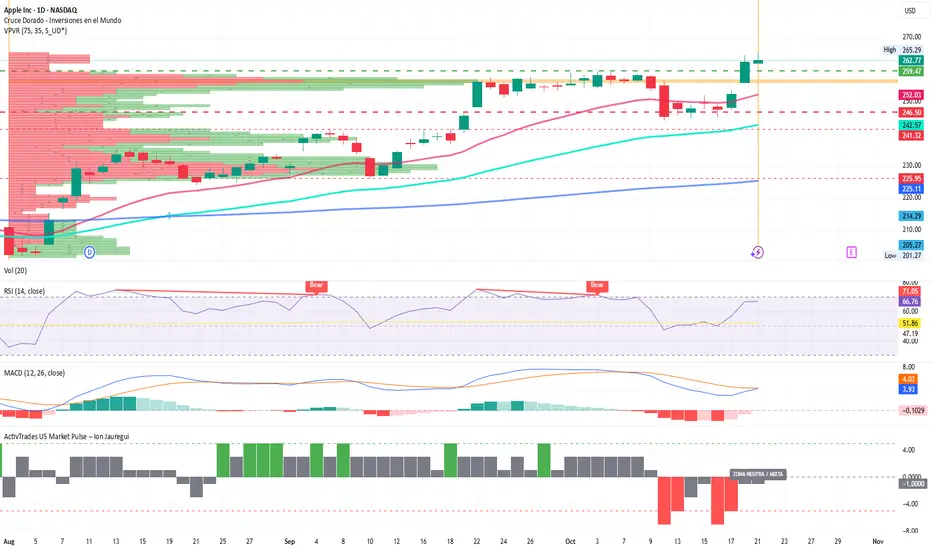
AAPL Technical Analysis
From a technical perspective, Apple shares show a solid bullish momentum following the iPhone 17 announcement:
The price has broken key resistance at $259.47, consolidating above the 50-day moving average for two consecutive sessions.
Relative Strength Index (RSI) indicators are in slightly overbought territory but show no immediate correction signals.
MACD indicates the early stages of a bullish crossover.
Trading volume has increased significantly in recent days, confirming strong institutional interest.
In this context, current support is around $246.50, with the next support above $241.28 near the 100-day moving average, while the previous key support is at $225.95, coinciding with the 200-day moving average. The ActivTrades US Market Pulse indicates a neutral risk balance, suggesting that these moves are largely driven by speculation around Apple.
For Apple, these figures represent more than just a commercial victory. The company needed a sales boost to justify its position in an increasingly competitive market, and early indicators show it is succeeding.
The iPhone 17 not only strengthens investor confidence in Apple but also sets a new benchmark for the tech industry at a time when innovation and demand for premium devices are higher than ever.
*******************************************************************************************
La información facilitada no constituye un análisis de inversiones. El material no se ha elaborado de conformidad con los requisitos legales destinados a promover la independencia de los informes de inversiones y, como tal, debe considerarse una comunicación comercial.
Toda la información ha sido preparada por ActivTrades ("AT"). La información no contiene un registro de los precios de AT, o una oferta o solicitud de una transacción en cualquier instrumento financiero. Ninguna representación o garantía se da en cuanto a la exactitud o integridad de esta información.
Cualquier material proporcionado no tiene en cuenta el objetivo específico de inversión y la situación financiera de cualquier persona que pueda recibirlo. La rentabilidad pasada y las estimaciones o pronósticos no son sinónimo ni un indicador fiable de la rentabilidad futura. AT presta un servicio exclusivamente de ejecución. En consecuencia, toda persona que actúe sobre la base de la información facilitada lo hace por su cuenta y riesgo. Los tipos de interés pueden cambiar. El riesgo político es impredecible. Las acciones de los bancos centrales pueden variar. Las herramientas de las plataformas no garantizan el éxito.
Potential Breakout in Apple Apple has been trapped as the broader Nasdaq rallies, but that might have changed yesterday.
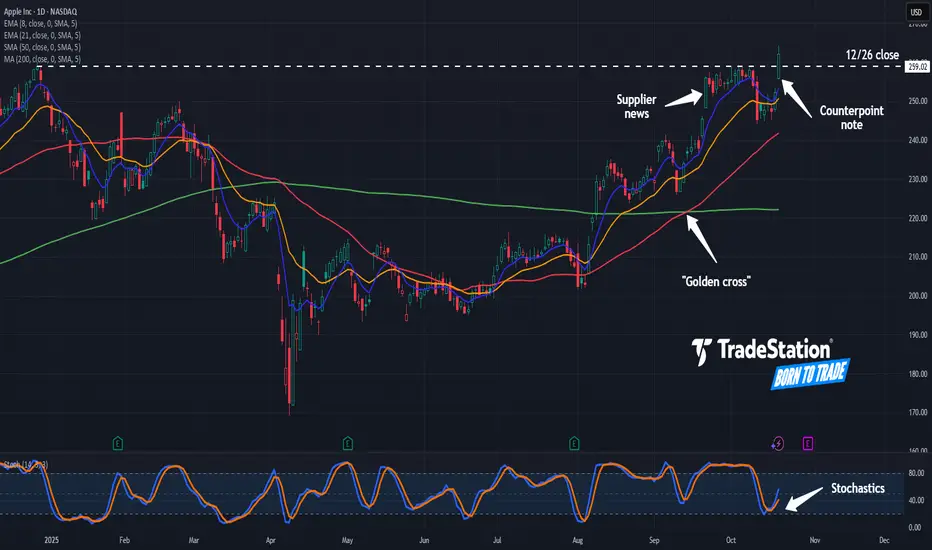
The first pattern on today’s chart is the December 26 closing price of $259.02. AAPL paused near that level in early October but closed above it yesterday. That may be viewed as a potentially bullish breakout.
Second, the tech giant surged on September 22 after The Information reported suppliers were told to increase component production. That was the first clue of strong demand for the iPhone 17. Another report from Counterpoint Research on Monday noted strong early sales of the new handset.
Third, the 50-day simple moving average (SMA) had a bullish “golden cross” above the 200-day SMA last month. That may suggest its longer-term trend is getting more bullish.
Fourth, the 8-day exponential moving average (EMA) is above the 21-day EMA. That may reflect a bullish short-term trend.
Next, stochastics recently turned up from an oversold condition.
Finally, AAPL is a highly active underlier in the options market. (Its average daily volume of 790,000 contracts ranks fifth in the S&P 500, according to TradeStation data.) That could help traders take positions with calls and puts.
TradeStation has, for decades, advanced the trading industry, providing access to stocks, options and futures. If you're born to trade, we could be for you. See our Overview for more.
Past performance, whether actual or indicated by historical tests of strategies, is no guarantee of future performance or success. There is a possibility that you may sustain a loss equal to or greater than your entire investment regardless of which asset class you trade (equities, options or futures); therefore, you should not invest or risk money that you cannot afford to lose. Online trading is not suitable for all investors. View the document titled Characteristics and Risks of Standardized Options at www.TradeStation.com . Before trading any asset class, customers must read the relevant risk disclosure statements on www.TradeStation.com . System access and trade placement and execution may be delayed or fail due to market volatility and volume, quote delays, system and software errors, Internet traffic, outages and other factors.
Securities and futures trading is offered to self-directed customers by TradeStation Securities, Inc., a broker-dealer registered with the Securities and Exchange Commission and a futures commission merchant licensed with the Commodity Futures Trading Commission). TradeStation Securities is a member of the Financial Industry Regulatory Authority, the National Futures Association, and a number of exchanges.
Options trading is not suitable for all investors. Your TradeStation Securities’ account application to trade options will be considered and approved or disapproved based on all relevant factors, including your trading experience. See www.TradeStation.com . Visit www.TradeStation.com for full details on the costs and fees associated with options.
Margin trading involves risks, and it is important that you fully understand those risks before trading on margin. The Margin Disclosure Statement outlines many of those risks, including that you can lose more funds than you deposit in your margin account; your brokerage firm can force the sale of securities in your account; your brokerage firm can sell your securities without contacting you; and you are not entitled to an extension of time on a margin call. Review the Margin Disclosure Statement at www.TradeStation.com .
TradeStation Securities, Inc. and TradeStation Technologies, Inc. are each wholly owned subsidiaries of TradeStation Group, Inc., both operating, and providing products and services, under the TradeStation brand and trademark. When applying for, or purchasing, accounts, subscriptions, products and services, it is important that you know which company you will be dealing with. Visit www.TradeStation.com for further important information explaining what this means.
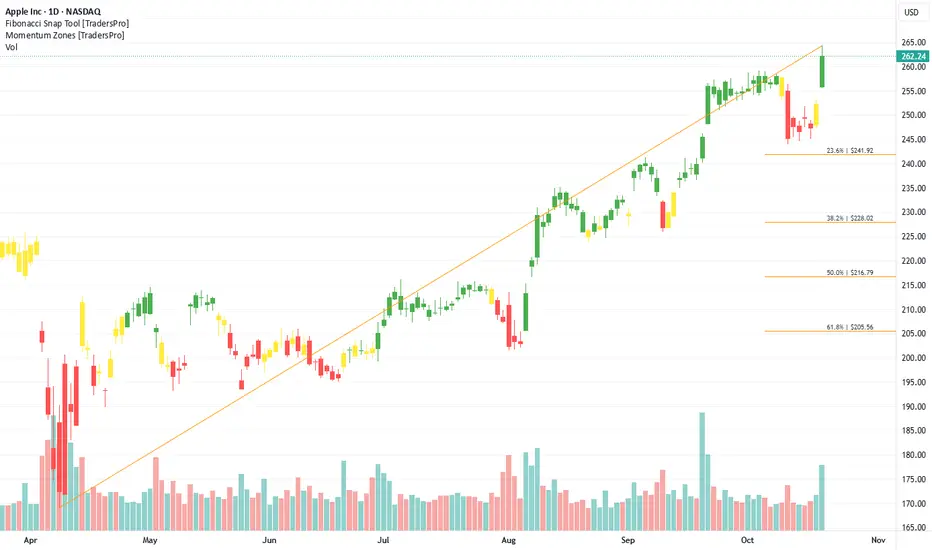
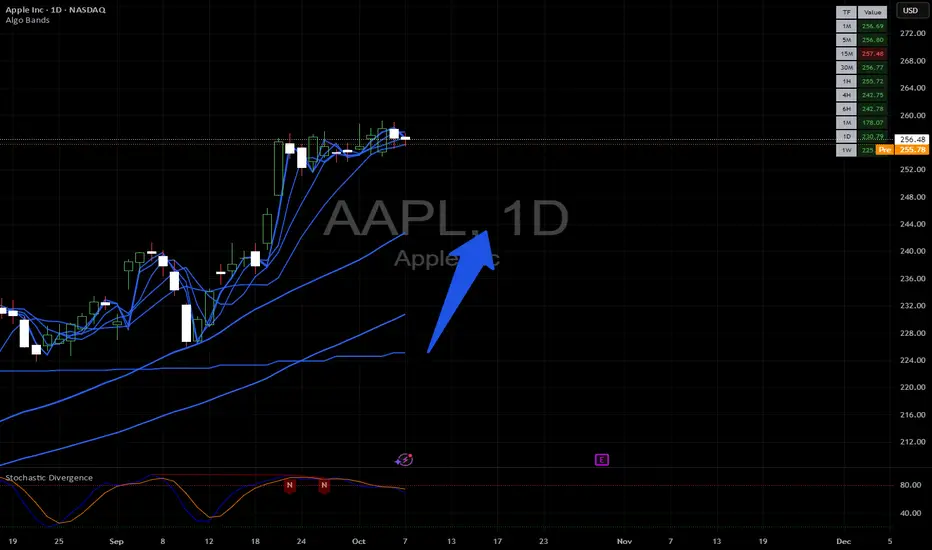
Apple Inc. (AAPL) Expands With AI-Powered DevicesApple Inc. (AAPL) is a global technology leader known for its iconic products — iPhone, Mac, iPad, and Apple Watch — as well as its fast-growing services segment, including Apple Music, iCloud, and Apple TV+. The company’s ecosystem continues to drive customer loyalty and recurring revenue. Apple’s growth is fueled by innovation in hardware and AI, expansion in digital services, and strong brand power that keeps it at the center of global consumer technology.
On the chart, a confirmation bar with rising volume highlights bullish momentum. The price has entered the momentum zone after climbing above the .236 Fibonacci level. A trailing stop can be placed just below this Fibonacci line using the Fibonacci snap tool, helping traders protect profits while leaving room for continued upside potential.
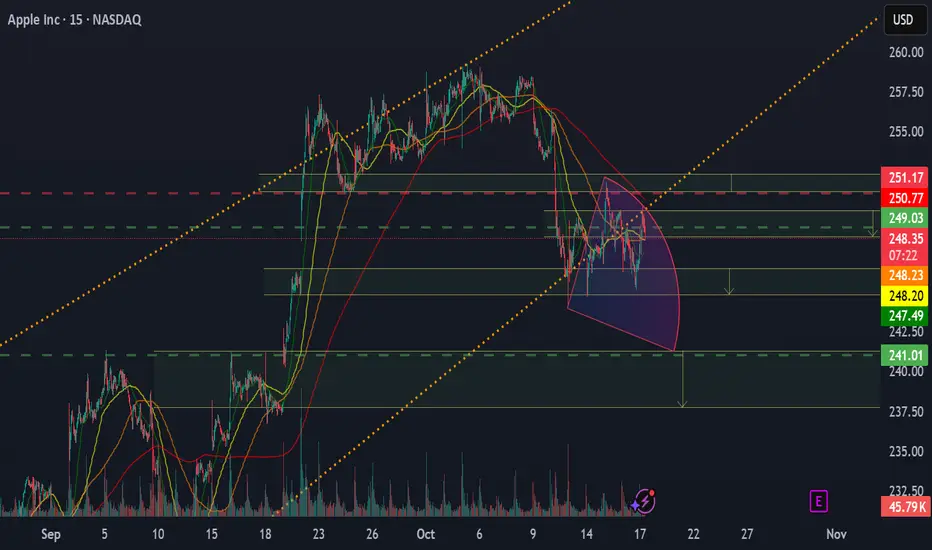
APPLE/AAPL Stock: Movement Scenarios and Key Reaction PointsThese are all the key stock levels for Apple that are fully and precisely displayed in the image – including supports, resistances, and potential reaction points for traders NASDAQ:AAPL

Apple (AAPL) Shares Hit an All-Time HighApple (AAPL) Shares Hit an All-Time High
On 26 September, we noted that Apple (AAPL) shares were nearing a record peak. Less than a month later, that forecast has materialised: according to the chart, AAPL surged more than 4% yesterday, surpassing its December 2024 high. This marks:
→ a new all-time record;
→ a return to second place by market capitalisation (Apple has overtaken Microsoft, while Nvidia remains in first position).
Why Are Apple Shares Rising?
→ Strong sales figures. Counterpoint Research reported that sales of the new iPhone 17 series in the US and China during the first ten days were 14% higher than those of the iPhone 16 last year. Analysts note that the base model offers significant improvements at the same price, encouraging consumers to upgrade.
→ Analyst forecasts. Loop Capital not only raised its rating to Buy (with a target price of $315) but also declared the start of a “long-awaited upgrade cycle”. In their view, this is not a short-term surge but the beginning of sustained growth in shipments expected to continue until 2027.
Optimism is also fuelled by anticipation of Apple’s upcoming earnings report and the festive shopping season, which could further accelerate iPhone 17 sales.
Technical Analysis of Apple (AAPL) Shares
Price movements in 2025 have formed a broad upward channel (shown in blue). Within this structure:
→ the channel’s median line acted as support in mid-October;
→ yesterday’s rally lifted the price into the upper quarter of the channel.
From a demand perspective:
→ Trading opened with a bullish gap (see arrow), and the price jumped rapidly in the first minutes — evidence of strong buying interest.
→ The psychological level of $250 is losing its role as resistance and may become future support.
→ The price remains within a steep rising channel (marked in orange).
From a supply perspective:
→ The RSI indicator shows overbought conditions;
→ Some investors may take profits at the new record high.
Taking these factors into account, once the current bullish momentum cools, AAPL could see a short-term pullback — potentially towards the area of the bullish gap or one of the orange trendlines (solid or dotted).
This article represents the opinion of the Companies operating under the FXOpen brand only. It is not to be construed as an offer, solicitation, or recommendation with respect to products and services provided by the Companies operating under the FXOpen brand, nor is it to be considered financial advice.

Long trade
📘 Trade Journal Entry
Pair: AAPL (Apple Inc)
Direction: Buyside Trade
Date: Fri 10th Oct 2025
Time: 11:30 AM
Session: London Session AM
Timeframe: 15 minutes
🔹 Trade Details
Entry: $258.49
Profit Level: $269.22 (+4.27%)
Stop Level: $243.69 (–1.96%)
Risk-Reward Ratio (RR): 2.16
🔹 Technical Context
The demand zone on the 15-minute timeframe (near $252–$255) held strongly following an earlier breaker block and order block reaction.
Price retraced to the 0.618–0.786 Fibonacci zone before resuming upward momentum.
Kaufman Adaptive Moving Average (KAMA) is trending upward, confirming directional bias alignment.
RSI recovered from mid-range, showing bullish divergence and improved momentum.
The 1.618 Fib extension aligns closely with the target zone (~$261–$262), confluencing with prior structural resistance.
🔹 Narrative
After a period of range compression within the 255–258 zone, Apple broke from its re-accumulation structure following a liquidity sweep below the 15-minute demand zone.
Institutional accumulation was evident, as reflected by high-volume candle expansion and a clear reclaim of structure at 257.
🔹 Market Sentiment Context
Broader NASDAQ composite strength aligns with post-earnings optimism and risk-on appetite.
USD weakness and moderating Treasury yields have improved tech-sector conditions.
The upcoming Q4 earnings cycle and expectations of a potential Fed rate cut sustain short-term bullish sentiment across mega-cap equities.

AAPL watch $256-257: Double Golden fib zone that caused last TOPAPPL has been confidently climbing the wall of worries.
Now testing the Double Golden zone at $256.75-257.41
Look for a Break-n-Retest (likely) or a Dip-to-Fib for entry.
.
Previous Analysis that caught the EXACT TOP:
Hit BOOST and FOLLOW for more such PRECISE and TIMELY charts.
========================================================
.

APPLE What Next? BUY!
My dear followers,
I analysed this chart on APPLE and concluded the following:
The market is trading on 245.33 pivot level.
Bias - Bullish
Technical Indicators: Both Super Trend & Pivot HL indicate a highly probable Bullish continuation.
Target - 251.49
About Used Indicators:
A super-trend indicator is plotted on either above or below the closing price to signal a buy or sell. The indicator changes color, based on whether or not you should be buying. If the super-trend indicator moves below the closing price, the indicator turns green, and it signals an entry point or points to buy.
Disclosure: I am part of Trade Nation's Influencer program and receive a monthly fee for using their TradingView charts in my analysis.
———————————
WISH YOU ALL LUCK

Relative Strength Tipped Off AAPL’s Rally Before Price DidAbove is a 5-minute chart of AAPL, and in the lower pane, I’ve plotted the ratio line of AAPL versus SPY. What really caught my attention this morning was what happened around 10:00 ET. While AAPL itself had only opened slightly higher, the ratio line had already broken out to a new high. That was the early clue, the relative strength line was quietly signaling that AAPL was outperforming the market before the actual price move confirmed it.
TheRelativeStrengthTrader

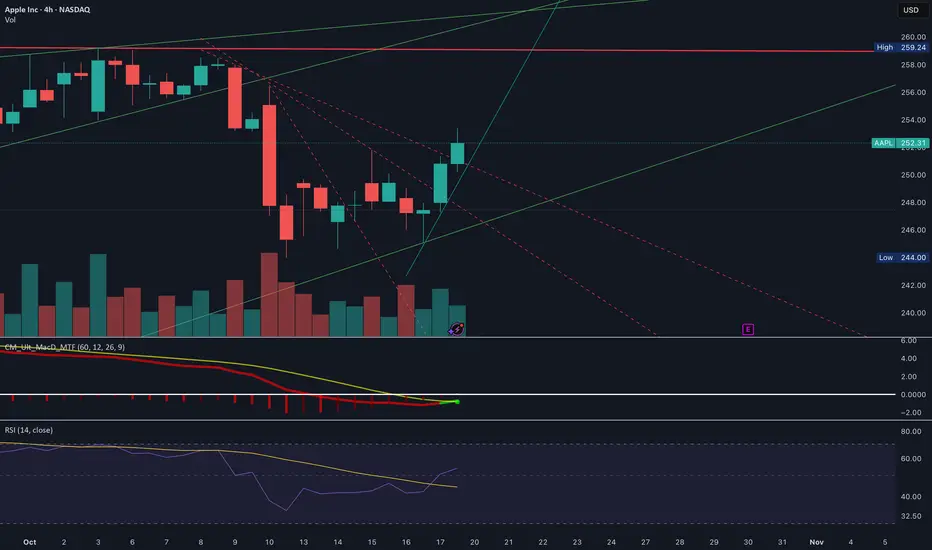
Apple (AAPL) – Potential Short-Term UpsideOn the 4-hour chart, Apple began a noticeable downward trend around October 8. That trend appears to have shifted around October 16, when the stock hit a low of $245. Since then, it has rebounded to approximately $252.
The strength of this bounce suggests the possibility of continued upward momentum in the short term, potentially lasting through the week leading up to earnings on October 30. Traders may want to watch for support near $245–$248 and resistance near $255–$257, which could indicate the next potential price moves.
AAPL Gamma Battle Zone - Oct 21–25AAPL Gamma Battle Zone – Bulls Testing the $255 Ceiling Ahead of Earnings 🔥
🟩 Daily Timeframe – Macro Market Structure
AAPL continues to ride within a clean ascending channel, maintaining higher highs and higher lows since the August reversal. The daily trend remains bullish overall, with price currently hovering near the upper midline of the channel.
Last week’s rejection near $259–$260 showed short-term exhaustion, but the stock found solid support at $244–$247, a key demand area tested multiple times since September. This zone coincides with the previous CHoCH and liquidity sweep, where institutional buyers likely accumulated positions before the next leg up.
If AAPL can sustain above $252, bulls may attempt another push into the $258–$260 supply zone — a critical decision area where we could see either renewed breakout momentum or another round of distribution.
🟦 1-Hour Timeframe – Structure, Momentum, and Volume
The 1-hour chart shows a clear BOS (Break of Structure) following last week’s CHoCH near $247, confirming the transition back to a short-term bullish structure. The move from $247 → $252.5 came with increasing volume and clean EMA alignment, suggesting solid intraday demand.
Price is now coiling under $253–$255, the first major resistance level in this new leg. Expect some chop here as liquidity builds before the next impulsive move.
* 9 EMA crossed above 21 EMA and both are pointing upward — short-term bullish momentum intact.
* MACD histogram remains positive but flattening, showing early signs of momentum cooling.
* RSI sits around 60–65, leaving room for another push before overbought territory.
As long as AAPL stays above $250.5, the bias remains bullish. A break below that would weaken short-term structure and could trigger a retest of the $247 zone.
🟨 15-Minute Timeframe – Intraday Precision Zones
The 15-min structure gives the clearest roadmap for intraday traders. AAPL formed multiple BOS and CHoCH swings between $247–$253, with the latest impulse leg rejecting just below $254, a minor liquidity pocket inside the daily supply zone.
We’re now seeing consolidation just above $250–$251, an important area where micro-liquidity is stacking. This zone may serve as an intraday pivot — break below it, and bears can drag the price to $248.5–$247.5. Hold above it, and bulls could reload for another retest toward $255.
Momentum indicators show a cooling phase:
* MACD histogram has started to fade, hinting at short-term consolidation or pullback.
* Stoch RSI has cycled down from overbought but hasn’t yet reset fully — watch for crossovers near the lower band as early reentry signals.
Expect liquidity sweeps around $251–$252.5 early in the week before any meaningful direction confirms.
🟥 GEX (Gamma Exposure) & Options Sentiment – The Dealer Map
Gamma data paints a textbook pinning setup for the week:
* Highest positive GEX / Call resistance: around $255–$260 — heavy dealer hedging pressure could cap upside.
* Strong Put walls: $245–$242, directly aligning with the key daily demand.
* Max Pain: near $250, often acting as a gravitational anchor when volatility compresses.
* IVR 25.9, slightly under the 30-day mean, suggests option premiums are cooling, favoring range compression early week before a potential directional breakout.
Dealer positioning currently supports a neutral-to-slightly-bullish gamma environment, meaning dips may find hedging support, but large rallies will likely face dealer sell pressure near $255+.
Trade alignment thoughts:
* Scalpers: Favor quick long scalps above $251.5 with targets $254–$255, keeping tight stops.
* Directional traders: Watch for daily close over $259 to confirm breakout continuation.
* Options players: Debit spreads or neutral iron condors between $250–$255 align with current GEX pin zone.
🎯 Trade Scenarios
Bullish Setup 🟢
* Entry: Above $252.5–$253 after a confirmed candle close.
* Targets: $255, then $259.
* Stop-loss: Below $249.8.
* Bias confirmation: MACD expansion and RSI > 60 on both 15M and 1H.
Bearish Setup 🔴
* Entry: Rejection from $255–$257 or break below $250.5.
* Targets: $247 → $244.
* Stop-loss: Above $258.5.
* Bias confirmation: MACD bearish crossover + RSI < 45 with EMA slope turning down.
🧭 Closing Outlook – Week of Oct 21–25
AAPL starts the week near equilibrium between demand ($247) and supply ($255). Expect early-week compression as dealers pin around $250–$252, followed by a potential gamma-driven breakout later in the week.
If bulls defend $250, the structure favors another push toward $258–$260. Failure to hold that zone, however, could trigger a controlled pullback into the $247 support block.
I’ll be watching closely for liquidity traps near $251–$252 — if price sweeps that zone and reverses with volume, it could mark the next momentum ignition for bulls.
Disclaimer:
This analysis is for educational purposes only and does not constitute financial advice. Always perform your own due diligence and manage risk accordingly.

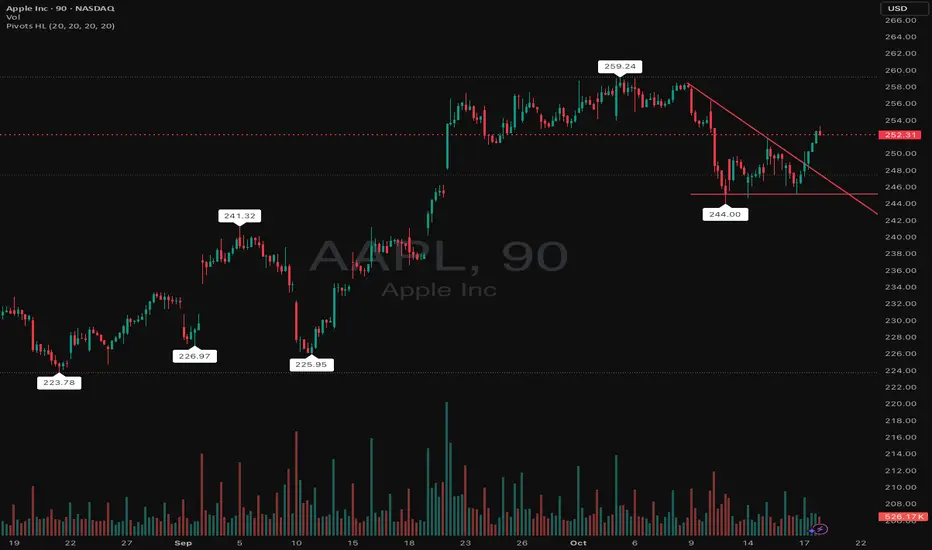
AAPL - A true breakout toward ER or BULL TRAPHappy Sunday.
On High Watch of this week is AAPL.
It has kinda formed a triple bottom here. The bounce from $244 forms a higher low, showing buyers stepping in. Breaking above the trendline resistance shifts the short-term structure to BULLISH. Next target if momentum continues is $256-$259 zone, which was the previous resistance cluster. However, if the price falls below $250 then this breakout is a bull trap. Below $244 then Bearish continue.
Trade Alert: $AAPL NOV 07 2025 $255 CALLS – 128% ROI Target inEnter: NASDAQ:AAPL NOV 07 2025 $255 CALLS
Buy in Price: $6.70 - $6.75
Take Profit: $15.28
Stop Bleeding: $5.90
ROI Potential: 128%
Exit Within: 2 Weeks
Apple short ideaApple looks overextended after the recent rally, showing signs of exhaustion near resistance. Price momentum is slowing, and volume confirms reduced buying pressure. I expect a short term correction as the market takes profits and sentiment cools down.
I am opening a short position with a target at 241. After that, I’ll review the situation and reassess the direction, but it’s very likely that we’ll correct deeper.
A break below the recent local lows could accelerate the move toward that level.
⚠️ Not financial advice.
$AAPL Buy levelUnlike NASDAQ:META , NASDAQ:AAPL is strong. If, however, NASDAQ:AAPL starts to come down, $225 offer a good level to go long off. $225 is also a level to sell puts against.
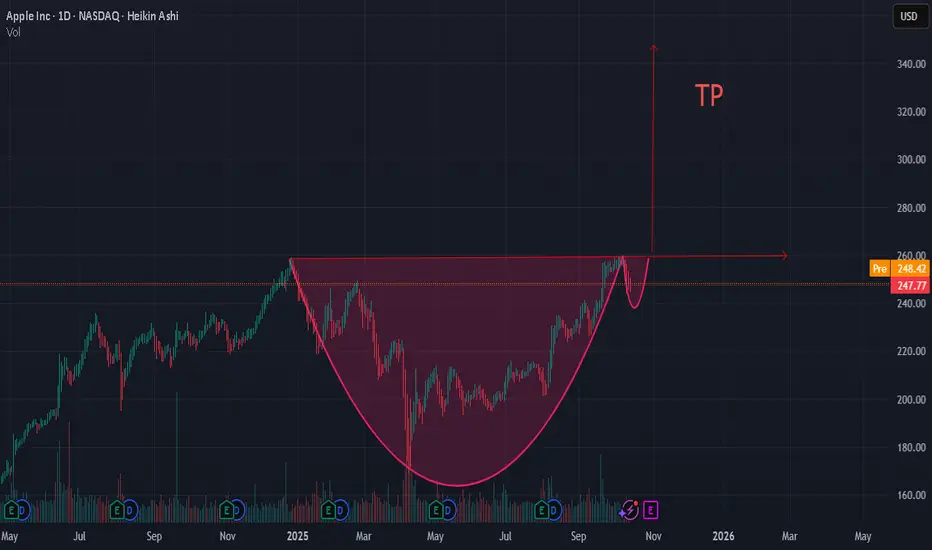
CUP AND HANDLE ON AAPL TP 340 LONGApple moves in a 10-15% range for years!
With lowering interest rates, and with quite low P/E ratio (32), compared to other companies in this industry, a new wave can begin!
AAPL (Apple Inc.) on a 4-hour timeframe.AAPL (Apple Inc.) on a 4-hour timeframe.
Here’s what the chart shows:
The current price is around $247.80.
There is an uptrend line supporting the price.
Two target levels are marked on the chart with arrows pointing upward.
The Ichimoku cloud shows bullish momentum (price above the cloud).
📈 Marked Target Levels on Chart:
1. First Target: Around $256
2. Second Target: Around $268
📝 Analysis Context (from the chart)
The trend is bullish, supported by higher highs and higher lows.
Price is riding the trendline, and the cloud provides support.
First target seems to be a short-term breakout level, second is more medium-term.
⚠ Important Note:
These are technical analysis targets, not guaranteed future prices. Real market movement can differ due to macroeconomic news, earnings, or broader market sentiment.

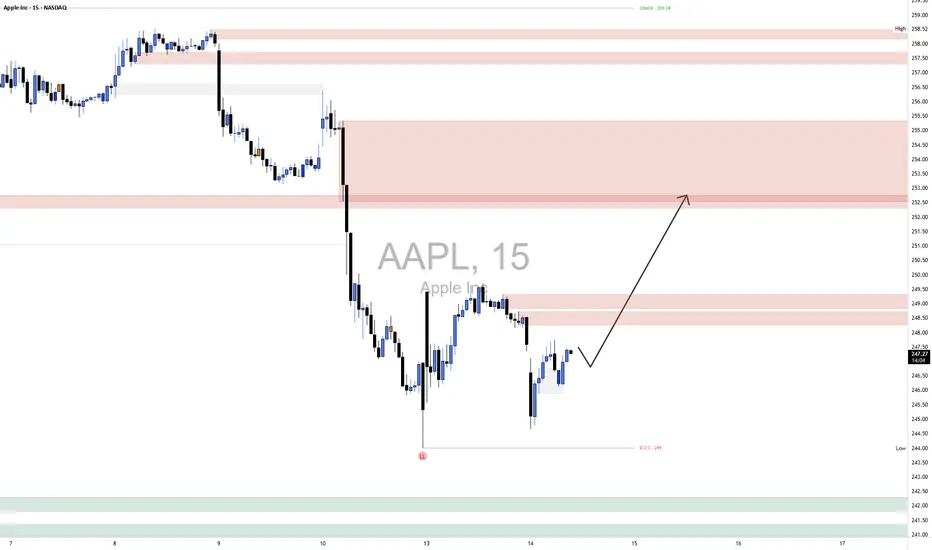
AAPL LongMarket Structure:
Apple remains in a short-term downtrend, following a clear Break of Structure (BOS) to the downside around $244, confirming bearish continuation from the prior lower high near $254. However, the recent candle formation suggests a possible Change of Character (CHoCH) as price begins to stall and form higher lows around the $246–$247 area, indicating early signs of accumulation.
Supply & Demand Zones:
The demand zone between $244 and $246 has shown a decent reaction—buyers stepped in with strength after a deep sweep of lows, suggesting that liquidity has likely been collected from resting stops below $245. The nearest supply zone lies between $248.5 and $249.5, where price previously dropped sharply, confirming the presence of aggressive sellers. The larger, more significant supply region sits higher between $252.5 and $254, the origin of the recent impulsive drop, making it a strong area for potential short setups if price reaches it.
Current Price Action:
Price is consolidating just above local demand, with small-bodied candles showing indecision but higher lows forming. The market appears to be preparing for a retracement move back into the $248–$253 range. The arrow path on your chart suggests a likely bullish correction toward the upper supply before sellers potentially re-enter.
Bias & Outlook:
The short-term bias is bullish, expecting a retracement toward $252–$253 before potential rejection. The key invalidation level for this scenario is below $244—a clean break beneath that would confirm bearish continuation and invalidate the recovery structure.
Momentum & Candle Behavior:
Momentum is neutral-to-slightly bullish, with shorter wicks on the downside and volume compressing near demand, indicating seller exhaustion. A bullish engulfing or strong breakout candle above $248 would confirm short-term momentum shift.
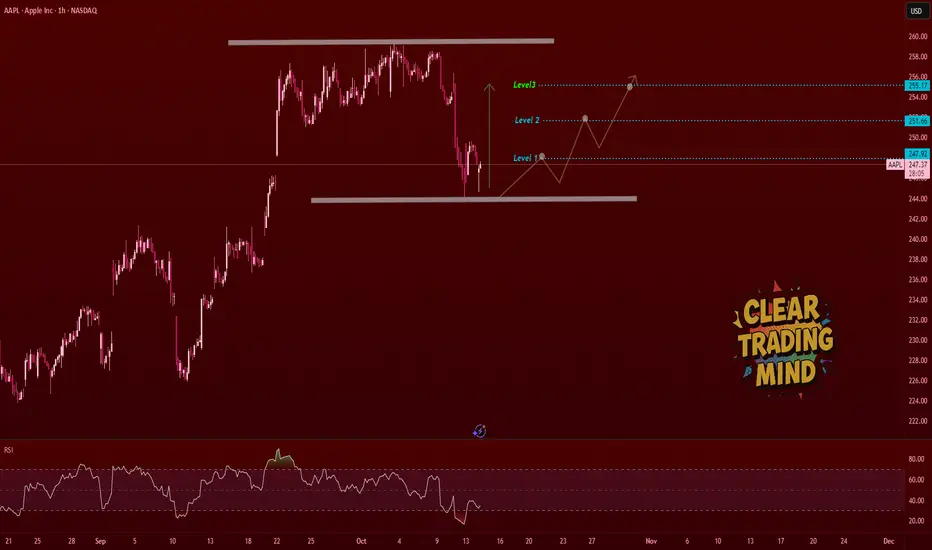
AAPL Bullish Outlook – Level-by-Level Breakout PlayApple is showing a potential bottom structure after rejecting the demand zone at the lower range.
Price bounced from the base and looks ready for a step-by-step move upward.
🔍 My Bullish Plan (1H Chart):
- As long as price holds the bottom range, I expect a recovery move.
- Watching price break each resistance step clearly:
🟢 Level 1 → 247.92
🟢 Level 2 → 251.66
🟢 Level 3 → 255.17
Once Level 1 breaks with strong momentum, I will look for intraday HL (higher low) or consolidation for continuation.
This zone looks good for scaling into bullish structure .
💡 Support Zone:
Marked demand base around 244.50 – strong previous reaction area.
⚠️ Invalidation:
If price fails to hold the demand zone and closes below the base, I’ll cancel the bullish bias.
🧠 Outlook Summary:
- RSI showing slight divergence hinting reversal strength
- Price at range low
- Multiple clean upside levels to work with
- Patience for breakout confirmation = key