The Ghost of 1986-1987 Stock Market Overlay onto $IWMThe 1986-1987 stock market advance was 48% as measured by the S&P500 Index SP:SPX from the low in late 1986 which peaked in August 1987 and crashed into October 19th's spectacular 20% decline in one day.
The advance in the Russell 2000 Index from the low in 2023 to the high in 2024 was 51%, topping the 48% gain in the SP:SPX and the meltdown wasn't as spectacular, but it was similar.
There were similar patterns in fears of trade wars, US dollar declines, new tax laws going into effect back then and tax laws sunsetting this time. Those you can go into by reviewing my other charts I have published over the years here.
I stretched the 1987 pattern to fit the low to the high, so it isn't "exactly" the same time day-to-day for this pattern.
I found it interesting because the chart of AMEX:IWM all by itself had the same "look" to me as the 1987 bull market and crash so I decided to put it together for you all here to see.
I would expect a choppy market from here on as people adjust to the new uncertainties. Sellers of this decline will be shy to reinvest anytime soon and buyers are likely afraid to step up and get aggressive with so much uncertainty.
Sentiment as measured by AAII shows an extremely fearful and reluctant investor class, which is typical to see at major market bottoms.
Wishing everyone peace and prosperity!
Tim West
11:17AM EST April 24, 2025
IWM trade ideas

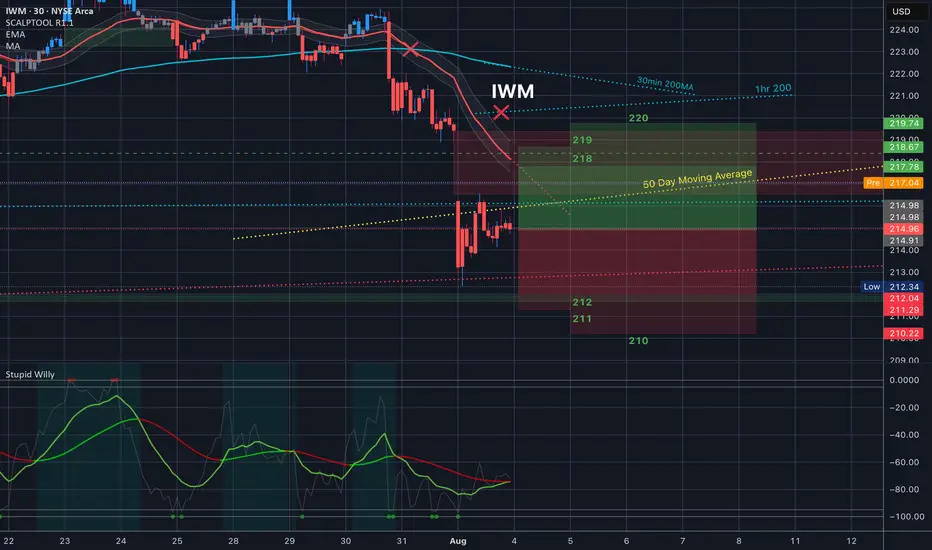
$IWM Analysis, Key Levels & Targets 8.4.25
Today’s Trading Range - we have a great range expansion here from last Friday’s drop. Some interesting targets here. Let me know what you see.
Look at this Battle zone today!! Grab this chart - and let’s go
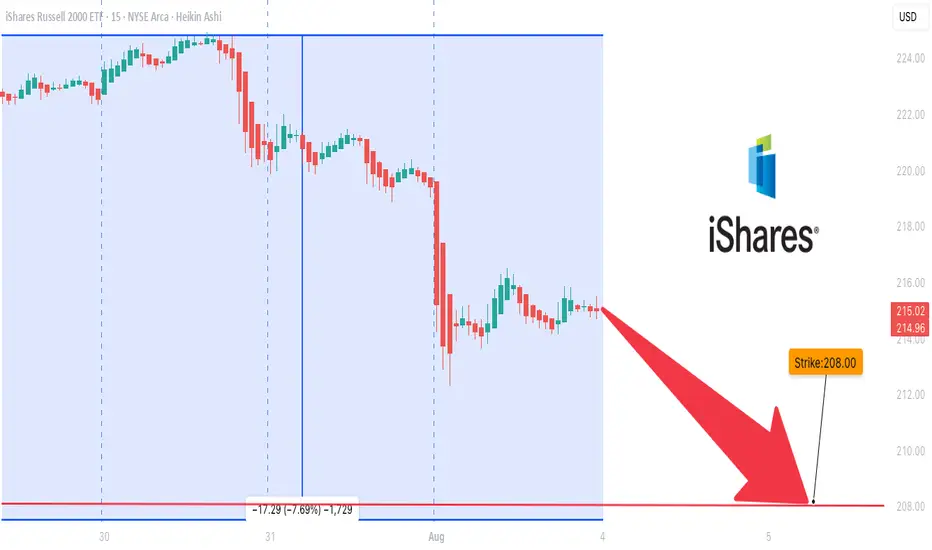
IWM is Overbought### ⚠️ \ AMEX:IWM Bearish Setup Alert — Weekly PUT Trade (Aug 3, 2025)
> **Momentum breakdown + institutional volume = high-probability short play**
📉 **Market Breakdown:**
* **📉 Daily RSI:** 34.9 → Bearish momentum under key 45 level
* **📊 Weekly RSI:** 53.0 → Neutral but slipping = trend weakening
* **📈 Volume Spike:** 1.4x → Institutional moves hint at potential sell-off
* **⚖️ Options Flow:** 1.00 C/P ratio → No bias = wait for price action
* **💀 Max Pain:** \$222.50 → Downward price magnet
* **🌪️ VIX:** 20.38 → Normal vol zone, good for option plays
---
### 💥 Trade Setup – 5D Weekly PUT
| Entry | 🎯 Target | 🛑 Stop Loss | ⚖️ R/R Ratio | 📅 Expiry |
| ------ | ------------- | ------------- | ------------ | ---------- |
| \$0.92 | \$1.35 (+50%) | \$0.45 (-50%) | 1:1.5 | 2025-08-08 |
🔻 **Strike:** \$208.00
💼 **Type:** Naked PUT
⏰ **Timing:** Enter at market open
📈 **Confidence:** 70%
🧠 **Logic:** Bearish RSI + volume surge + neutral flow = downside edge
---
### 🔍 Summary
> “IWM is losing grip. Momentum says down. Big players are already positioning.”
> 🔸 Short-term PUTs offer attractive R/R
> 🔸 Low volatility improves pricing
> 🔸 Weekly RSI still neutral → stay nimble
---
📊 **TRADE DETAILS**
🎯 Instrument: **IWM**
🔀 Direction: **PUT (SHORT)**
🎯 Strike: **\$208.00**
💵 Entry: **\$0.92**
🎯 Target: **\$1.35**
🛑 Stop Loss: **\$0.45**
📅 Expiry: **2025-08-08**
📈 Confidence: **70%**
🕒 Entry Timing: **Open**
---
### 💡 Tag It:
\#IWM #PutOptions #WeeklyTrade #BearishMomentum #RSIAlert #OptionsFlow #MaxPainTheory #VolatilityTrading #MarketOutlook #TradingView #OptionsAlert

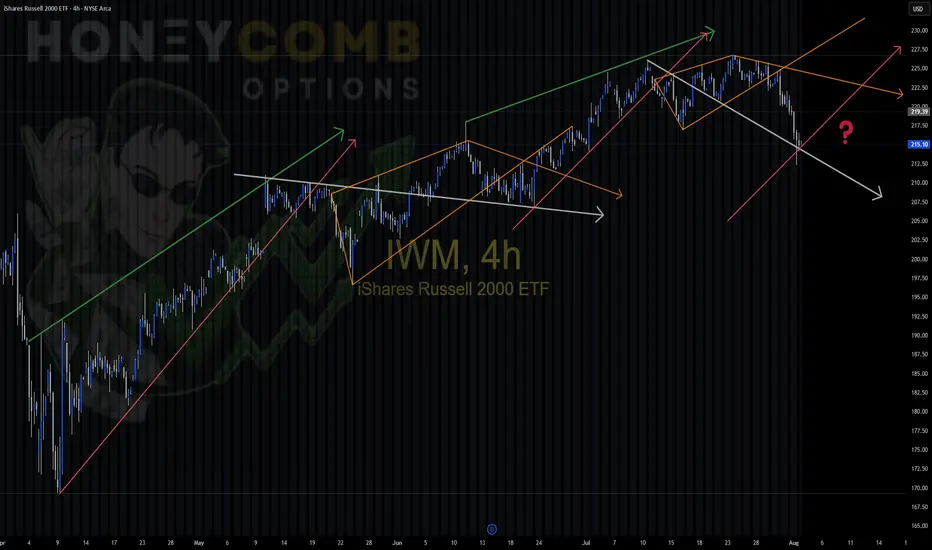
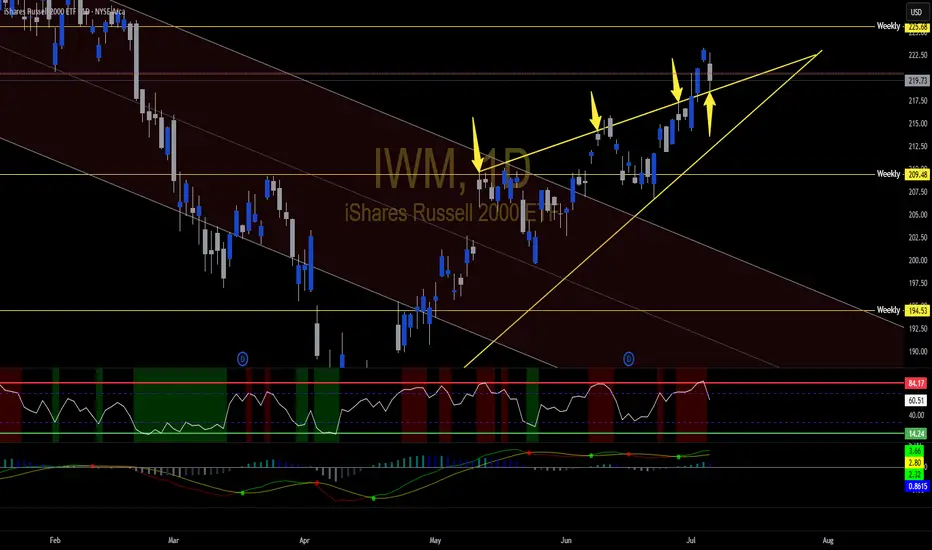
IWM repeating patterns IWM Playing around today noticed similar patterns in this uptrend, color coded for you convenience. Different sizes,, but the patterns are the same. Will we enter a new trend and start a different pattern, or will we stay in the same cycle?
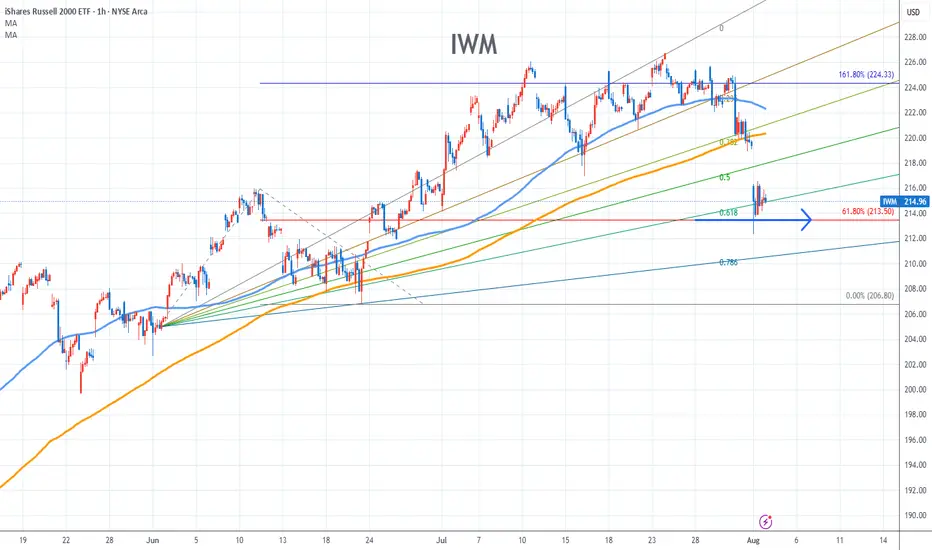
IWM Stock Chart Fibonacci Analysis 080125Trading Idea
1) Find a FIBO slingshot
2) Check FIBO 61.80% level
3) Entry Point > 214/61.80%
Chart time frame:B
A) 15 min(1W-3M)
B) 1 hr(3M-6M)
C) 4 hr(6M-1year)
D) 1 day(1-3years)
Stock progress:C
A) Keep rising over 61.80% resistance
B) 61.80% resistance
C) 61.80% support
D) Hit the bottom
E) Hit the top
Stocks rise as they rise from support and fall from resistance. Our goal is to find a low support point and enter. It can be referred to as buying at the pullback point. The pullback point can be found with a Fibonacci extension of 61.80%. This is a step to find entry level. 1) Find a triangle (Fibonacci Speed Fan Line) that connects the high (resistance) and low (support) points of the stock in progress, where it is continuously expressed as a Slingshot, 2) and create a Fibonacci extension level for the first rising wave from the start point of slingshot pattern.
When the current price goes over 61.80% level , that can be a good entry point, especially if the SMA 100 and 200 curves are gathered together at 61.80%, it is a very good entry point.
As a great help, tradingview provides these Fibonacci speed fan lines and extension levels with ease. So if you use the Fibonacci fan line, the extension level, and the SMA 100/200 curve well, you can find an entry point for the stock market. At least you have to enter at this low point to avoid trading failure, and if you are skilled at entering this low point, with fibonacci6180 technique, your reading skill to chart will be greatly improved.
If you want to do day trading, please set the time frame to 5 minutes or 15 minutes, and you will see many of the low point of rising stocks.
If want to prefer long term range trading, you can set the time frame to 1 hr or 1 day.
Quantum's Missed IWM Short 8/1/25Well had a moment where I backed out of a A+++ setup. IWM had a ton of -gex pull down to 206. Would have been a massive short to end the week. I canceled my order instantly for no reason at all and missed it. Overall had a great day but this is what separates the elite from the average trader. Will work on this next week.

IWM SETUP. Looks good for a long.Bouncing off the trendline where it was supposed to. Will it get to the top of the broadening wedge?
IWM Short1. Broader Market Structure 📉
1.1 Change of Character (CHoCH)
Occurred near the top (~226.70), breaking the prior higher low—signaling a shift from bullish to bearish momentum.
1.2 Break of Structure (BOS)
Confirmed by a move below that level, validating the bearish change and underlining a downtrend in progress.
2. Supply & Demand Zones
2.1 Demand Zones (Support)
Price zones where buyers have previously stepped in, marking potential reversal points:
Zone A (~223.00–223.50) – First layer of support; price tested this zone after the BOS.
Zone B (~221.80–222.20) – Mid-range demand area with historical buyer activity.
Zone C (~220.00–220.50) – Deeper support zone; last line before structural lows.
Key Takeaway: These zones represent probable stops for a short-term pullback and are ideal for long-entry decisions.
2.2 Supply Zone (Resistance)
~226.70–226.75 – Located at the level where BOS occurred; acts as near-term resistance where sellers may reassert control.
3. Price Action Inside the Bordered Area
Current Price (~224.55): Hovering between the supply and first demand zone.
Expected Movement:
A pullback into Zone A (~223.00–223.50).
If demand holds, look for a bullish reaction—forming a higher low, potentially pushing price back toward 226.70+.
Bearish Risk: A break below Zone A increases downside risk into Zone B or C, reinforcing the bearish structure.
4. Momentum & Structure Outlook
Bullish Scenario: A bounce from demand with structure preserved (~higher low) could lead to short-term upside into resistance.
Bearish Scenario: A drop below the bordered demand zone would confirm continuation of the downtrend.
Watch: Price structure around the 224–223 area and reversal cues (e.g., rejection candles, volume spikes).

IWM short 224 and 224.25Shorted IWM going into resistance
on daily. Target is 216 I will take 3/4 off re add when breaks
the 50 day 212.57 and 100 day 205.12 watch daily stoch see they roll over
Look weekly rolling over but needs break 68%. Look weekly making lower highs
See we can get a follow thru selling today with more selling vol
Have trailing stop in place

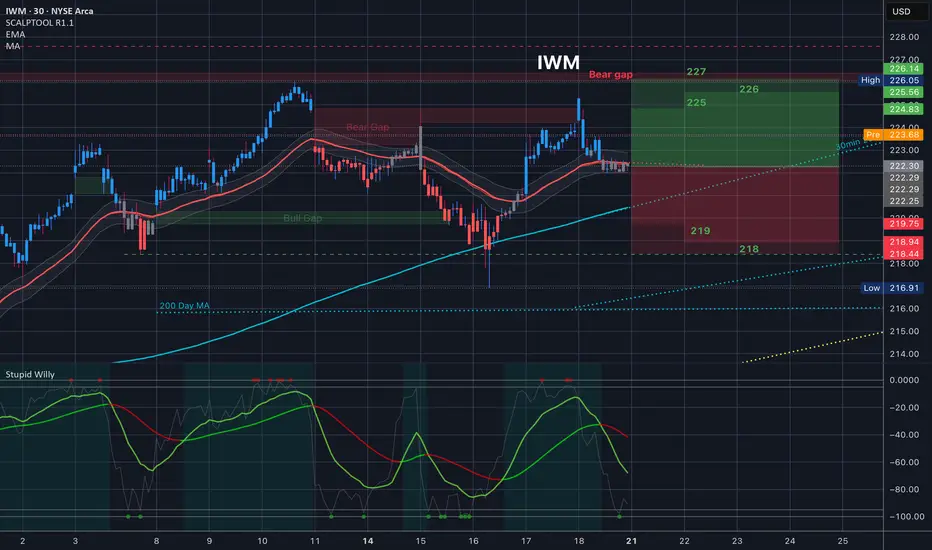
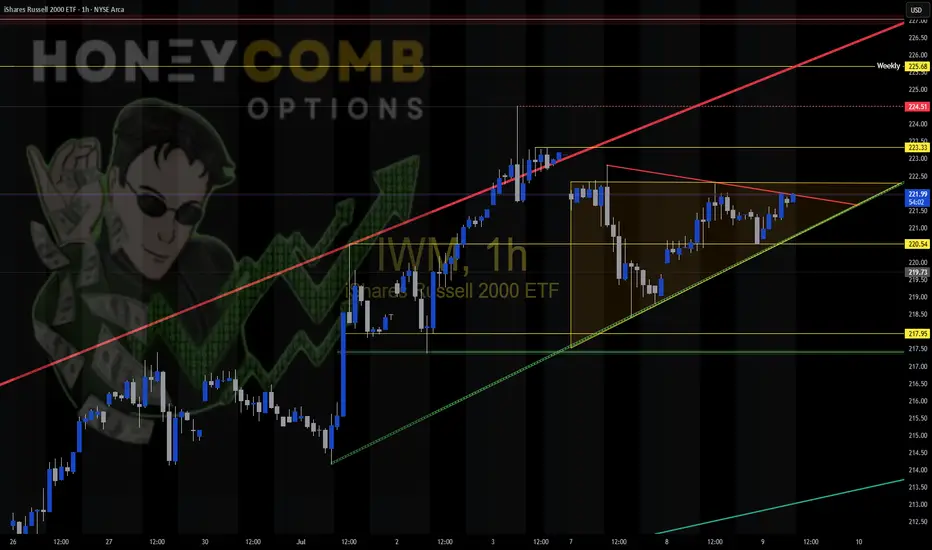
$IWM Trading Range for 7.21.25 and everything in itToday’s Trading range and everything in it. How are you playing it?
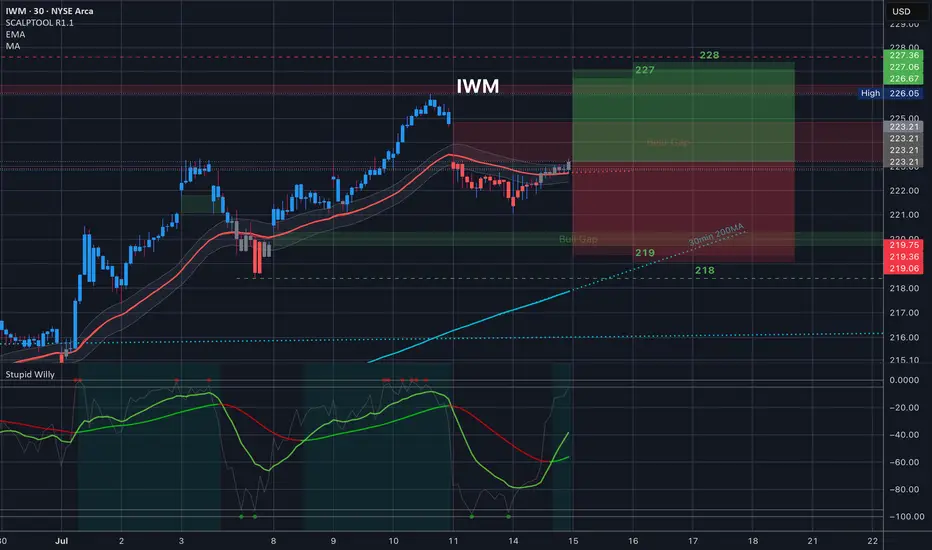
$IWM Trading Range for 7.15.25 and everything in it for CPI Tomorrow’s Trading range for CPI inflation data and everything in it. How are you playing it?
$IWM Tomorrow’s Trading Range and everything in it /// 7.14.25Tomorrow’s Trading range and everything in it. How are you playing it?
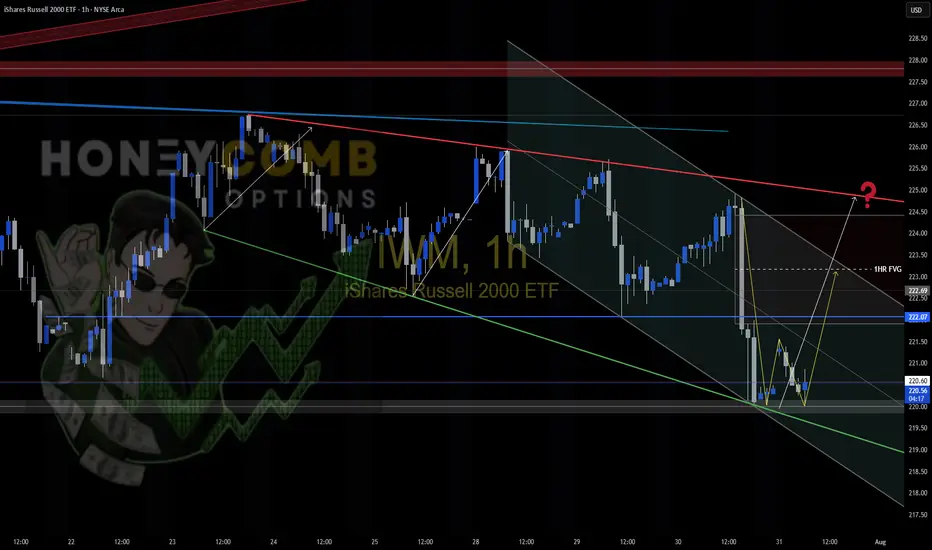
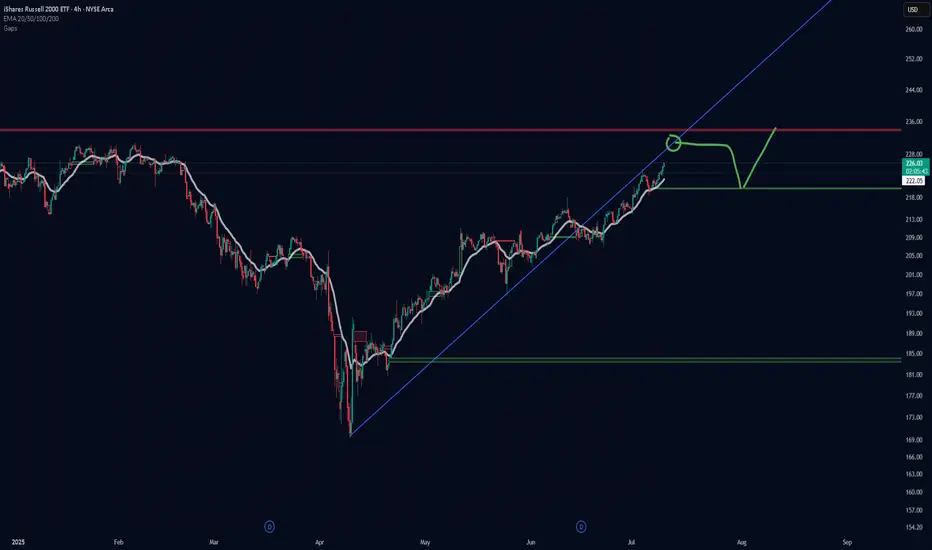
IWM projected pathI have three rooms full of supercomputers and then a few laptops in a spare bathroom plus a refrigerator in my wife's cardboard box running simulations 24/7 about the projected path of the Russell. Based on their findings I have determined that our previous support is now the resistance. When we come into contact with this resistance we will begin to work our way back down to fill the gap before continuing up to achieve a new all time high. When we hit resistance I have prophesized that will go mostly sideways for a numbers of days before we drop down to fill the gap. Thank you. Praise the Lord.
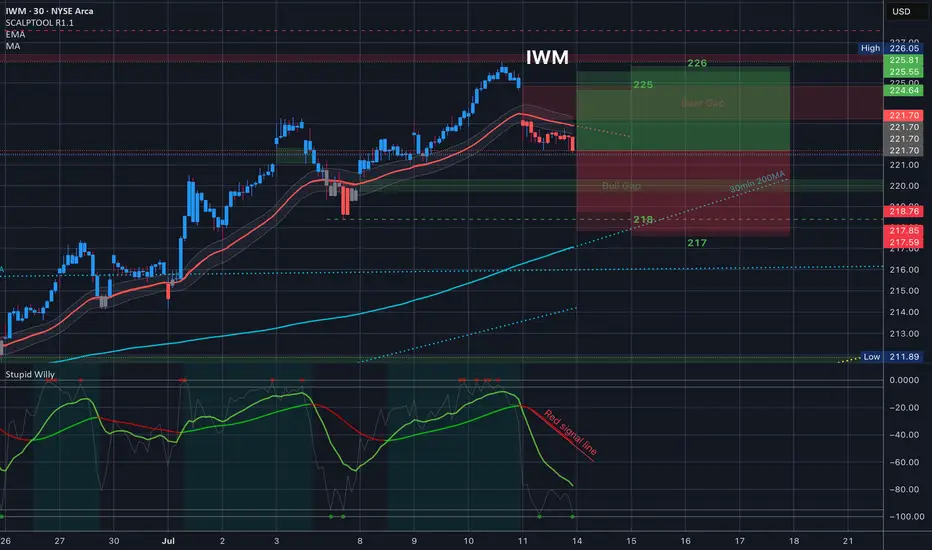
$IWM Tomorrow’s Trading Range and everything in it /// 7.10.25
Today’s Trading range and everything in it. How are you playing it?
Really the only thing in the trading range is a bear gap and 35EMA. Easy Trading Range

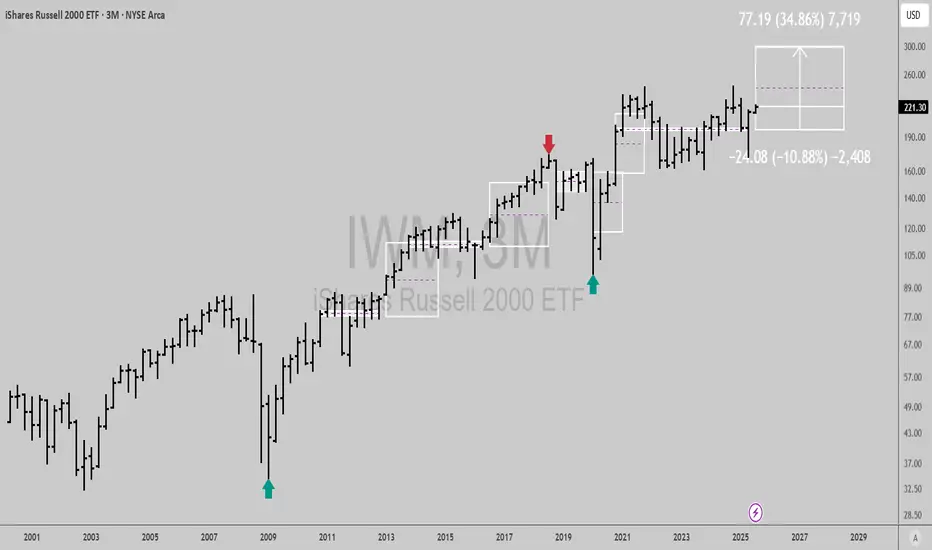
$IWM: Quarterly signal and Fundamental CatalystsQuarterly chart signals from time@mode show AMEX:IWM is bullish, with just 10% downside risk and over 34% upside potential into Q3 2028 or sooner.
Let's break down the key catalysts for the year ahead:
Fed rate cuts are expected to boost small cap stocks by lowering borrowing costs.
Small business sentiment is at multi year highs, supporting Russell 2000 earnings growth.
Valuations remain attractive: AMEX:IWM trades at a discount to large caps, with room for mean reversion.
Sector rotation: Money is flowing into industrials, financials, and cyclicals, core IWM sectors.
Risk reward is compelling: Upside vs risk and strong macro and earnings tailwinds make this a high conviction long idea for the next 12 months and beyond.
Best of luck!
Cheers,
Ivan Labrie.
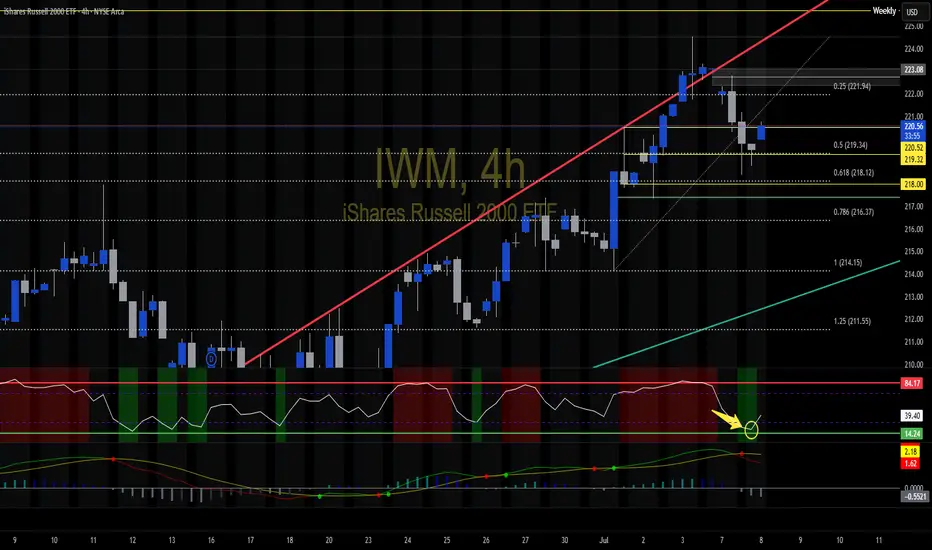
IWM 4hr chart cannot tell a FIBIWM bouncing out of the FIB golden pocket.... With the daily and this I like the odds of upside continuation..
$IWM 4 hour cup and handleLooks like a cup and handle pattern formed with a retest of the neck line.
A break above $215.53 would confirm bullish momentum back in. A break and hold below the neckline would invalidate the pattern.
Happy hunting!


$IWM is set for a Blow-Off Top - 34% UpsdieAMEX:IWM is about to have a blow-off top moment!
Catch up mode engaged...
- Breakout of downward trend
- Volume shelf launch
- Rate cuts inbound
- Suppressed for 4 years
PTs: $244/ 259/ 276 (MM)

IWM Showing rising wedge with DivergencePay attention to the outside trendlines. Holding 214.40ish area is really bullish
