NET - Breakaway Gap (huge volume!)NET gap out of a right angle triangle with extremely huge volume. This is likely to be a "breakaway gap" which usually occurs at the beginning of a trend and the odds of this gap closing in the near future is slim.
There is a near term possible resistance coming up (filling of a prior gap) at around 77-78. Any dips going forward should be opportunity to long as there is room on the upside.
Disclaimer: Just my 2 cents and not a trade advice. Kindly do your own due diligence and trade according to your own risk tolerance and don't forget that money management is important! Take care and Good Luck!
NET trade ideas

NETI have been seeing this in a few sectors, but I see a Wyckoff Distribution (#2) occurring here as well. There is a gap at around $50 that I'm expecting it to fill.
1Y
RSI is topping.
MFI is overextending.
5Y
RSI is rising.
MFI is trending up.
ALL
RSI is showing a short incline, but could be peaking at 20 for a drop down after.
MFI is in a decline.
Volume also looks to be trending lower with lower highs.
The indicators could give a case for going higher with some of them being bullish.
Prediction: I believe we will see this fall.
For my educational purpose, not to be used as financial advice.

$NET with a Bullish outlook following its earnings #Stocks The PEAD projected a Bullish outlook for $NET after a Negative over reaction following its earnings release placing the stock in drift C.
$NET, THE DISCOUNT OF THE DECADEBuying Cloudflare stock at these levels, and what seems to be an approaching opportunity to buy it at ~$30 is just an incredible discount.
Myself and so many other developers around the world love building and deploying on Cloudflare, it's amazingly cost-friendly with a lot of free entry plans to get started at no cost. I am uber bullish on developers in general, it's a space that will grow exponentially. So many kids are growing up, wanting to code and deploy projects and Cloudflare makes it easy for them to get started at no cost, this is huge. When these kids grow up, they will be advocates for Cloudflare, they will pay it back. They will scale their web apps on Cloudflare, they will spend their money with the company that let them start building at no cost. It's what they'll be familiar with and Cloudflare will have a suite of products that will fulfill their needs.
Cloudflare builds the right product and they build it fast.
The founder is the CEO. They have a great leader at the helm who lives and breathes the space -- natural and passionate innovator. This is someone I have full confidence backing.
Cloudflare continues to grow 50%+ YoY. This is the time to buy company's that are continuing to grow, despite the conditions of the economy. ibb.co
As for the technicals, it sure seems that we are on the C wave of an ABC correction. I also added some trend lines that may or may not be respected. I am eyeing a bounce around $31 in late August.
This is not financial advice. This is my personal opinion.

NET - LongCloudflare, Inc. is an American content delivery network and DDoS mitigation company, founded in 2010. It primarily acts as a reverse proxy between a website's visitor and the Cloudflare customer's hosting provider. Its headquarters are in San Francisco, California.
NET is about to test a significant level. NET is expected to go up after testing this $40 zone. Support-Resistance here, just in case you are wondering.

NET - Super Bearish (Look out Below)...NET - Fundamentals look terrible, Candlesticks and price action is all leading BEARISH. I will look to buy long term puts (LEAPS) if we retest into the red box.

Buying Opportunity: Cloudflare (NET)Chart analysis is showing that Cloudflare (NET) is trying to form a bottom at an important Fibonacci level. Currently, there is momentum to the downside on the daily chart and a gap to be closed at 46.38. It's therefore likely that with the downward momentum, NET will attempt to close this gap and then quickly rebound up to 59 as it will also try to maintain price at or above this level for the monthly close. The weekly charts are already showing bullish signs and the asset's underperformance relative to the S&P 500 has already slowed down, which virtually always occurs right before a reversal. The Wave Trend Oscillator by @LazyBear shows that momentum to the downside on the highest timeframes is already bottomed and will soon start to revert back to the upside. On the daily chart, Heikin Ashi candles and Fibonacci Bollinger Bands also show signs of a bottoming pattern forming. The daily RSI has been showing bullish divergence since May. Therefore entering NET at prices around the gap closure at 46.38 could be a great risk-reward entry for long-term investors. Although anything is possible, it's statistically unlikely that NET will make a full retracement and fall much lower than the gap closure. In the years to come, Cloudflare will likely go to the moon.
Not financial advice.

$NET - Found support, Bounce in playCloundflare found the support and could bounce to $65. If the environment permits, it could even go to $77 area.
Target 1 - $65
Target 2 - $77
Not an investment advice.

Inside Day w/ BOS tradeDowntrend Break of structure and Inside day breakout
30min break down and pullback brought puts on continuation downward.

$NET accumuationCloudfare net flow bullish - even after this huge sell off accumulation is up.. all time vwap 72

NET Best entry at 60 Potential short - Nice options entry!Falling down below red cloud before earning report - low reading MFI - Still forming higher lows - if break down recent bottoms then possible target 65-60-55-50. Current at 90.74 and support at 85-82

NET has entered extreme support zone!better to wait for confirmation move now, longs will pay if we can hold and this zone again and then break above 65.43
but our short trigger is at 47.83, below there we see a lot more blood!

Cloudflare | NET | Short to SupportCloudfare ( NYSE:NET ) looks weak and ready to fill the gap below and retest support ($80 or below). If it really starts to slip, it may want to go for $70 (dotted blue line). However, caution should be used if this just wants to gap fill and then make a run up to the 200 EMA again. But, in the near-term (with the Federal Reserve meeting and OpEx this week), it may want to bleed down.

Net AnalysisLooking at the weekly and daily chart. It is creating good bearish flag. I am considering two scenarios here.
1. Triple bottom bounce with in the range in the upper territory
2. Breakdown and start following the pole length.
Also, looking at the flow, there is a bearish flow. Will be performing more fundamental analysis on it to understand and predict er

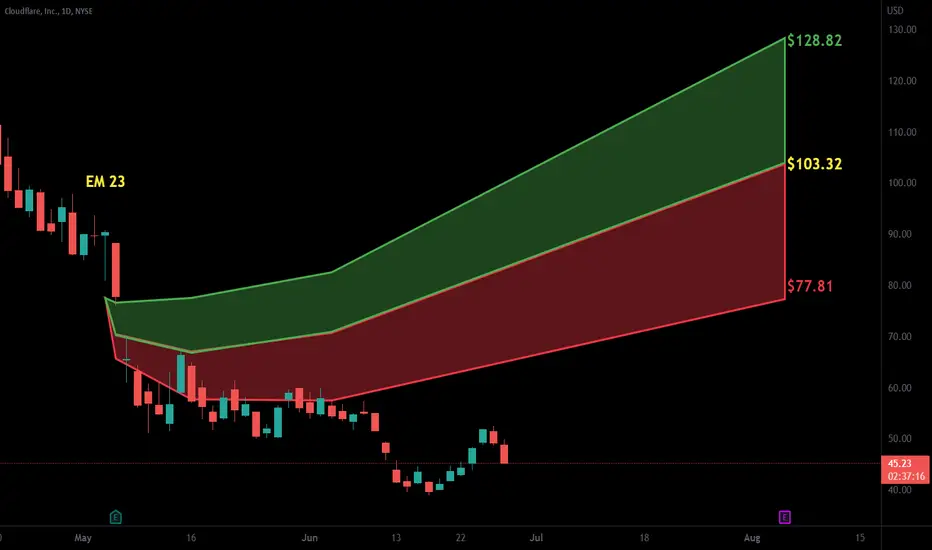
NET - Is it Worth Risking for 130% Upside?Do you believe in Cloudflare enough, the company which is still not profitable, to invest at this stage?
Fundamentally: although revenue grows exponentially the company is not making any profits, there is not much else to add and a lot will depend on the upcoming earnings report
Technically:
It is very tricky to analyse Cloudflare as it is a relatively young company and at its infancy development stage hence there is not much to assess on the graph
The proposed scenario, which is one of many, may look plausible if to consider that cyber security industry is crucial more than ever these days
One may count an impulse in the wave formed from March to November 2021. However, this scenario is based on the premise that this move was part of a Running Flat correction which completed in January 2022
Since then there were two impulse like movements that can be interpreted as zig-zag of the first impulse in the developing Ending Diagonal
Is it possible that this scenario may play out? Let's see the report and will revisit this thought.
However, at the moment it might be risky to go either way.
What do you think about this idea?
Please share your thoughts in the comments and like this idea if you would like to see more stocks analysed using Elliott Waves.
Thanks

NETHaven't really traded this name but this setup is interesting. Rejecting all ma's but the 50. Stuck between ATH VWAP & YTD VWAP. Hard for me to be longer-term bullish if below the 200 sma, so will be looking for short setups currently if anything.

NET downside ideaNoting downward converging 5/9/20 EMAs on the daily. Testing Uptrend Line. MACD has already bear crossed. NET can be a big mover as a growth cybersecurity stock so watching this one for big moves this coming week.

$NET Swing Idea for 4/7Swing Idea For 4/7
$NET under 106 97-100 possible
*only valid if market ($SPY in this case) pushing down/red
#options #optionstrading

Double bottom breakoutNET moving strong past week, needs to cross 200 day to further confirm bullish thesis. Watching for a possible pullback as RSI is a bit overbought.

$NET Trading it 3/29, Top Gainer Playabove 127.5 (with test for support)
132-135 possible intraday
idea only valid if market green/positive 2morrow
#optionstrading #options #daytrading #tradeideas #stockmarket


CloudFlare Inc looks confidentSo far TA shows 2 years of confident uptrend.
Now trying to push above Feb high. Chances of heavier correction doubles as price moves to hotter area of resistance.
Looks healthy to enter after a local retrace.

$NET - Potential for upsideOf the positive factors
1. The price has been consolidating above the support level around $85 since January
2. Price has pushed back from the rising trend line that began in March 20.
3. Buy volume prevails.
4. RSI on the weekly timeframe is trying to rise above 50.
5. MACD is trying to break through the signal line upwards.
6. Relative Strength is greater than 0 - which indicates the strength of the stock.
Negative points
1. trades below the 30W EMA
2. trades slightly below the $119 resistance level
Given the demand of the information security market, could go higher. To buy can be considered upon a correction at the $100 level, or after a breakout of the resistance level and a price move above $123. The next buy level after the breakdown on the volume of the 30W EMA level (around $135.5-$136)
Growth target above$ 210.
