QQQ Market Context – Where We StandQQQ has been grinding higher and is now pressing into a major resistance cluster at $590–$595. This is not just a random line in the sand — it’s a confluence of long-term channel resistance (weekly chart red lines) and short-term supply zones (15m chart).
Whenever price tests a heavy resistance cluster like this, the risk/reward equation shifts: upside potential shrinks while downside risk expands. That doesn’t mean the uptrend is broken, but it does mean chasing longs up here is dangerous. Smart money tends to lighten up at resistance and reload lower. Weekly structure: QQQ is still in a broad uptrend channel. Pullbacks into green support lines have consistently been bought.
Trading Scenarios
🔴 Bearish Reversal (High-Probability Play)
Look for QQQ to stall between $590–$595. Watch for reversal patterns (double tops, bearish engulfing, lower highs on 15m).
Shorts here offer defined risk/reward: Stops just above $600, downside targets at $580 → $574.
QQQ trade ideas

Opening (IRA): QQQ Oct 17th -538P... for a 6.85 credit.
Comments: Selling the 25 delta strike here on weakness.
Metrics:
Buying Power Effect: 531.15
Max Profit: 6.85 ($685)
ROC at Max: 1.29%
50% Max: 3.43 ($343)
ROC at 50% Max: .65%

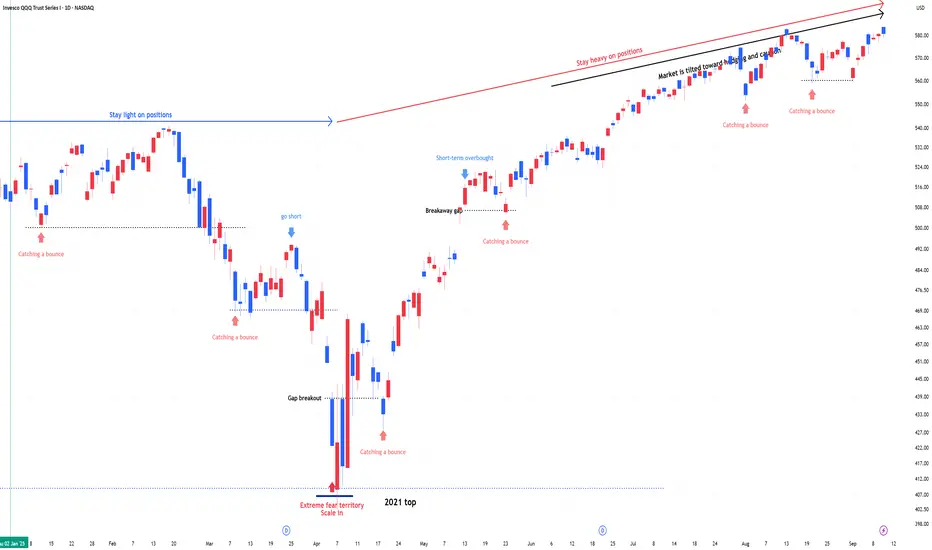
QQQ : Stay heavy on positions (QLD, TQQQ)QQQ : Stay heavy on positions
In stay light on positions zones, I hold QQQ and reduce exposure.
In stay heavy on positions zones, I increase allocation using a mix of QLD and TQQQ.
** This analysis is based solely on the quantification of crowd psychology.
It does not incorporate price action, trading volume, or macroeconomic indicators.
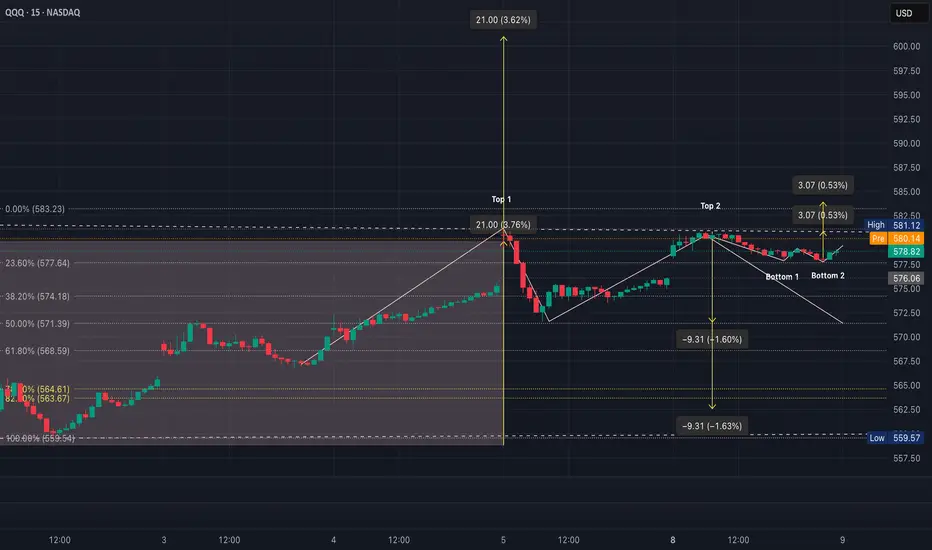
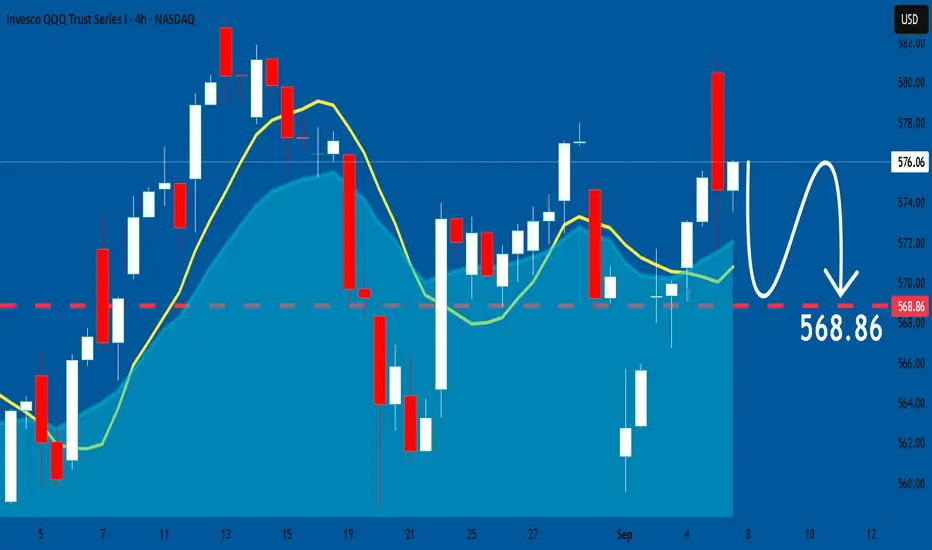
QQQ Levels in PlayQQQ is coiling between $577–$583
$583.2 (Top 1/Fib 0%) is major resistance
$581 (Top 1/recent high) is lower high rejection
$578–$579 (current) sits just above Fib 23.6% (~$577)
~$571 (Fib 50%) is mid-support
~$568 (Fib 61.8%) is a critical downside pivot
$564–$563 (Fib 78.6%–82.6%) is a possible deep retrace
In short,
Above $583 = breakout
Below $572 = breakdown
Between = chop trap
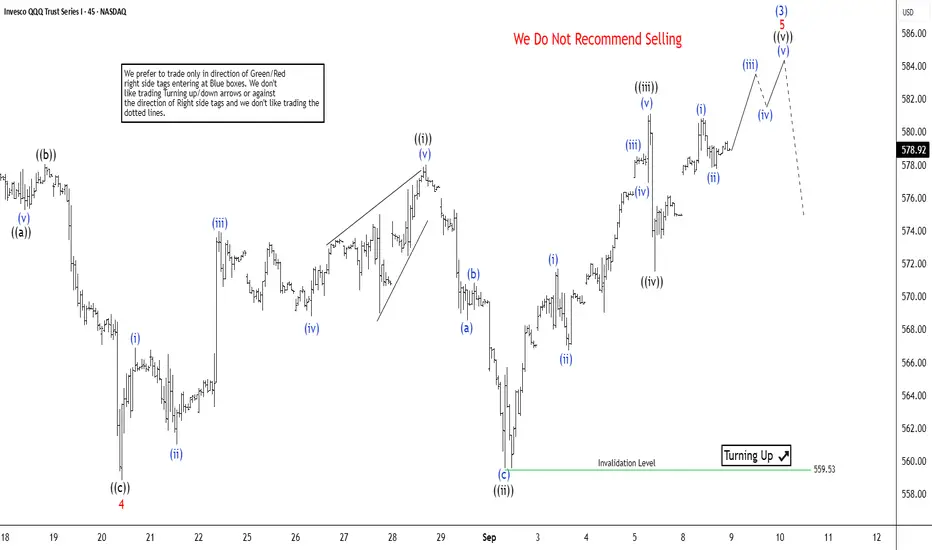
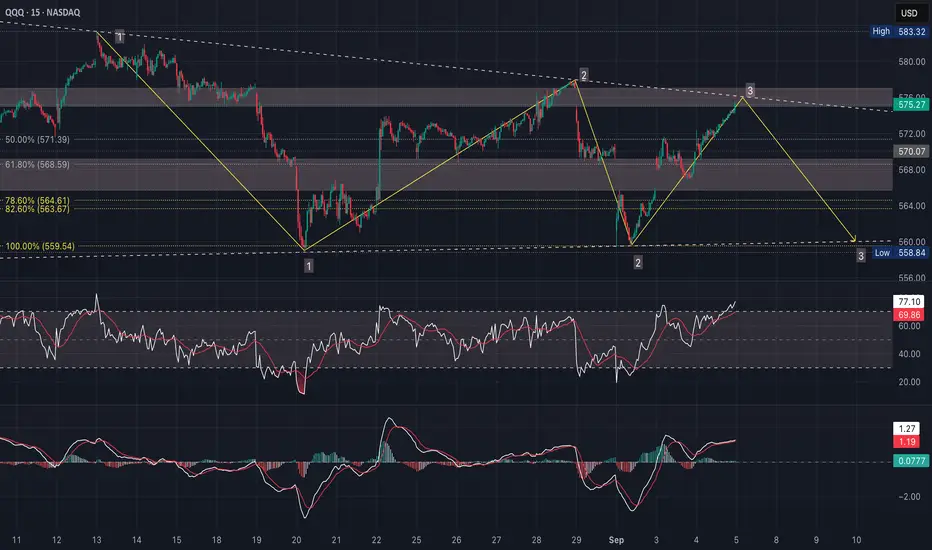
QQQ Nearing wave (3) Termination at 589The short-term Elliott Wave analysis for the Nasdaq 100 Index ETF (QQQ) indicates it is approaching the completion of wave (3) from its April 2025 low. This wave (3) unfolds as a five-wave impulse structure. Wave 1 concluded at 467.83, followed by a wave 2 pullback to 427.93. Subsequently, wave 3 surged to 583.32, and wave 4 retraced to 558.84, as illustrated in the 45-minute chart.
Currently, wave 5 is developing as a diagonal pattern. From the wave 4 low, wave ((i)) peaked at 578, with wave ((ii)) dipping to 559.53. Wave ((iii)) then climbed to 581.12, followed by a wave ((iv)) pullback to 571.53. As long as the ETF remains above 559.53, it is poised to extend higher in wave ((v)) of 5, which should also finalize wave (3) on a higher degree. The potential target for wave 5 lies between 589 and 598, calculated using the 123.6% to 161.8% inverse Fibonacci retracement of wave 4.
This analysis suggests a bullish near-term outlook for QQQ, with the ETF likely to reach the projected range before completing wave (3). Traders should monitor the 559.53 support level to confirm the continuation of this upward move. The structure remains intact, supporting further gains in the short term.
QQQ Today’s Rally ≠ Bullish BreakoutToday’s rally into resistance doesn’t cancel the bearish structure - it just tested the ceiling again, like the ball bouncing off the ceiling one more time
Price bounced, yes, but it stopped right at the descending trendline and supply zone
Until QQQ clears $577–$580 on volume, this is just another lower high
RSI still under 60 on the daily
MACD still bearish crossover
Bearish setups need bounces since sellers actually want rallies into supply
Today’s move just brought price back to the spot where bears previously took control
The deciding factor is whether tomorrow’s NFP release causes a breakout above $580 (bullish) or a breakdown below $562 (bearish)
Descending triangles usually resolve downward (break of the flat base)
A clean daily close <$562 would trigger measured move targets
Until $562 breaks on volume, it’s still just compression
Sometimes triangles fake down, trap shorts & rip higher (especially with macro catalysts like NFP)
If $576 rejects, short to $562–$558
If $577–$580 breaks (bulls win), step aside or flip long toward $583+
The Fib retracements line up neatly,
50% = $571.39
61.8% = $568.59 (sits right inside that shaded demand area)
78.6% = $564.61 & 82.6% = $563.67 (exactly where buyers defended)
100% = $559.54
This layering creates a ladder of potential supports, but also a measured path for shorts
The 1, 2 & 3 path into $559–$560 matches the 100% extension of the prior move
This is where measured move & Fibonacci confluence meet
Bears could take profit on the way down at $568.5 to $564.5 & $560
If $559 breaks with volume, extension opens toward $547 (200d SMA) which would be the larger “unwinding” target
Invalidation is simple, if daily close >$577–$580 trendline
While in-play, each Fib level gives you a chance to trail stops down
Trendline + Supply Zone + Symmetry + Fibonacci = high-probability short setup
Price = supply zone/descending trendline
RSI = overbought on the 15m & below the midline slope & capped under 60 on the daily
That’s a sign of weak momentum - each bounce fizzles out earlier
The RSI trendline itself is descending, which mirrors price
MACD = potentially topping on the 15m & still bearish crossover on the daily with it's histogram contracting slightly, so momentum is still in bear mode, with only a weak attempt at recovery
Momentum: RSI + MACD both confirm sellers are in control of the bigger picture
If NFP or another catalyst sends QQQ through $577–$580, watch for RSI breaking above 60 (momentum shift) & MACD histogram flipping positive with a bullish cross
That would negate the bearish triangle & turn this into a breakout squeeze toward $583+
QQQ Market Preview for Monday, September 8Price Action & Market Structure
* QQQ is trading around 577.7, stabilizing after a sharp morning dip toward 569.0 and a bounce back.
* Price is now consolidating between 576–578, showing indecision after recovering.
* Structure remains bullish above 576 HVL support, but bears will try to push it back toward 572–569 if that zone breaks.
Key Levels
* Resistance (Upside Caps):
* 578–580 → Immediate resistance / Gamma Wall.
* 582–583 → Next resistance cluster.
* Support (Downside Floors):
* 576 HVL → Key pivot support.
* 575–572 → Minor Put support zone.
* 569.0 → Strong support (recent low).
* 567 → Deeper Put Wall support.
Options Sentiment (GEX & IV)
* GEX: Bearishly skewed with Puts at 86.6%, suggesting hedging flows lean downside.
* IVR: 14.3, moderate but not extreme, showing some expected volatility.
* Gamma Walls:
* 580 = Major Call Resistance.
* 576 HVL = Key balance level.
* 572 / 569 = Put-heavy support.
Indicators
* MACD (15m): Rolling over after bounce, showing fading short-term momentum.
* Stoch RSI: Near oversold after pullback → could allow another push higher if 576 holds.
Scenarios for Today
Bullish Case (if 576 holds):
* Hold above 576 HVL, reclaim 578–580.
* Targets: 582–583 Gamma Wall zone.
Bearish Case (if 576 breaks):
* Drop back to 575–572 zone.
* If weakness persists → test 569.0, deeper downside toward 567.
Trading Thoughts
* Longs: Favor dip entries at 576–575 with bounce confirmation, targeting 580–582.
* Shorts: Fade rejection at 578–580, stops above 582.5.
* Stops:
* Longs → below 572.0.
* Shorts → above 582.5.
Summary
QQQ sits at a key balance zone (576 HVL). If support holds, bulls can push back to 580–582, but heavy Put exposure plus resistance at 580 may cap upside. A break below 576 flips bias bearish, targeting 572–569. Options sentiment is defensive, suggesting upside will be a grind unless bulls take control early.
⚠️ This analysis is for educational purposes only, not financial advice. Always manage risk carefully.
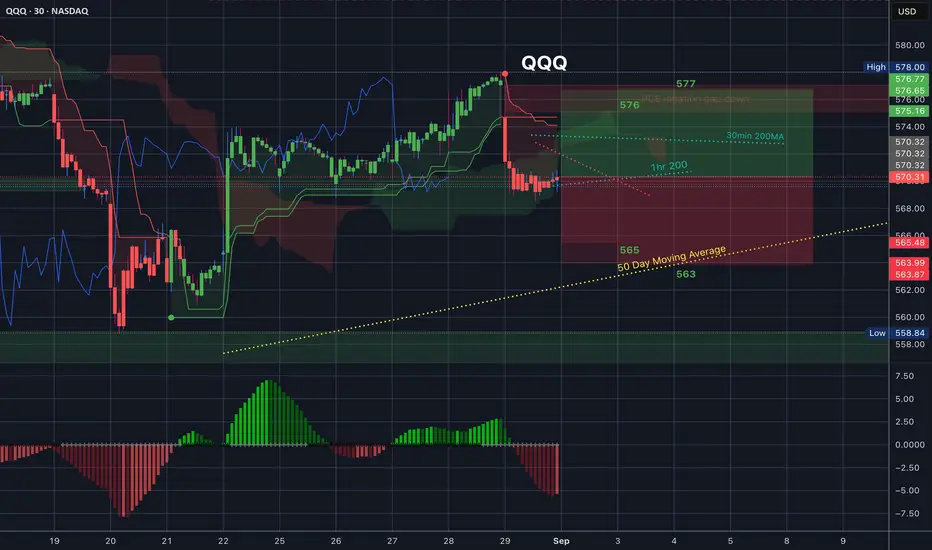
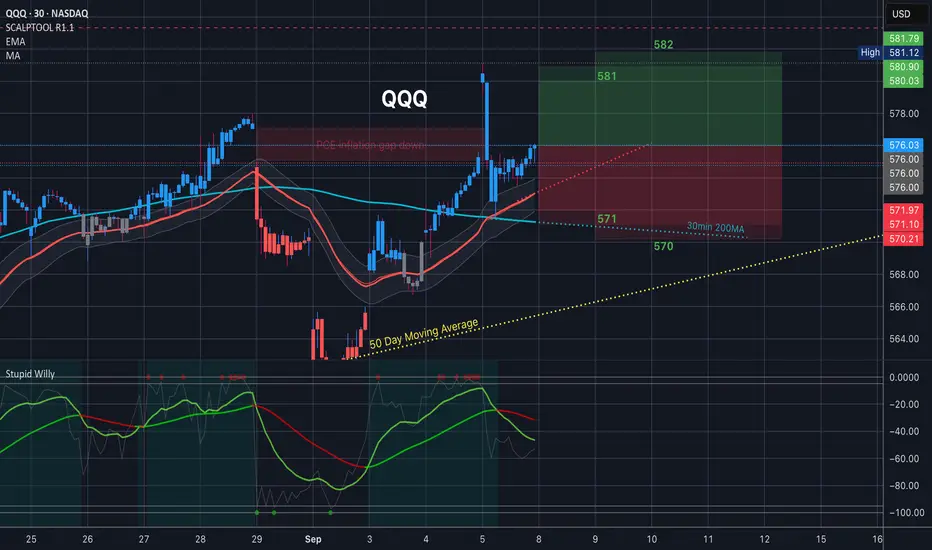
$QQQ Analysis, Key Levels & Targets 9.8.25
Watch that downward facing 30min 200MA - that looks like trouble.
35EMA and 30min 200MA are the only levels in tomorrow’s range so I would look down, personally
Will Bears Follow Through after Terrible Job Numbers?QQQ CME_MINI:NQ1! CME_MINI:ES1! stock market Forecast
Nvidia Stock NASDAQ:NVDA Forecast
Apple Stock AAPL Forecast
Microsoft Stock MSFT Forecast
Google Stock GOOGL Forecast
Amazon Stock AMZN Forecast
Meta Forecast Technical Analysis
Tesla Stock NASDAQ:TSLA Forecast
Magnificent 7 stocks forecast

QQQ Macro + Technical for QQQMacro supports the bullish continuation case ($600–$630), unless $568 breaks & macro data worsens
Fed pivoting dovish, disinflation holding, AI-driven earnings resilience & strong liquidity
High valuations, crowded positioning & possible macro shocks (yields spiking, geopolitics)
The $568 neckline & $583 breakout line up with the macro inflection
Fed easing cycle starting is bullish fuel if neckline holds
Any surprise inflation/yield spike results in a neckline break, correction to $550
Next 2–3 Weeks
1.Bullish Breakout $583 to $600–$616 (50%)
Supported by Fed pivot + earnings resilience
2. Bearish Breakdown $568 to $550–$537 (35%)
Triggered by yields/inflation surprise or positioning unwind
3. Chop/Range ($568–$583) (15%)
Market waiting on Fed September decision
Macro + techs both say trend up until proven otherwise
$568 = line in the sand, if it breaks, macro headwinds (yields, inflation) must be the culprit
$583 breakout would be macro + technical alignment = high conviction run to $600+
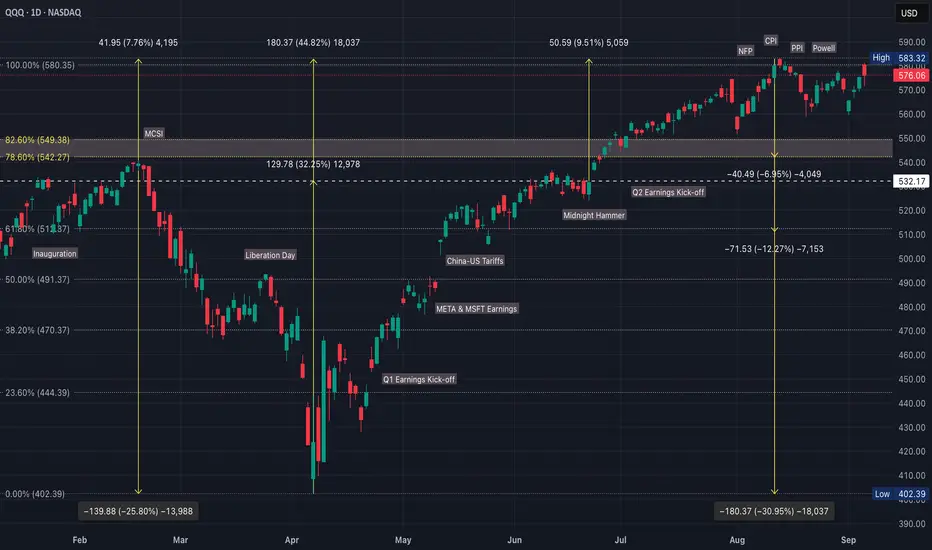
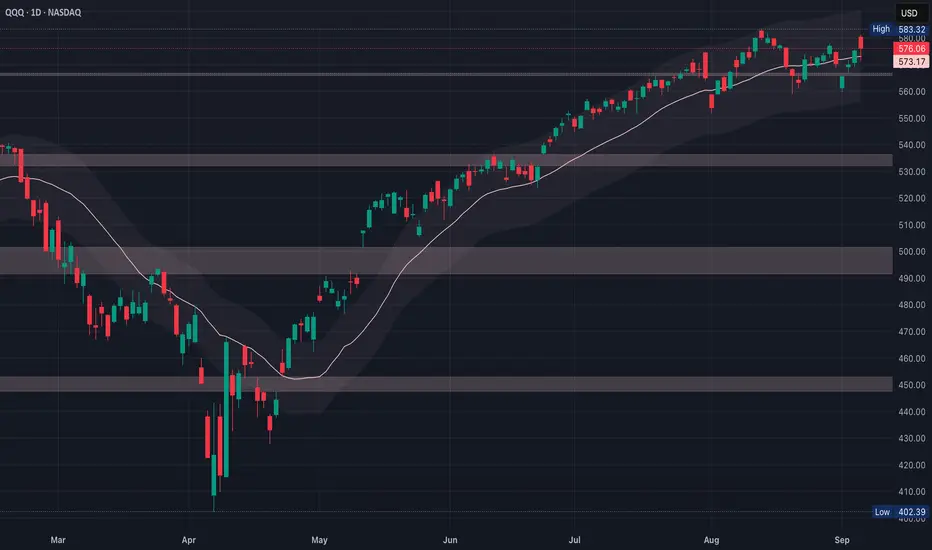
QQQ Bearish Reversal vs Bullish ContinuationQQQ broke out of a huge consolidation box (2024 into early 2025)
That breakout projected a measured move of ~144 points (26%–36%), targeting $600–$630
Price indeed advanced strongly toward that zone before stalling
1. Bearish Case (head & shoulders or double top plays out)
Breakdown below $568 with a target of $550, then maybe ~$537 (S2 pivot) if selling accelerates
That’s about a 4%–5% correction, which is normal within an uptrend
Double top is the cleaner, simpler read on this chart
Head & shoulders is more complex and requires symmetry, which isn’t perfect here
Both patterns target almost the same zone (~$550–$553), but the double top is easier to defend technically
2. Bullish Case (breakout resumes)
Hold $568, reclaim $583–$585 & push into $600 (R2)
Full measured move already points to $616–$633 longer term (R3–R4)
Probabilities (with macro context)
Continuation (push to $600–$616) @ 50%
Correction ($568 break to $550–$537) @ 40%
Extended chop ($568–$583 range) @ 10%
The breakout from that massive 2024–2025 range still dominates the chart & trend is up until $568 fails
The local Head & shoulders/double top is a warning sign, but not a confirmed reversal yet
The market is essentially asking, do we consolidate near highs before another leg up, or do we shake out to $550 first?

QQQ: Bearish Forecast & Outlook
Our strategy, polished by years of trial and error has helped us identify what seems to be a great trading opportunity and we are here to share it with you as the time is ripe for us to sell QQQ.
Disclosure: I am part of Trade Nation's Influencer program and receive a monthly fee for using their TradingView charts in my analysis.
❤️ Please, support our work with like & comment! ❤️
QQQ (5 September)The slope of the lines matters for pattern bias
Sloping slightly down from $583 to $580
Holding flat around $563–$565
That shape is actually closer to a descending triangle
Bearish continuation if support breaks
But here’s the nuance,
Descending triangles typically form after a downtrend, as continuation
QQQ is in a strong uptrend, so even if the geometry looks bearish, context says bulls still have an edge
In uptrends, these patterns can fail bearishly & instead resolve higher, especially if support keeps holding
So the pattern could be read 2 ways,
Descending triangle with support at $563 breaks = $545–$550
A coiling consolidation under resistance, which still may resolve upward given the broader trend
The key difference will be whether $563 breaks down or holds
Bearish breakdown (descending triangle plays out) at 35% because the macro trend is up since April & bulls usually defend support zones first, but if $563 breaks with volume, bears gain momentum quickly
Bullish breakout (uptrend prevails) at 50% because of the broader uptrend + strong dip buying since April
Each rejection at $580 has been shallow, showing underlying demand
Price keeps oscillating between $563–$580 for another week at 15% in the short run, but if it drags on too long, the eventual breakout becomes stronger
9/4/25 - $qqq - How i'm positioned ep 39/4/25 :: VROCKSTAR :: NASDAQ:QQQ
How i'm positioned ep 3
- it's hard not to notice the q's and the spy's are about 50 bps away from a gap fill
- while i'm a strong believer in the efficient market hypothesis (lol - i'm kidding), with googl's timely headline driving risk higher, today's whatever bid getting bid and "rate cuts" as a known known driving "narrative" bid... it all just feels so roll-over-y
- lulu tn just basically confirms... besides having ms sweeney providing green dillys across basement dwelling "portfolios"... the consumer is, has been, and will be cooked like a road kill goose... and rate cuts won't help
- even my NYSE:ONON feels like something i need to manage more lightly.
- it. is. just. hard. to. own. anything.
so i just took down risk a lot.
i'm about 30% cash. tempted to get to 35 or 40%
- still packing a solid 55% obtc, but well hedged w/ ibit puts (as i've described)
- onon leaps at 5% at 3-1 (but honestly it's probably too big)
- smlr to play the mstr headline, but it's honestly just an obtc/ mnav arb exercise w/ shorter term triggers and allows me to keep risk on exposure to btc while managing cash
- nxt still a staple, but it's only 5% of the portfolio at 2-1 leverage (so 10% gross). feels like the only one i have confidence in, but it's performed lol. *don't cut winners, V*
so i draw out some tea leaves green lines not as a prediction but as a thesis for what i think could be a path given liquidity constraints and how rate cuts won't immediately help this.
the memes are bearish divergence all over. correlation 1. these things v likely to trigger leverage liquidations all over on the way down. i think funds might be (and should be) willing to short these too which could amplify the tape.
this all just feels like we're in a seasonal wtf is going on.
hard to own anything, even btc unhedged.
20% ytd and always above 0% still feels "good" but has been too much lift and the juice for the squeeze is like hitting a hawt gurl pilates after hour passion project establishment in LA... $20 bucks for the instagram photo. too many ppl posting PnL gainz is exhausting and a sign.
all i'm saying is... make sure you know what you own. you are taking note of all the strangeness around. acknowledge liquidity conditions are not loose and rate cuts won't immediately help (rates are high! people are cooked! we need rates to BURN to really boost liquidity).
finally. remember - bankers like to pay themselves one more time into YE. don't become their exit liquidity here and also their source of assets toward the dippity do dah.
hand sitting feels smart.
V

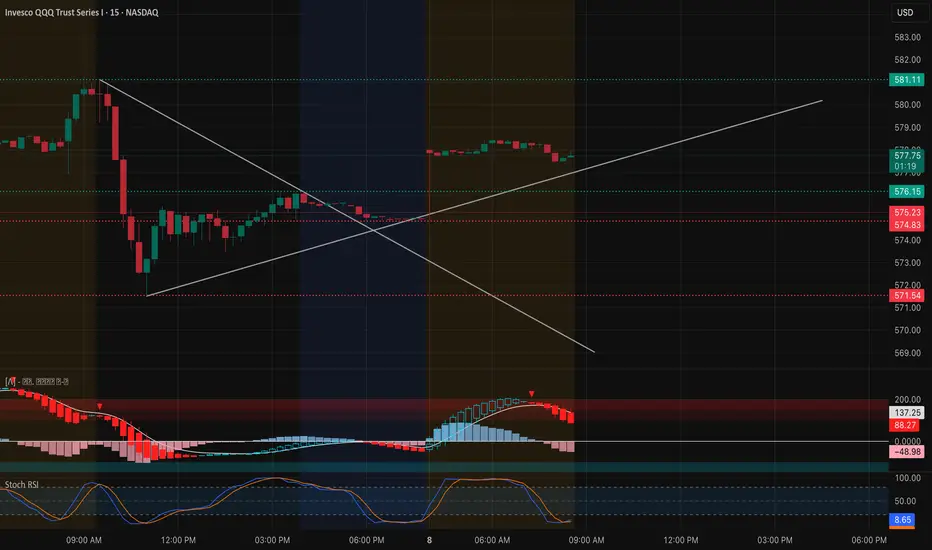
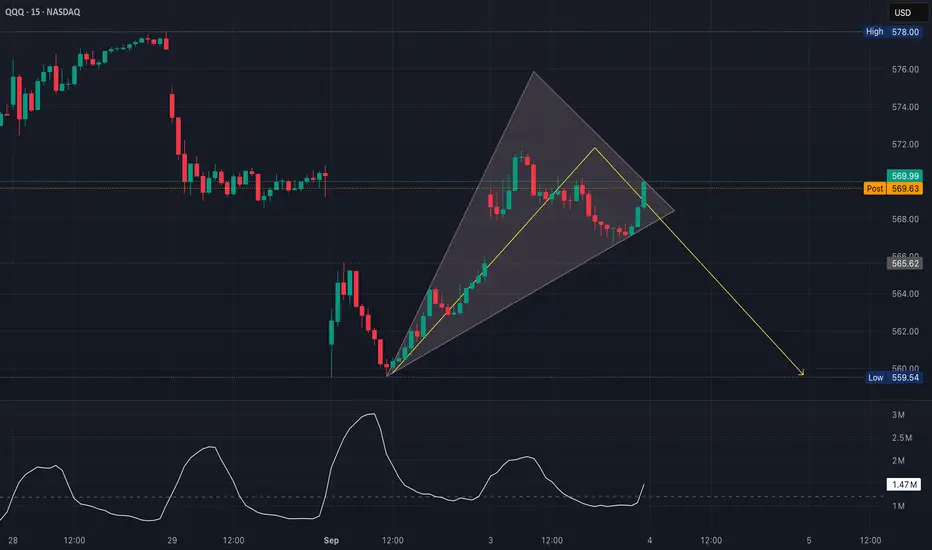
QQQ Potential Bearish ResolutionOn the larger timeframe, the overall structure is a bear flag off the bigger down-move, much better than the earlier wedge attempt
If QQQ were forming a wedge, price would be swinging wider with higher highs & lower lows, like a volatility burst after sideways action
This leans bearish (because of the descending highs & flat-ish support), but the final signal will be whichever side breaks with volume
The consolidation isn’t bullish (yet) because it’s drifting against the prior impulse down
It's a bull flag nested inside a bigger bear flag
It's a setup that needs confirmation, so bullish in theory, but the market still has to “vote” with price + volume
If you view the current consolidation as a bull flag, you’re keying off the last impulse up ($559-$572)
If you view it as a bear flag, you’re keying off the last dominant leg down ($583-$559)
That last green bar is encouraging for bulls, but overall the consolidation volume looks like it’s contracting (fits both a flag & a bear retrace)
The decisive clue will be whether volume expands on the breakout/breakdown
Puts
Watch for rejection at $571 with fading volume
Calls
Watch for strong volume push above $572, targeting ~$578
1. Volume
Buyers came in strong on the last green bar, but for a sustained push through $571, should see rising buy volume
2. Structure
If price fails at $571 & volume fades, it could roll over to test $565-$560
If buyers push cleanly above $572 with conviction, then the upper gap $574–$578 comes into play as the next target
If sellers defend $571 again, odds favor a breakdown toward $560
If volume surges & $571 breaks, bulls have a clean magnet up to $578–$582

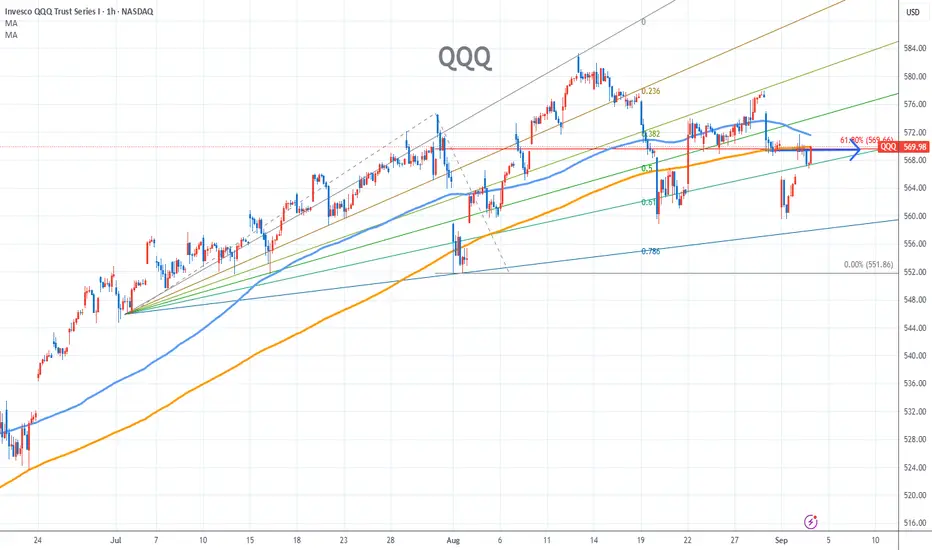
QQQ Stock Chart Fibonacci Analysis 090325Trading Idea
1) Find a FIBO slingshot
2) Check FIBO 61.80% level
3) Entry Point > 570/61.80%
Chart time frame:B
A) 15 min(1W-3M)
B) 1 hr(3M-6M)
C) 4 hr(6M-1year)
D) 1 day(1-3years)
Stock progress:B
A) Keep rising over 61.80% resistance
B) 61.80% resistance
C) 61.80% support
D) Hit the bottom
E) Hit the top
Stocks rise as they rise from support and fall from resistance. Our goal is to find a low support point and enter. It can be referred to as buying at the pullback point. The pullback point can be found with a Fibonacci extension of 61.80%. This is a step to find an entry-level position. 1) Find a triangle (Fibonacci Speed Fan Line) that connects the high (resistance) and low (support) points of the stock in progress, where it is continuously expressed as a Slingshot, 2) and create a Fibonacci extension level for the first rising wave from the start point of the slingshot pattern.
When the current price goes over the 61.80% level, that can be a good entry point, especially if the SMA 100 and 200 curves are gathered together at 61.80%, it is a very good entry point.
As a great help, TradingView provides these Fibonacci speed fan lines and extension levels with ease. So if you use the Fibonacci fan line, the extension level, and the SMA 100/200 curve well, you can find an entry point for the stock market. At least you have to enter at this low point to avoid trading failure, and if you are skilled at entering this low point, with the fibonacci6180 technique, your reading skill of to chart will be greatly improved.
If you want to do day trading, please set the time frame to 5 minutes or 15 minutes, and you will see many of the low points of rising stocks.
If you prefer long-term range trading, you can set the time frame to 1 hr or 1 day
QQQ Potential Bearish ResolutionThe white volume line has been fading during the climb inside the wedge
That’s typical of an exhaustion rally inside an ascending broadening wedge where price pushes higher on weaker participation
The last push up showed a small bounce in volume, but not a breakout-level surge
For a wedge, this usually suggests the rally is running out of gas rather than building strength
Broadening wedges often end with a volume pickup on the breakdown, not on the way up
If we see that white line spike while price loses the wedge bottom, that would be a strong bearish confirmation
Conversely, if volume expands while breaking above $573–$574, it would invalidate the bearish read & confirm strength instead
So, right now volume is consistent with a potential bearish resolution
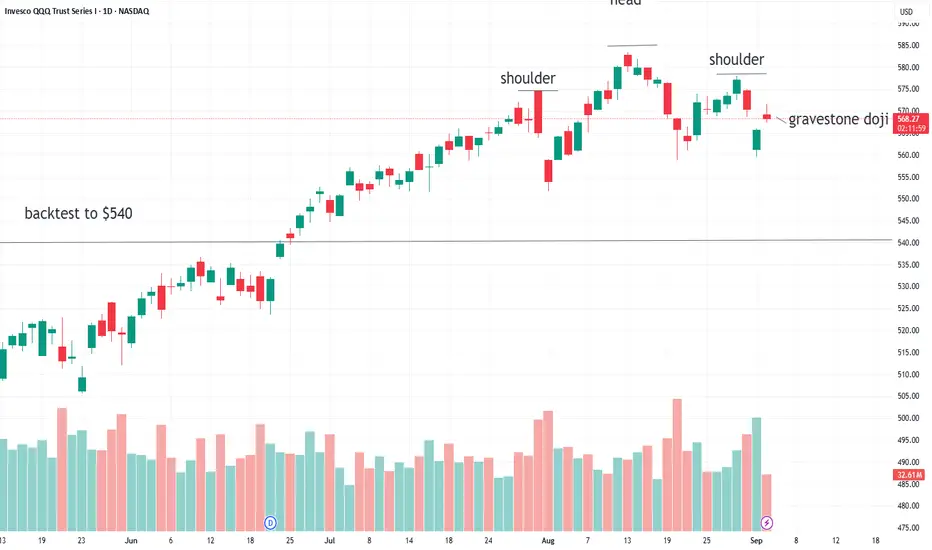
Head and shoulders pattern intact, rally failedGravestone doji formed by 1:30 PM EST, showing a failure of the ETF to rally. The short pattern is still in play.
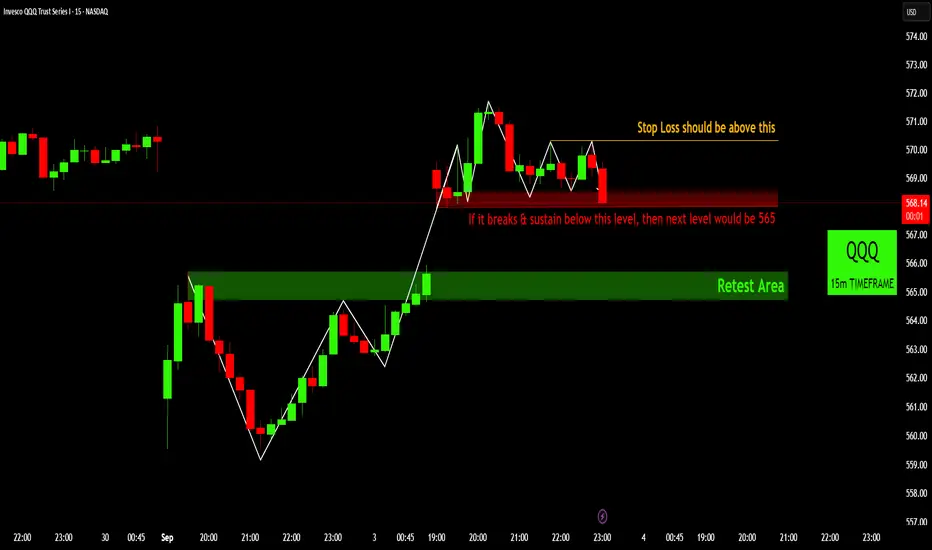
QQQ 15m: Critical Support - Breakdown Watch!QQQ 15m: Critical Support - Breakdown Watch!
The QQQ 15m chart shows price consolidating above a key support level. If it breaks and sustains below this level, a bearish move is likely. The next target in such a scenario would be the 565 retest area. For any bearish positioning, a stop loss should be placed above the recent swing high.
Disclaimer:
The information provided in this chart is for educational and informational purposes only and should not be considered as investment advice. Trading and investing involve substantial risk and are not suitable for every investor. You should carefully consider your financial situation and consult with a financial advisor before making any investment decisions. The creator of this chart does not guarantee any specific outcome or profit and is not responsible for any losses incurred as a result of using this information. Past performance is not indicative of future results. Use this information at your own risk. This chart has been created for my own improvement in Trading and Investment Analysis. Please do your own analysis before any investments.
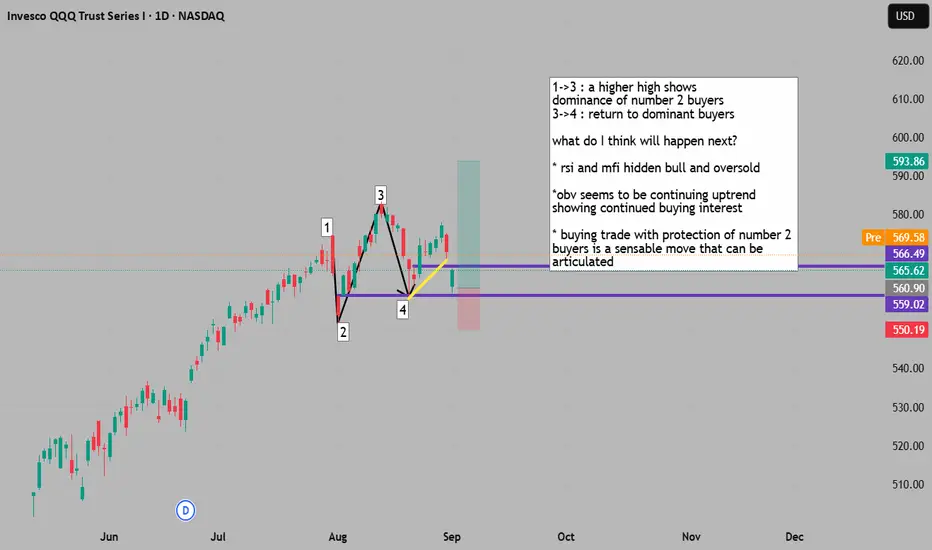
return to support provides uptrend continuation entry1->3 : a higher high shows
dominance of number 2 buyers
3->4 : return to dominant buyers
what do I think will happen next?
* rsi and mfi hidden bull and oversold
*obv seems to be continuing uptrend
showing continued buying interest
* buying trade with protection of number 2
buyers is a sensable move that can be
articulated
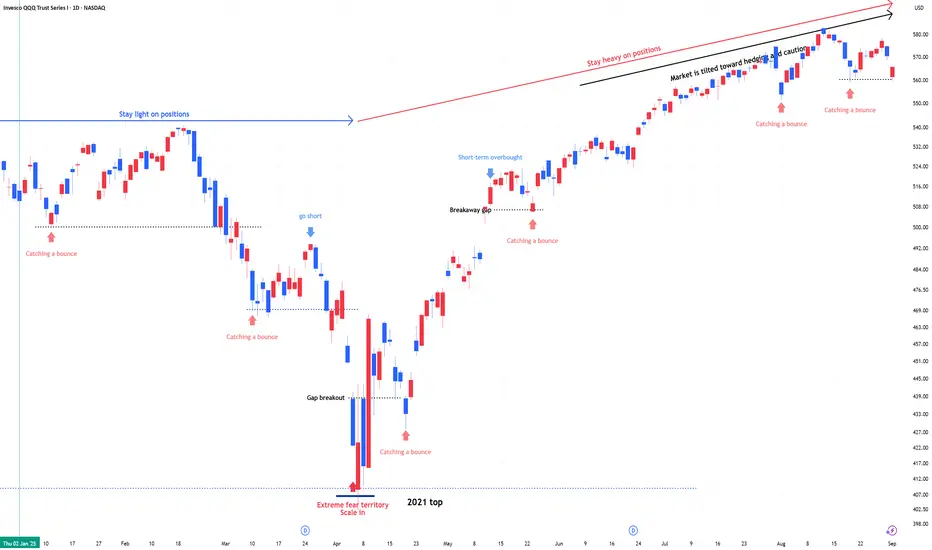
QQQ : Stay heavy on positionsQQQ : Stay heavy on positions (QLD, TQQQ)
In stay light on positions zones, I hold QQQ and reduce exposure.
In stay heavy on positions zones, I increase allocation using a mix of QLD and TQQQ.
** This analysis is based solely on the quantification of crowd psychology.
It does not incorporate price action, trading volume, or macroeconomic indicators.
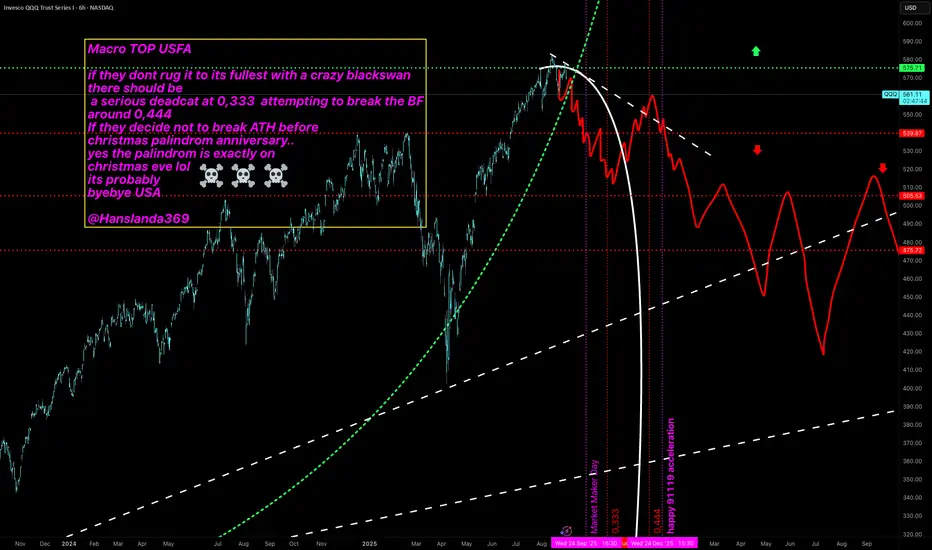
USFA lights out Macro TOP USFA
if they dont rug it to its fullest with a crazy blackswan
there should be
a serious deadcat at 0,333 attempting to break the BF
around 0,444
If they decide not to break ATH before
christmas palindrom anniversary..
yes the palindrom is exactly on
christmas eve lol
its probably
byebye USA
@Hanslanda369
$QQQ Trading Range for 9.2.25
Ok, so we are heading into tomorrow after the three day weekend a little bearish. Friday every candle printed red and the 35EMA is above us facing down so definitely look to that as resistance.
The 30min 200MA is also facing down and above that we have even more resistance.
I am not in a hurry to go long here until we print a green candle OR hit the bottom of the implied move at 565, which ever comes first