Tesla (TSLA) BUYTesla (TSLA) is best known for electric cars, but its future depends on AI. From self-driving vehicles to its Optimus humanoid robot, Tesla is an AI-first company disguised as an automaker.
TSLA trade ideas

$TSLA - Bullish Flag Setup $510A Bullish Flag is setting up nicely on TSLA. If price breaks out of the flag, a measured move equaling the pole length would put its price objective roughly between $500-510.

TSLA Sep 22 Game Plan – “Charging Toward 433 or Stalling at 425?1️⃣ Big Picture on the 1-Hour Chart
* Price action: TSLA finished around 425.60, riding a rising channel that’s been building since last week. Price tested the mid-channel line and is now sitting slightly above the lower trend support.
* Key levels:
* Resistance: 430–433.25 (recent top & call wall)
* Support: 416.8 → 412.5 (channel support & high-volume level)
* Indicators:
* MACD is flattening but still positive, suggesting momentum is cooling but not gone.
* Stoch RSI near mid-range (~62) leaves room for a push higher or a deeper dip if sellers show up.
The structure leans mildly bullish as long as price respects the lower trendline, but TSLA needs to clear 430+ with conviction for the next leg up.
2️⃣ GEX / Options Flow
* Big call concentration sits near 433–435, then again up at 450 and 465.
* Strong put support shows around 402–400, with a key HVL near 412.5 that often acts like a magnet if selling accelerates.
* Options positioning shows about 83% calls vs puts, with an IVR of 20.3—liquidity is good and premiums are moderate.
This options picture supports the idea that market makers could keep TSLA boxed between 420 and 433 early in the week. A decisive break over 433 could invite a gamma-driven squeeze toward 440–450.
3️⃣ Trading Thoughts & Suggestions
* Scalp / day trade: A clean break above 430–433 with volume can target 440 quickly. Keep a tight stop under 426.
* Support bounce: If the open dips toward 416–412.5 and holds, look for a bounce back to 425+.
* Fade setup: A hard rejection at 433 with heavy sell volume opens room back toward 416 → 412.5.
4️⃣ Bottom Line
TSLA is coiling inside a rising channel. Bulls want a decisive move over 433 to unlock higher levels, while bears need a break below 416 to gain control. The first hour Monday should set the tone for direction.
Disclaimer: This is just market opinion for educational discussion. It’s not financial advice. Always manage your own risk before trading.

TESLA - Robotaxi will drive the price above 1000This is not a short-term trade as you know from me on FX, Crypto and Indices. This is buy and hold investment. I got already good bag of share and Im still adding without trying to time if perfectly, but now I think its time to buy bigger positions.
Tesla is my 3rd biggest position after the Bitcoin and Strategy (MicroStrategy). Many people see it only as an EV cars company, but it's not all what they do, just read bellow to see why I see a huge potential in this company.
📍Why Tesla is Considered a Top Investment
Tesla stands out as a leading player in the EV market, with a strong brand and a history of delivering innovative products. In 2024, it produced about 459,000 vehicles and delivered over 495,000 in the fourth quarter alone, showcasing its ability to meet growing demand Tesla Fourth Quarter 2024 Production, Deliveries & Deployments.
💾Financially, Tesla reported $97,690 million in total revenue for 2024, with the automotive segment contributing $87,604 million and energy solutions adding $10,086 million Tesla, Inc. Annual Report on Form 10-K for 2024. This diversification into energy, alongside investments in autonomous driving, positions Tesla for long-term growth, making it attractive for investors seeking exposure to future trends in sustainability and technology.
📍What Tesla Does Beyond EV Cars
Beyond EVs, Tesla is deeply involved in energy solutions:
📍Solar Products: Offers solar panels and solar roofs for clean energy generation.
📍Energy Storage: Provides Powerwall for homes and Megapack for large-scale projects, helping stabilize grids and manage energy costs.
📍Charging Infrastructure: Operates a network of Supercharger stations, increasingly open to other EVs.
Services: Includes vehicle maintenance through service centers and body shops.
📍Robotaxi: Plans to launch a fully autonomous ride-hailing service in June 2025 in Austin, Texas, potentially opening new revenue streams Tesla's robotaxis by June? Musk turns to Texas for hands-off regulation.
📍Tesla Optimus: Developing a general-purpose robotic humanoid for tasks like household chores or industrial work, which could lead to new markets.
This expansion into energy and services, along with unexpected ventures like Robotaxi and Tesla Optimus, enhances Tesla's role in the transition to sustainable energy and technology, offering benefits like grid stability and potential robotics applications.
The growth in the energy segment, with a 67% increase from 2023 to 2024, highlights Tesla's expanding role in sustainability, potentially attracting investors focused on long-term trends. Additionally, Tesla's commitment to innovation, particularly in autonomous driving technology, is noteworthy. The company is developing features like Full Self-Driving (FSD), which could open new revenue streams, such as robotaxi services, enhancing its investment appeal.
🤔I think Optimus and Robotaxi will exceed rapidly exceed their EV cars revenue. Elon musk is predicing over 1000% growth in 5 years. Which would be way above $2900 without stocks splits.
I m a bit conservative and I think we can go somewhere between 3 - 4 standard deviations.
Wishing you continued success on your trading journey. May this educational post inspire you to become an even better trader!
“Adapt what is useful, reject what is useless, and add what is specifically your own.”
Perfectly nailed bottom around 200 and our positions are now 50% in profit good luck
David Perk ⚔

Tesla on Track – Golden Zone Respect Leading to $867 TargetAs we discussed in the earlier setup, Tesla retraced beautifully into the golden zone (62–79% retracement area) after sweeping sell-side liquidity. This zone aligned with a higher-timeframe order block, providing strong confluence for a bullish reaction.
The price has since respected that golden zone, confirming buyers stepped in aggressively and validating the bullish bias. From here, the market structure points toward continuation to the upside, with immediate targets at prior buy-side liquidity pools, eventually extending toward the $867 region, a level that aligns with the 100% Fibonacci projection and liquidity resting above previous highs.
This setup illustrates a textbook ICT/SMC play:
Liquidity Sweep ✅
Golden Zone Respect ✅
Strong Bullish Reaction ✅
Clear Buy-side Targets Ahead ✅
If momentum holds, Tesla remains positioned for a multi-month expansion leg toward the $867 target zone.
⚠️ DYOR: Not financial advice. Always confirm setups with your own framework and risk management.

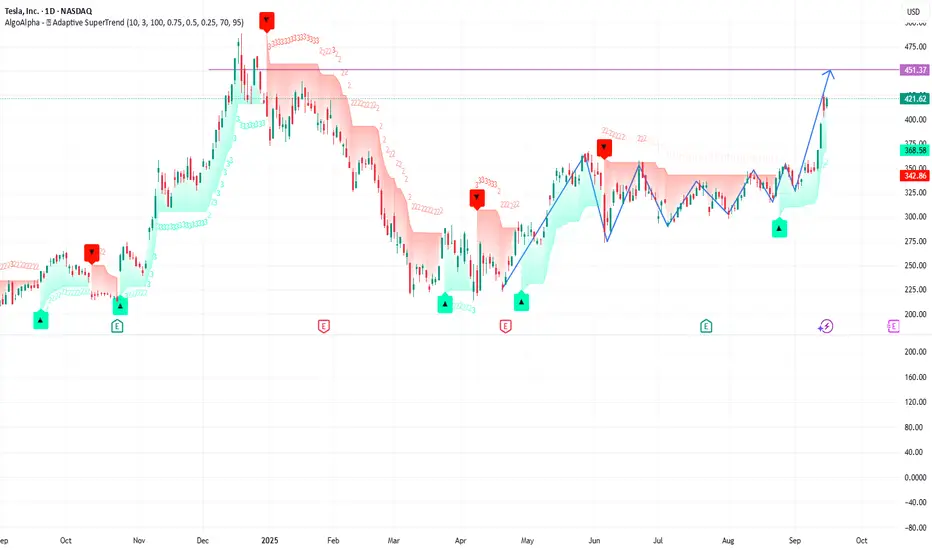
$TSLA: Let The Rally Speak For Itself - 9/16/2025Based on the analysis, it’s confirmed that NASDAQ:TSLA has initiated a new rally following the completion of a lengthy and complex corrective structure at $288.
The stock bounced twice off the 50-week moving average, signaling strong support as the correction neared its end.
Due to the depth and complexity of the structure, Wave 3 is expected to unfold with high momentum, potentially delivering an explosive rally. Key upside targets are displayed in the chart — we’ll be watching closely to see how price reacts at those levels.
📚 Note: The internal structure and labeling were intentionally left visible in the chart for educational purposes. This is especially useful for traders interested in Modern Trading Algorithms and their structural variations.
Happy Trading, and let the rally speak for itself. 🚀

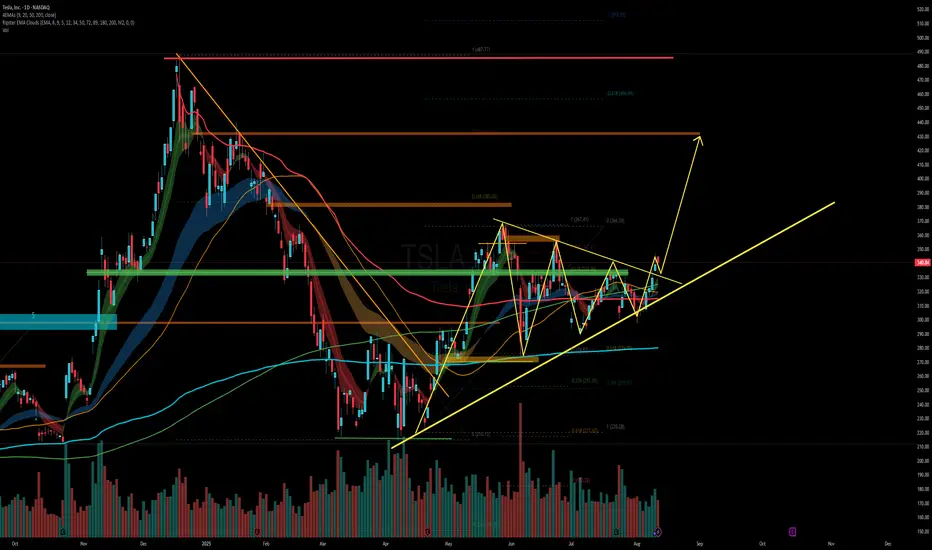
Tesla - Technicals are pretty clear!🚨Tesla ( NASDAQ:TSLA ) respects the triangle:
🔎Analysis summary:
Ever since Tesla was listed on the Nasdaq, we saw perfect cycles playing out. Since 2021, Tesla has once again been consolidating within a bullish triangle pattern. Therefore with the recent bullish break and retest, it becomes more and more likely that Tesla will break out soon.
📝Levels to watch:
$400, $250
SwingTraderPhil
SwingTrading.Simplified. | Investing.Simplified. | #LONGTERMVISION

#TSLA Analysis, Elon breaks the Key level ^.^^Elon pours Big Money $$$ into TSLA stock recently causing Rally!
Price has gone up significantly, I don't think it will drop below $400 any time soon.
Strong Greenbar breaks out from the wedge with large volume increases.
Short sellers are getting squeeze out.
More investors are coming to catch smokey train.
Price Target next $480.
Come and join the Rally.
TSLA breaking out a rangeI think TSLA is moving up
The 1D timeframe show us how it was on a range and a few days ago started to go up
Next lvl should be 450, but also can go to 480
What do you think?
Bullish or bearish?
Do you see the bull flag?
Also the size and shape of candles remember me to a bullish movement.
When you see candlesticks all the day, everyday, you can see a pattern!
Lol
Every counter has a sweet spot. Every counter has a sweet spot. The only question: are you trading it at the right time?
Most traders obsess over what to trade, but few stop to ask when to trade it.
Timing is the difference between a setup that compounds consistently… and one that bleeds capital.
That’s exactly why I built thenexxtradealpha — Adaptive Opening Framework.
It’s designed to identify the optimal timeframe for any counter, so you’re not second-guessing whether you should be looking at the 5-minute, 15-minute, or daily chart.
The framework adapts to the counter itself — helping you trade in alignment with its natural rhythm, not against it.
Because once you know the right time, you stop forcing trades…
And start trading with precision.
TSLA Volatility Contraction Pattern (VCP) LONG When TSLA breaks above 350 and closes, the price will launch to $390 very quickly.
A VCP is a technical pattern, showing lessening declines in a range bound formation. A bull flag showing higher-lows is the best, as seen with TSLA.
Volatility is going to breakout sharply to the upside. If you TSLA above 350 just buy and hold, you’re too late trying to get a better deal.
🚀🚀🚀🌖
TSLA - is it the time for Fireworks ?TSLA - huge base, many breakout failures due to news.
Let's see if this time it sustains this bullish move.
I am bullish on TSLAI have not changed my buy bias for this baby.
II will continue adding TSLA to my portfolio with $360 and $400 as my medium-term take profits.
Share your thought.
If you found this helpful, like, follow and share

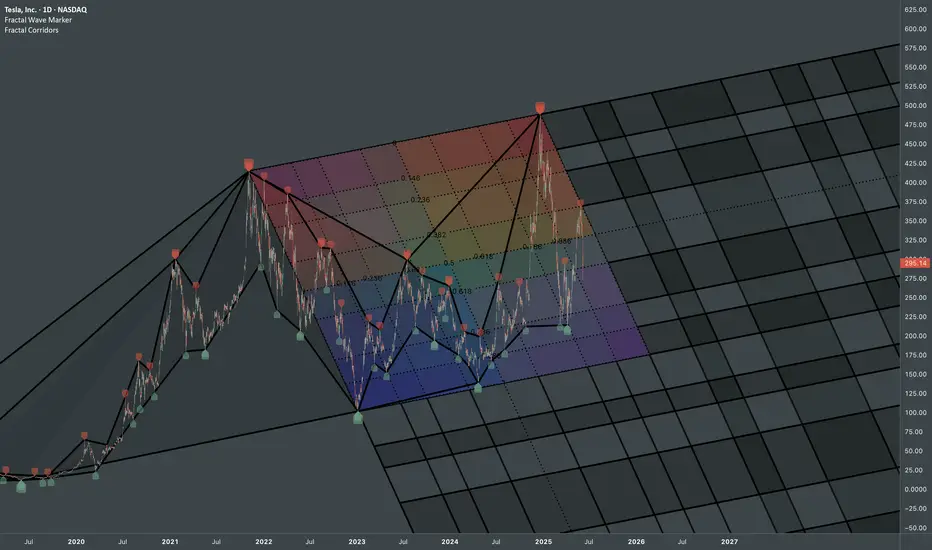
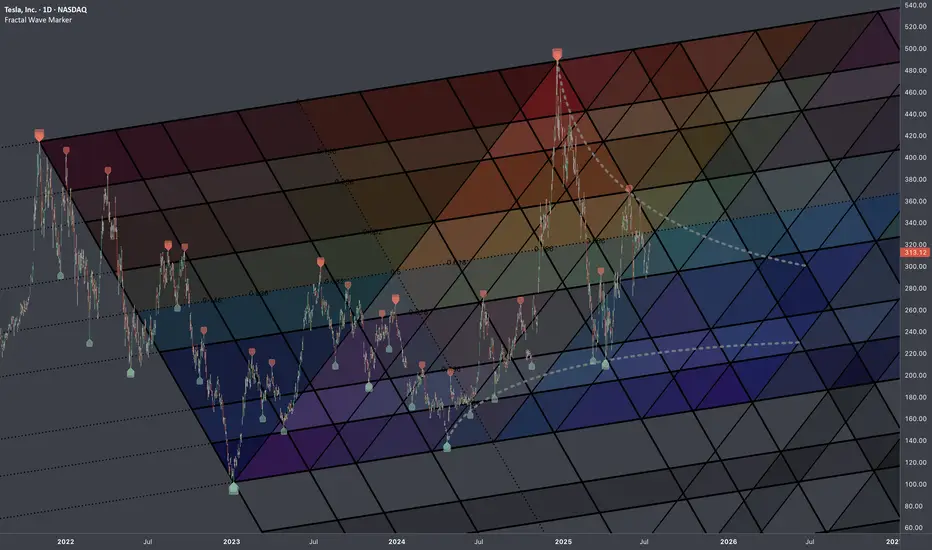
Tesla: Interconnected ATHsStructural update to:
Chronologically connecting pivots via fib channels creates a probabilistic map that captures the rhythm and scale relationships inherent in systematic price movements.
Fractal Wave Marker & Fractal Corridors were used to transform raw price data into a coherent, multiscale structure. Combo of those indicators makes you actually pay attention to ongoing patterns and get an idea how formations on smaller scale can be part of a bigger structural narrative.
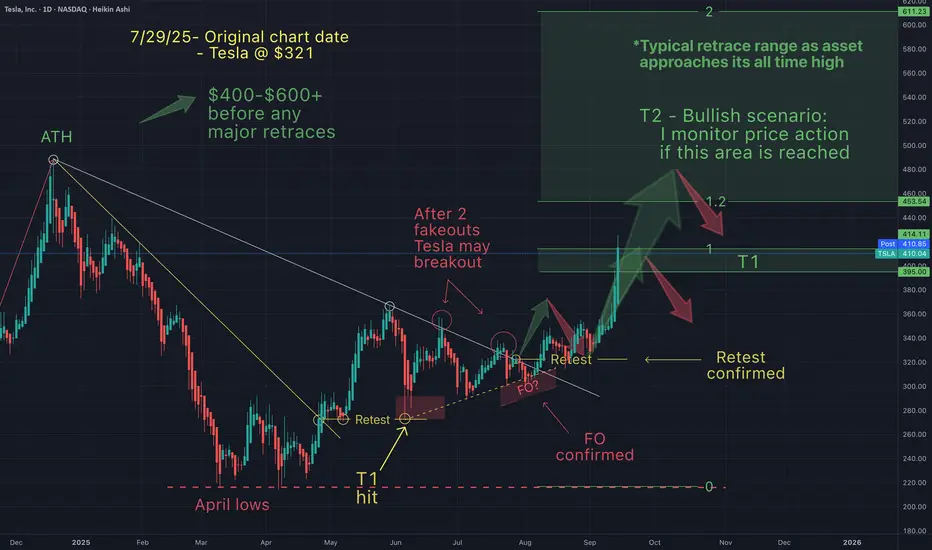
You will ask yourself, "how did he know Tesla would do that"?On July 29th, I posted this chart suggesting that I anticipated a typical pattern to emerge. Things are going according to what I was expecting.
Congratulations to everyone who has been making some gains here based on everthing that was discussed in the charts.
The most important thing in my opinion is a trading strategy...and these strategies have made us incredible gains across the board.
Only question remains, will Tesla hit my T2. What do you think?
May the trends be with you.
Tesla breakout set up 2 potential moves for Tesla on 15 min chart should happen around the retail data release in the US.
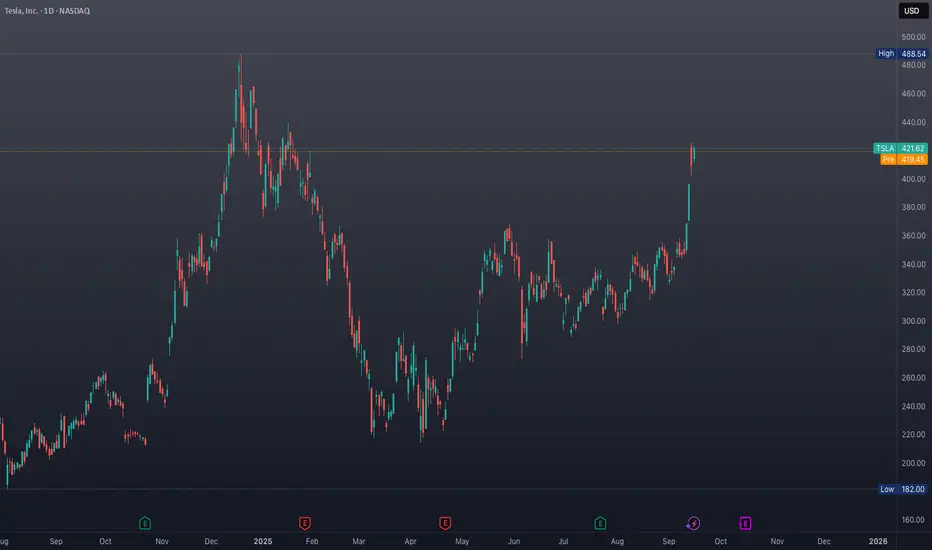
Tesla (TSLA) Stock Price Rises Above $400Tesla (TSLA) Stock Price Rises Above $400
As the chart shows, Tesla (TSLA) stocks are displaying strong market momentum. In particular, the price:
→ is above the psychological level of $400;
→ has reached its highest levels since late January;
→ has gained around 25% since the beginning of September.
Why Is TSLA Rising?
The main news driving the price surge was a media report that Elon Musk had purchased $1 billion worth of Tesla stock. The market interpreted this as commitment and confidence in the company’s future from its founder, which sharply increased demand for the shares.
Other factors contributing to TSLA’s rise include:
→ Expectations of a Federal Reserve interest rate cut to stimulate the economy. This makes growth stocks such as Tesla more attractive to investors.
→ Reduced tensions between Elon Musk and President Trump’s administration. This removes some of the political risks that had weighed on the stock.
Technical Analysis of TSLA Stock
In our August analysis of the TSLA chart, we:
→ noted that the price had broken through the upper boundary of a broad contracting triangle with its axis around $317;
→ suggested that a correction might follow after the rally in early August.
Since then:
→ the price made a minor pullback before reversing upwards (as shown by the arrow);
→ the bullish trend resumed, providing anchor points to construct a rising (blue) channel.
Thus, the chart confirms:
→ a shift in sentiment in favour of buyers;
→ an improving fundamental backdrop (as highlighted in the news) and growth prospects linked to robotaxis and other innovations.
From a bullish perspective, the breakout of $355 followed by accelerated growth points to strong demand.
From a bearish perspective:
→ the RSI indicator has spiked into overbought territory;
→ the price is near the upper boundary of the rising channel;
→ the seven-month high could prompt profit-taking by investors – already reflected in yesterday’s pullback.
Taking this into account, we could assume that while the long-term outlook remains optimistic, a correction is possible, for example:
→ towards the 50% retracement level of the A→B impulse;
→ into the price expansion zone (a bullish imbalance signal, as described by the Fair Value Gap pattern in the Smart Money Concept methodology).
This article represents the opinion of the Companies operating under the FXOpen brand only. It is not to be construed as an offer, solicitation, or recommendation with respect to products and services provided by the Companies operating under the FXOpen brand, nor is it to be considered financial advice.

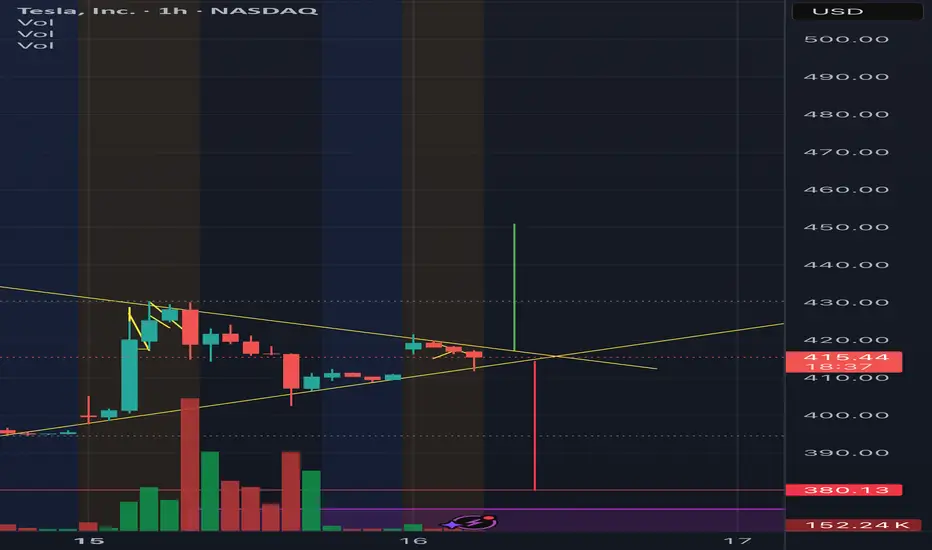
TSLA 1H + GEX Game Plan for Tue, Sep 16TSLA Cooling After a Monster Run — Will 410 Hold or Is 430 Next? ⚡️
Market Structure (1-Hour View)
* Sharp run-up: TSLA ripped from mid-300s to a peak around 430 and is now consolidating in a broad rising channel.
* Trend support: Current pullback is testing a rising channel floor near 405–410.
* Momentum: MACD still in a bearish cross with fading histogram; Stoch RSI is climbing out of oversold — early sign of a potential rebound.
Key Levels to Watch
* Resistance: 410.8 (current pivot), 420.0–422.0, and 430.4 (recent high / gamma wall).
* Support: 402.2, 395.9, then deeper supports near 346.1 and 340.0 if momentum collapses.
GEX Read (Sep 16)
* Highest positive NETGEX / Call resistance: 430.4
* 2nd Call Wall: ~420–422 area.
* HVL / gamma pivot: 356–357.
* Put walls: 320 and 305.
* Options sentiment: Calls >100% (very call-heavy), IVR ~20, IVx ~65.9 — big bullish skew but with elevated implied volatility.
Implication:
* Dealers may keep TSLA pinned around 400–420 for balance.
* A strong reclaim of >420 with volume invites a retest of 430.4 and possibly higher.
* Lose 402 and a slide to 395–390 is possible.
Trade Scenarios
1) Bullish Continuation
* Trigger: 1H close >412–415 with uptick in volume.
* Entry: 414–415 on retest.
* Targets: 420 → 430.4.
* Stop: Below 408.
* Options: 420/430 call debit spread expiring this week.
2) Range Fade
* Trigger: Failure to clear 415 with repeated rejection wicks.
* Entry: 413–414 short.
* Targets: 402 → 395.9.
* Stop: Above 417.
* Options: 410P or 415/402 put spread for quick fade.
3) Deeper Pullback
* Trigger: Clear 1H break <402 with retest fail.
* Entry: 401–402 short.
* Targets: 395 → 390, with a stretch toward 356–357 (HVL) if heavy selling accelerates.
* Stop: Back above 406.
Options: 400/390 put spread for a measured pullback.
Scalping & Swing Notes
* First test of 410–412 will set the early tone; quick rejections there can produce a 5–10 point scalp.
* If we gap near 400, watch for a sweep into 395 then bounce back toward 410.
Risk & Management
* Keep sizing conservative: TSLA’s elevated IV means sharp intraday swings.
* Scale out partials at first target and tighten stops if momentum accelerates in your favor.
This analysis is for educational purposes only and does not constitute financial advice. Always trade with a plan and manage risk carefully.

$TSLA: Fib InterconnectionsResearch Notes
Examining interconnection type with regressive angle:
Critical points:
Mapping with 3 fibonacci channels:
TSLA eyes on $409.56: Golden Genesis fib to hold "High Ground"TSLA has been surging based on various news.
Now retracing towards a Genesis fib at $409.56
Clean bounce would indicate very strong trend.
Golden Genesis fibs are important milestones.
High gravity fibs can capture price into orbit.
Expect consolidation around it then sling shot.
.
Previous analysis that caught a PERFECT BOTTOM:
Hit BOOST and FOLLOW for more such PRECISE and TIMELY charts.
========================================================
.

My levels to chase $TSLA bull momentumInvestors are optimistic about potential Fed rate cuts and Tesla’s push into robotics and autonomous driving.
Tesla received a permit to begin testing autonomous vehicles on public roads in Nevada. This follows its limited robotaxi rollout in Austin and signals broader ambitions for nationwide autonomous ride-hailing services.
Elon Musk claims that “80% of Tesla’s value will be Optimus,” referring to its humanoid robot initiative. With EV growth slowing, Musk is pivoting Tesla’s narrative toward AI and robotics.
There are equal numbers of Tesla haters and lovers!

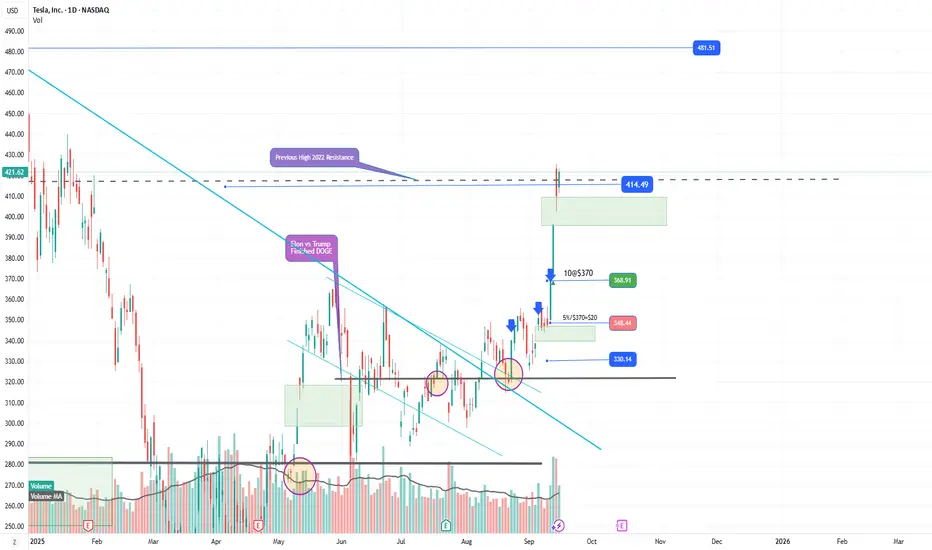
TSLA Breakout Above $360 Opens Swing Trade SetupTesla broke the $360 resistance four days ago, a level that had been holding price down for the last 120 days. Once broken, price surged quickly toward the $420 zone.
In my view, if we get a chance to buy again near the 370 green support zone, it would be a great swing trade opportunity — especially with the rising trendline still intact.
🔍 Technical Analysis
Current Price: 420.95
360 acted as resistance for months, now flipped to strong support.
Green zone (360–375) aligns with the uptrend, key area to watch for re-entry.
🛡️ Support & SL
🟢 370 zone | SL: 345
🧭 Outlook
Bullish Case: Hold above 370 → continuation toward 450–475.
Bearish Case: Break below 345 → deeper correction.
Bias: Bullish while above 370.
🌍 Fundamental Insight
Valuation: Tesla trades at a relatively high P/E ratio (60–70 range) compared to traditional automakers, reflecting growth expectations rather than current earnings.
Revenue Growth: While margins have compressed due to price cuts, top-line growth remains supported by strong EV demand and expansion in new markets.
Innovation & AI: Tesla’s positioning in AI, autonomous driving, and energy storage continues to attract investor optimism beyond just vehicle sales.
Risks: Competition from other EV makers and margin pressure are key risks investors are watching.
✅ Conclusion
Tesla’s breakout above 360 ended months of pressure. A pullback into the green support zone would be a strong swing entry with trendline confluence. While valuation is stretched versus peers, bullish momentum and growth expectations continue to support the stock.
⚠️ Disclaimer
This analysis is for educational purposes only and does not constitute financial, investment, or trading advice.

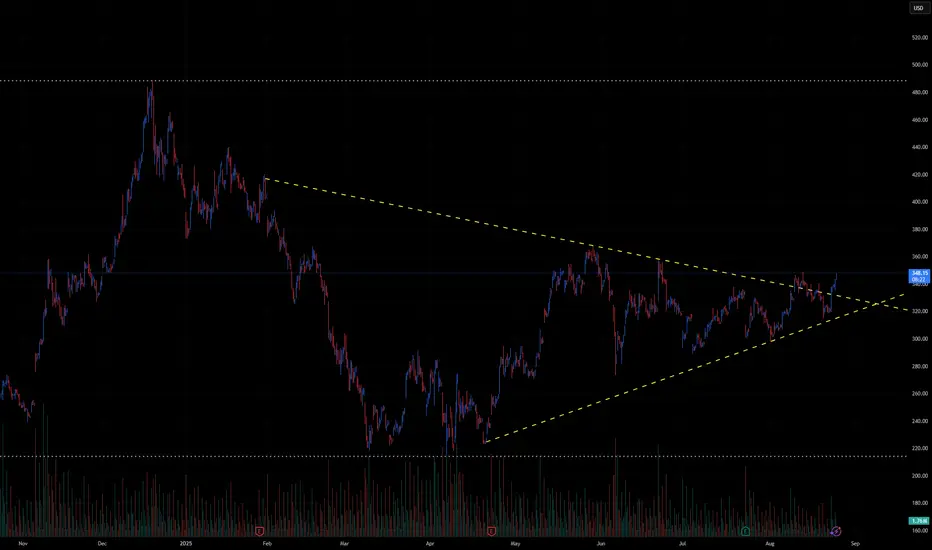
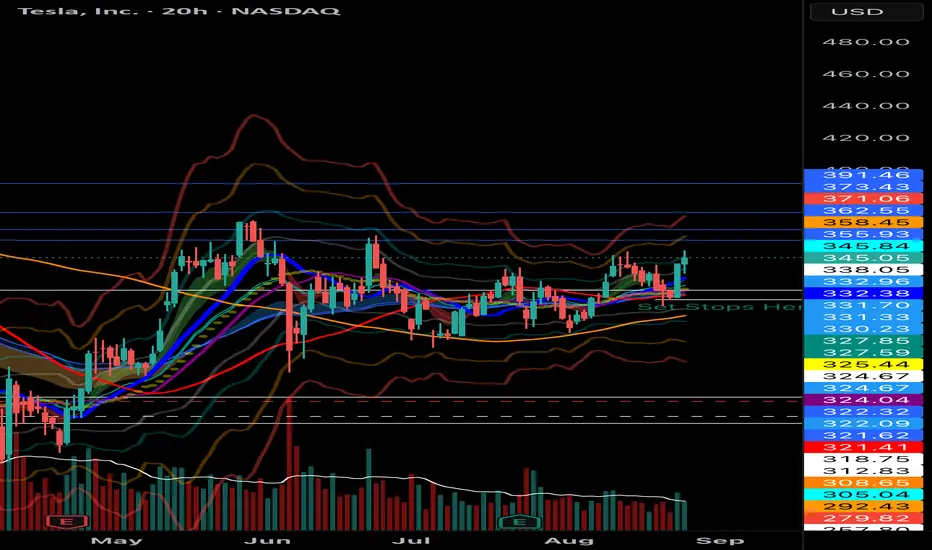
TSLA Technical Outlook – Symmetrical Triangle Breakout Watch🚗 TSLA Technical Outlook – Symmetrical Triangle Breakout Watch
Ticker: TSLA (Tesla, Inc.)
Timeframe: 30-minute candles
🔍 Current Setup
TSLA has been consolidating for months inside a large symmetrical triangle, marked by:
Descending resistance: from ~380 down to ~347.
Ascending support: from April lows near ~240, now rising toward ~320.
Current price: ~348, testing the upper boundary of the triangle.
This structure signals compression after a major downtrend, and the breakout direction will likely define TSLA’s next big move.
📊 Breakout Levels
🚀 Upside (Bullish Scenario)
Trigger: Break and close above 350–355.
Intermediate Targets:
370–380 → First resistance zone.
400–420 → Extension levels.
Measured Move Target: ~450+ (based on the triangle height projection).
🔻 Downside (Bearish Scenario)
Trigger: Failure at resistance and break below 320, confirmation under 310.
Intermediate Supports:
300 → Psychological level.
280–260 → Stronger support zone.
Measured Move Target: ~250 (triangle projection downward).
📈 Volume Analysis
Volume has been contracting steadily during the triangle’s formation.
A major volume spike will be key to confirming whichever direction TSLA chooses.
⚖️ Probability Bias
TSLA is at the make-or-break resistance zone (~350).
A breakout above 355 would strongly favor bulls, targeting 380 → 400+.
But a rejection here and break below 320 would shift momentum bearish, sending TSLA back toward 280–260.
✅ Takeaway
TSLA is at a critical inflection point inside a long-term triangle:
Bullish Break > 355: Targets 370 → 400 → 450+
Bearish Break < 320: Targets 300 → 280 → 250
Watch for volume-backed confirmation, as this move could define Tesla’s next multi-week trend.