Move toward 100The Dollar Index has finally signaled a move toward the 100 zone, and we expect it to reach this important level in the next few days.
Trade ideas

This is a quick follow up from early this morningI was freaking out over the pattern and the dxy and then it occurred to me that every time I do a trade and I want to get out of it... I basically get back into the dollar by default.... And that may be the reason the dollar is doing so badly is that there are a group of sharp traders exiting the gold and silver because they may understand that there is a reversal pattern and that they should liquidate their position in the gold and silver contracts...... This is clearly hypothetical in any case... I think there is value to the video that I did this morning and I hope that you take a look at it.

DXY: Will Go Down! Short!
My dear friends,
Today we will analyse DXY together☺️
The recent price action suggests a shift in mid-term momentum. A break below the current local range around 98.437 will confirm the new direction downwards with the target being the next key level of 98.260 and a reconvened placement of a stop-loss beyond the range.
❤️Sending you lots of Love and Hugs❤️

DXY ready to continue lower, buy EURUSD and coDxy has taken liquidity Buyside liquidity and it is now ready to continue lower. I was bullish till this point, I've now turned bearish.
There are many reason for this analysis, 3 drive pattern, buyside liquidity purge, 4hrs BOS with displacement
TP 1 @ 98.1
TP 2 @ 97.45
TP 3 @ 96.2
Trade accordingly
Dxy will still turn bullish, I will update you then... Enjoy

US Dollar: Wait For The +BOS, Then Buy It!Welcome back to the Weekly Forex Forecast for the week of Oct 6 - 10th.
In this video, we will analyze the following FX market: USD Dollar
The USD is technically still bearish, trying to find support for higher prices. A US government shutdown is not helping that case! However, personally, I am still looking toward the upside.
Price is still holding at a bullish discount array, an +OB. As long as the +OB is respected, I am looking for higher prices.
A bearish BOS will make looking for higher prices invalid.
So, let the market show its bias before entering a trade. Look for the confirmations to its direction.
Don't take trades inside the middle of consolidations!
Wait and react. Do not predict.
Enjoy!
May profits be upon you.
Leave any questions or comments in the comment section.
I appreciate any feedback from my viewers!
Disclaimer:
I do not provide personal investment advice and I am not a qualified licensed investment advisor.
All information found here, including any ideas, opinions, views, predictions, forecasts, commentaries, suggestions, expressed or implied herein, are for informational, entertainment or educational purposes only and should not be construed as personal investment advice. While the information provided is believed to be accurate, it may include errors or inaccuracies.
I will not and cannot be held liable for any actions you take as a result of anything you read here.
Conduct your own due diligence, or consult a licensed financial advisor or broker before making any and all investment decisions. Any investments, trades, speculations, or decisions made on the basis of any information found on this channel, expressed or implied herein, are committed at your own risk, financial or otherwise.

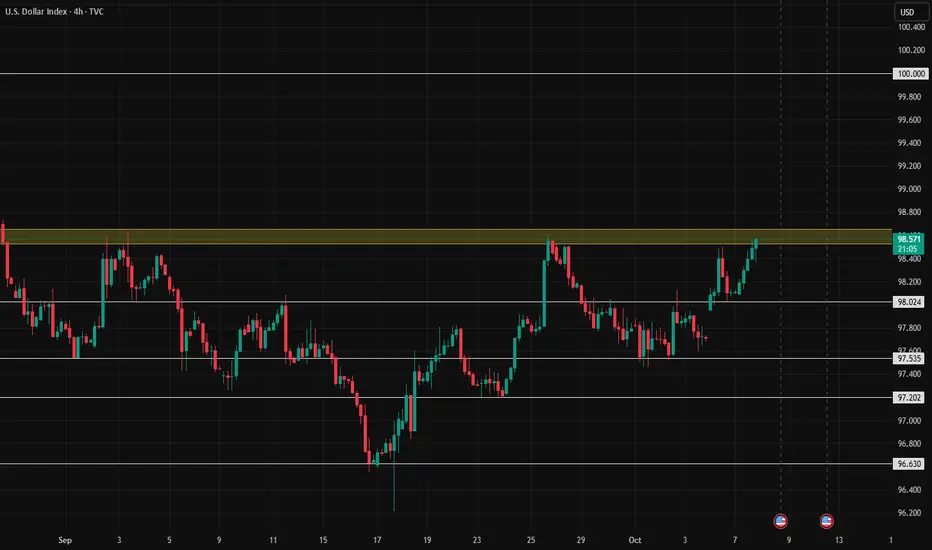
DXY – The Road to 100 Looks ClearIn my previous analysis on DXY, I mentioned that as long as the 97.60 zone holds, there are strong chances for an upside move and a possible test of the 100 level.
Indeed, the index reversed perfectly from that support area and has now broken above the interim resistance around 98.60, trading close to 99 at the time of writing.
Over the last three sessions, DXY has also completed an inverted Head & Shoulders pattern, with the neckline breakout confirming the bullish structure.
From here, the path toward the 100 zone appears clear and technically justified.
I maintain a bullish bias for the U.S. Dollar Index, which naturally implies a bearish outlook for EURUSD and GBPUSD in the short term.

DXY Target Achieved | Smart Money Model #1 Playing Out PerfectlyHello Billionaires!!
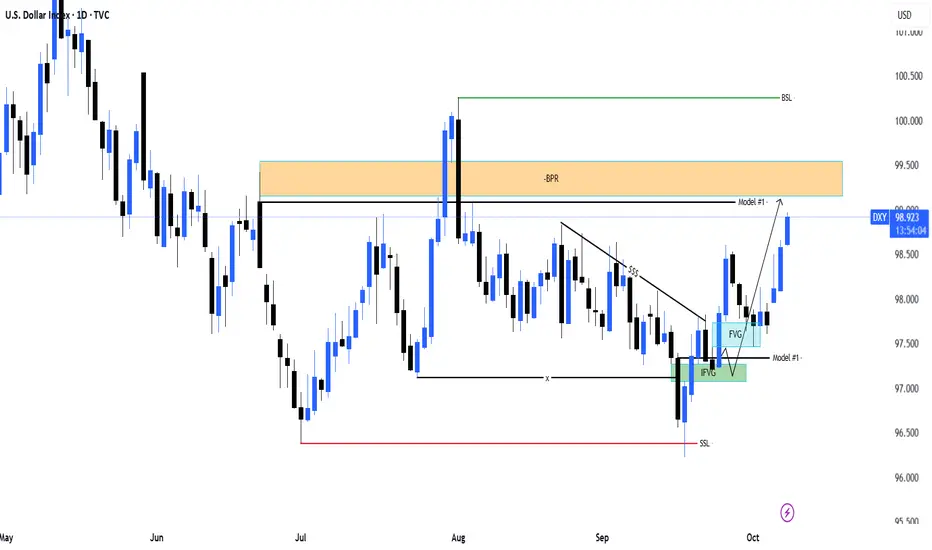
In DXY D1 Projection we know the bullish projection on DXY played out exactly as expected.
Price swept the short-term sell-side liquidity (SSL), filled the IFVG, and then launched upward through the FVG, completing the Model #1 structure.
Currently, price is trading inside the BPR (Balanced Price Range), showing that the target zone has been successfully reached.
🧠 Smart Money Logic:
SSL sweep → Market Structure Shift
IFVG + FVG = Strong Reaccumulation
Price delivered to BPR (Premium Zone)
Model #1 completion confirms bullish delivery
Now I’ll be watching for potential reaction or retracement from this premium zone before the next move develops.
#DXY #SmartMoneyConcepts #PriceAction #ICT #Forex #Liquidity #BPR #FVG #IFVG

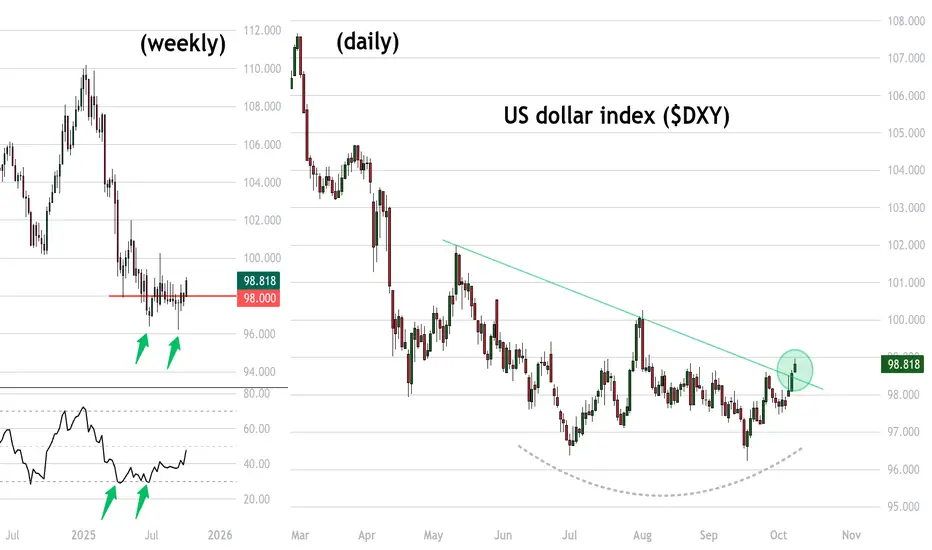
Yes Gold just broke $4K.. but check out the USD (bottom?)Gold is naturally getting all the attention after breaking over $4000 fir the first time
But meanwhile the US dollar looks like its bottoming out.
DXY - the dollar index - not had much interest in breaking below 98
Bullish DXYPotential Inverted Head and Shoulders display.
Am very Bullish on USD Index right now and Bearish on most xxx/USD pairs.

DXY H4 CHARTWe are looking price making a rally targeting the marked supply area of the LTF price structure. It is important to note the many retail traders are coming into the market at this current price area which is late according our strategy.
this rally in price will have a huge impact to the drop of the GOLD which is long over due. We will monitor the price action for better entry given price drops targeting our LTF DEMNAD AREAS.
08.10.25 Morning ForecastPairs on Watch -
FX:GBPUSD
FX:EURUSD
A short overview of the instruments I am looking at for today, multi-timeframe analysis down to what I will be looking at for an entry. Enjoy!

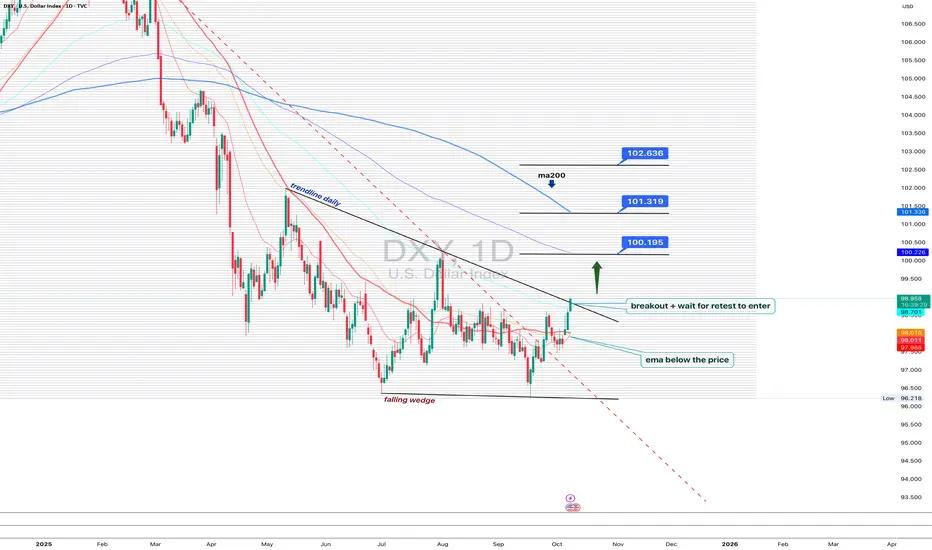
DXY 1D - dollar waking up, but patience is keyOn the daily chart, the US Dollar Index is showing the first signs of recovery: a falling wedge breakout and trendline breach hint that bulls are slowly reclaiming control. Price has moved above the EMA, a short-term bullish signal.
Still, MA200 remains above, reminding us that the broader trend is not yet flipped. The ideal play here - wait for a retest of the breakout trendline to confirm buyers’ strength before jumping in.
If price holds above 99.70, the next upside targets sit around 100.19, 101.31, and 102.63.
But keep in mind - DXY loves to test patience. False breakouts are its favorite sport.
Right now, the dollar looks ready to wake up, but maybe hit the snooze button one last time before the real move begins.
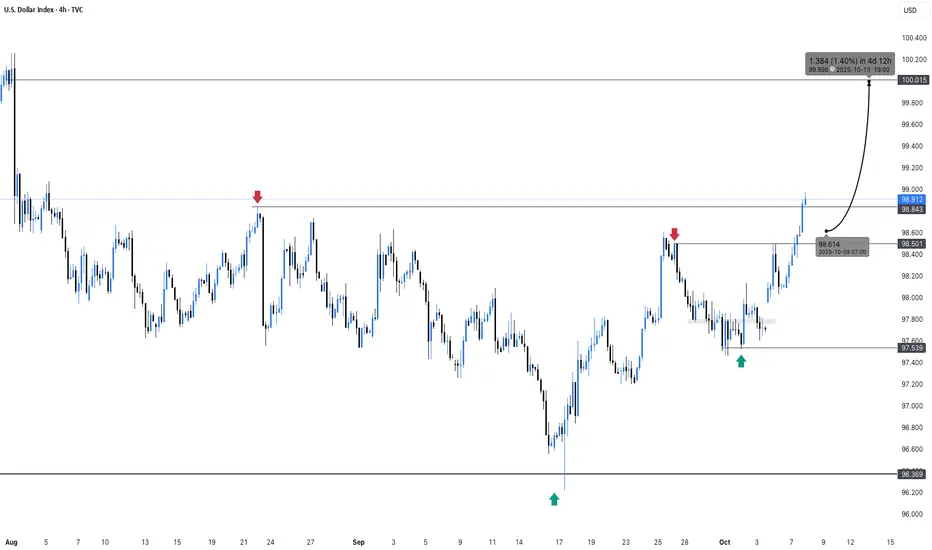
US DOLLAR TARGETS HITThe U.S. government is still shut down, so no fresh economic data is coming out. That means everyone’s trading half-blind right now—no jobs numbers, no inflation updates, just noise. But the chart still tells the truth. All the bullish dollar targets were hit exactly as planned, and now price is sitting right under that 99.8 key high. That’s the line that decides everything. If market makers push price higher than 99.8, the bullish phase stays alive a bit longer. If it fails there, we drop back into bearish discount territory, where value sits lower and sellers regain control.
Over the past four months, liquidity’s been building above those highs. Now we’re watching a classic stop run—price pushing up to take out weak hands before the real move begins. That’s why cross markets like stocks, gold, and crypto are slipping. The dollar’s acting as a safe spot while everything else bleeds. But the volume looks thin, which usually means manipulation, not genuine demand.
Without the usual USD data, it’s all a guessing game until the Fed minutes drop later today. For now, it’s simple: the 99.8 zone is the make-or-break level. Stay patient, read the structure, and let the chart talk. Price always moves to where orders are missing, and stops where they’re full. Follow that rule, and you’ll never feel lost in the noise.

DOLLARThe dxy rally into 99,187 will be watched for rejection, this price action could give USDJPY ,EURUSD ,GBPUSD,AUDUSD AND NZDUSD a good trade opportunity.

DXY 30 SEPTEMBER 2025 BEFOREAnticipating the potential for Bullish DXY :
1. Looking for support to form around the key levels within a key trading session , should support fail to form at the key levels price could drop below 91.199
2. Should we get rapid and aggressive movement away from the key level i will target the recent Swing high at 98.605 for profit taking

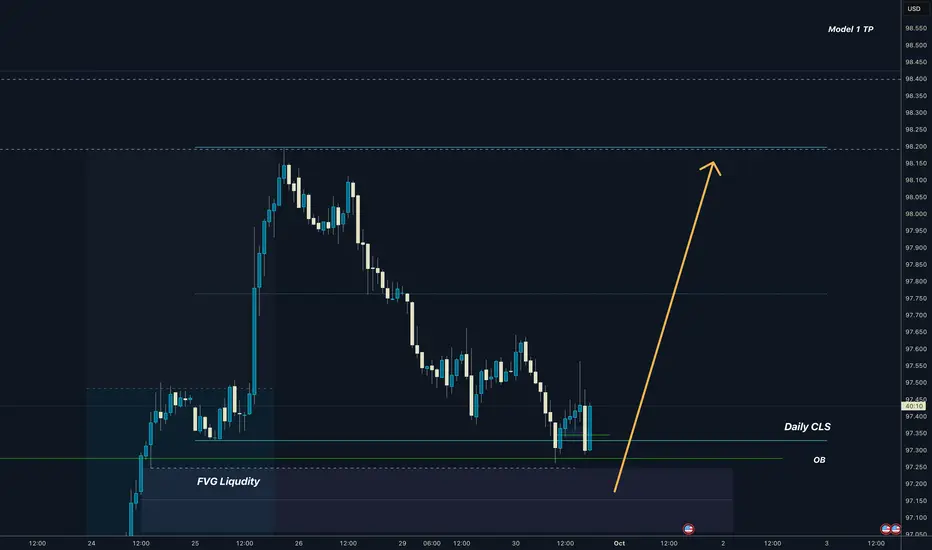
Dollar I Daily CLS I Manipulation I Bullish HTFDollar just manipulated Daily CLS range while HTF bias is nicely bullish
Im still open to the dip to FVG before it goes higher
Big picture view
Adapt useful , Reject useless add what is specifically your own.
Trade safely
Dave
Dollar Index analysisThe Dollar Index has quite an interesting chart — on the higher cycle, it’s clearly bearish, while on the lower cycles, it’s showing bullish movement. This situation can significantly increase trading risk, making stop-outs more likely, especially on the Dollar Index itself and even more so on EUR/USD.
Right now, we need to see whether it can finally break through the resistance it’s been struggling with for several months and reach 100, or not. ✅

DXY Watching 98.800 Resistance as Shutdown Risks Weigh on DollarHey Traders, in today’s trading session we are monitoring DXY for a potential selling opportunity around the 98.800 zone. The Dollar Index remains in a broader downtrend and is currently in a correction phase, with price approaching a key daily resistance area.
Structure: The market has been forming lower highs, consistent with bearish momentum. The 98.800 level aligns with both structural resistance and trendline rejection zones.
Fundamentals: The ongoing US government shutdown continues to pressure sentiment around the Dollar. The longer the impasse persists, the higher the risk of fiscal strain and downside pressure on the USD.
Next move: Watching how price reacts around 98.800 — a rejection here could confirm further downside continuation in line with the prevailing trend.
Trade safe,
Joe.

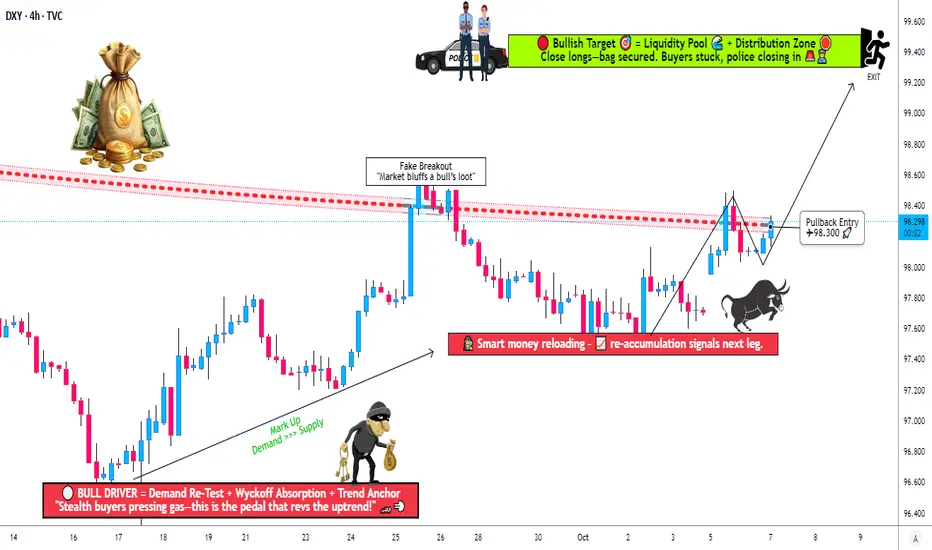
DXY Breakout Confirmed — How Far Can Bulls Run?💰 Thief’s Heist: DXY Bull Raid in Progress ⚡ Layered Entry Strategy!
📈 Setup Summary
Asset: DXY Dollar Index (Cash)
📊 Bias / Plan: BULLISH — 0.786 Triangular Moving Average was breached by buyers → trend confirmation in progress 🚀
🎯 Thief’s Game Plan (Swing / Day Trade)
🕵️ Entry Plan — “Layered Thief Style”:
💎 Any price level entry is valid — flexibility is the Thief’s advantage!
🔹 Sample Limit Layers:
• 97.800
• 98.000
• 98.200
(💡 You can increase or reduce layers based on your own style — stack smartly!)
🧨 Stop Loss (Thief SL):
⚠️ 97.400 → This is the “Thief SL Zone”
👉 But you’re the mastermind — set your own SL if you prefer!
💰 Target Zone (TP):
🚧 Police Barricade at ~99.400 — strong resistance area + oversold trap likely
💨 Thieves escape with bags before the trap closes!
⚙️ Take profit partially or fully at your own comfort — be swift, be smart 🦅
🧩 Market Insight & Technical Reasoning
✅ 786 Triangular MA breach confirms bullish structure
✅ DXY strength often follows Treasury Yield push 📈
✅ Strong USD = Weak Gold & EUR/USD usually
✅ Oversold readings hint buyers ready to counter attack
🔗 Correlation Watchlist (Related Pairs)
Keep an eye on these for confirmation 🔍
💶 FX:EURUSD → usually inverse to DXY
💷 FX:GBPUSD → tracks EUR/USD correlation
💴 FX:USDJPY → directly correlates with DXY
🥇 Gold ( OANDA:XAUUSD ) → moves opposite to DXY
💵 TVC:US10Y Yields → rising yields = bullish DXY
💡 Key Tip:
When EUR/USD & GBP/USD drop sharply + yields rise → DXY often continues its rally 🧭
⚠️ Notes & Thief Disclaimers
👑 Dear Ladies & Gentlemen (Thief OGs):
I’m not recommending my SL or TP — make your own risk rules 💼
You can make money, take money, or just watch the play unfold 🎭
This is a “Thief Style” strategy, shared for fun & educational inspiration only 🧠
Always manage risk & protect capital first — thieves survive by escaping, not over-staying 💨
✨ “If you find value in my analysis, a 👍 and 🚀 boost is much appreciated — it helps me share more setups with the community!”
Disclaimer: this is thief style trading strategy just for fun
#DXY #USDIndex #Dollar #Forex #LayeredEntry #SwingTrade #DayTrade #ThiefStrategy #TrendBreak #SmartMoney #TechnicalAnalysis #USD #TradingView #FXStrategy
07.10.25 AUDNZD Trade Recap/ Morning ForecastPairs on Watch
FX:AUDNZD Neutral
FX:GBPNZD Short
FX:AUDCHF Long
A short overview of the instruments i am looking at for today, Multi-timeframe analysis down to what i will be looking at for entry

US Dollar (DXY), strong rebound in 2026?The US Dollar is by far the weakest major currency on the FX market in 2025. But this situation could reverse in 2026 as the second year of the presidential term begins, a year that is historically unfavorable to risky assets and favorable to the US Dollar as a safe haven. Recall that during Trump’s first term, the first year (2017) saw a sharp decline in the dollar on the Forex, followed by a strong recovery in the second year (2018).
Could we see a “bis repetita” scenario with 2026, the second year of the second term?
The chart below shows the US Dollar’s last place ranking among major FX currencies.
1) The fundamental reasons that could support a rebound of the US Dollar in 2026 beyond the simple seasonality of the presidential cycle (midterms)
Several fundamental factors could sustain a US Dollar rebound in 2026:
• A shift in Federal Reserve policy could play a central role. If inflation persists or rises, the Fed could suspend or reverse the expected rate cuts, maintaining a yield differential favorable to the dollar and attracting foreign capital.
• Stronger US growth compared to the rest of the world, driven by consumption, technology, and energy independence, would make dollar-denominated assets more attractive and boost demand for the currency.
• An improvement in the trade balance, thanks to reshoring, higher exports, or lower imports, would support the dollar by limiting structural capital outflows.
• Credible fiscal consolidation signals, such as a plan to reduce deficits, would strengthen investor confidence and ease concerns about public debt, contributing to a stronger dollar.
• Increased political stability and greater predictability of economic policies, especially under a market-friendly administration, would reduce risk premiums and favor the US Dollar.
• Higher demand for safe-haven assets in the event of geopolitical tensions (e.g., China-Taiwan or the Middle East) or a global economic slowdown would boost flows into the dollar.
• Finally, the relative weakness of other major currencies — euro, yen, yuan — due to looser monetary policies or economic fragilities, would reinforce the dollar by comparison.
Together, these dynamics could create a structurally favorable environment for US Dollar appreciation in 2026.
2) To validate a US Dollar rebound, we need a technical reversal signal on long-term charts, and this is not yet the case. Here’s what to watch for
The historical weekly chart of the US Dollar shows how bullish reversals built up in 2018 and 2021. The conditions required are: stabilization of the dollar over several weeks, bullish divergences between price and momentum, a bullish reversal pattern, and finally, a breakout above resistance confirming the pattern.
At this stage, these elements are not fully in place, and the US Dollar remains bearish on FX as long as it stays below the 100-point resistance.
DISCLAIMER:
This content is intended for individuals who are familiar with financial markets and instruments and is for information purposes only. The presented idea (including market commentary, market data and observations) is not a work product of any research department of Swissquote or its affiliates. This material is intended to highlight market action and does not constitute investment, legal or tax advice. If you are a retail investor or lack experience in trading complex financial products, it is advisable to seek professional advice from licensed advisor before making any financial decisions.
This content is not intended to manipulate the market or encourage any specific financial behavior.
Swissquote makes no representation or warranty as to the quality, completeness, accuracy, comprehensiveness or non-infringement of such content. The views expressed are those of the consultant and are provided for educational purposes only. Any information provided relating to a product or market should not be construed as recommending an investment strategy or transaction. Past performance is not a guarantee of future results.
Swissquote and its employees and representatives shall in no event be held liable for any damages or losses arising directly or indirectly from decisions made on the basis of this content.
The use of any third-party brands or trademarks is for information only and does not imply endorsement by Swissquote, or that the trademark owner has authorised Swissquote to promote its products or services.
Swissquote is the marketing brand for the activities of Swissquote Bank Ltd (Switzerland) regulated by FINMA, Swissquote Capital Markets Limited regulated by CySEC (Cyprus), Swissquote Bank Europe SA (Luxembourg) regulated by the CSSF, Swissquote Ltd (UK) regulated by the FCA, Swissquote Financial Services (Malta) Ltd regulated by the Malta Financial Services Authority, Swissquote MEA Ltd. (UAE) regulated by the Dubai Financial Services Authority, Swissquote Pte Ltd (Singapore) regulated by the Monetary Authority of Singapore, Swissquote Asia Limited (Hong Kong) licensed by the Hong Kong Securities and Futures Commission (SFC) and Swissquote South Africa (Pty) Ltd supervised by the FSCA.
Products and services of Swissquote are only intended for those permitted to receive them under local law.
All investments carry a degree of risk. The risk of loss in trading or holding financial instruments can be substantial. The value of financial instruments, including but not limited to stocks, bonds, cryptocurrencies, and other assets, can fluctuate both upwards and downwards. There is a significant risk of financial loss when buying, selling, holding, staking, or investing in these instruments. SQBE makes no recommendations regarding any specific investment, transaction, or the use of any particular investment strategy.
CFDs are complex instruments and come with a high risk of losing money rapidly due to leverage. The vast majority of retail client accounts suffer capital losses when trading in CFDs. You should consider whether you understand how CFDs work and whether you can afford to take the high risk of losing your money.
Digital Assets are unregulated in most countries and consumer protection rules may not apply. As highly volatile speculative investments, Digital Assets are not suitable for investors without a high-risk tolerance. Make sure you understand each Digital Asset before you trade.
Cryptocurrencies are not considered legal tender in some jurisdictions and are subject to regulatory uncertainties.
The use of Internet-based systems can involve high risks, including, but not limited to, fraud, cyber-attacks, network and communication failures, as well as identity theft and phishing attacks related to crypto-assets.
