05.12.25 Daily ForecastPairs on Watch -
FX:EURUSD
FX:AUDUSD
A short overview of the instruments I am looking at for today, multi-timeframe analysis down to what I will be looking at for an entry. Enjoy!
Market insights

GU ASIA SC Market moved 30 pips in ASIA, DXY is reversing around 99.00 line, 15 pips TP could be gained before market start hyping in LDN

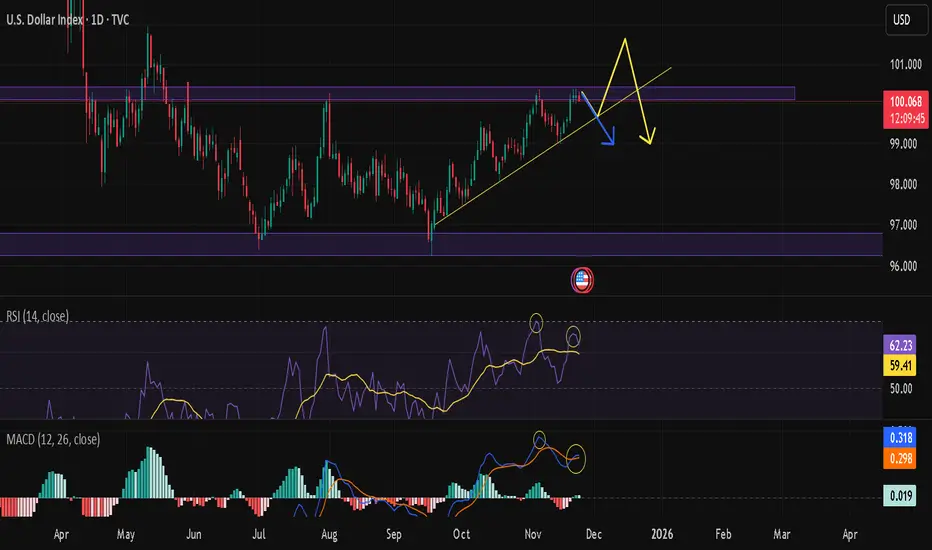
Dollar Index Bearish Setup: Dead Cat Bounce Then Collapse. The weekly chart shows a strong bearish signal, with a bearish engulfing candle forming and a confirmed double top structure on the daily chart. Price has already broken below the neckline of this double top, indicating weakening bullish momentum.
Currently, price is consolidating just below the 50 EMA. With RSI deeply in oversold territory and stochastic oscillators near cycle lows, a short-term relief bounce is likely. This bounce could push price toward the 99.032 level, just below the 21 EMA, which now acts as a key resistance zone.
On the daily timeframe, the 9 EMA has crossed below the 21 EMA, reinforcing a bearish trend and suggesting that upward moves will face strong resistance. More importantly, the weekly stochastics have already crossed down, and the weekly MACD is showing clear signs of momentum loss.
In conclusion, after a potential short-term bounce to fill the gap on the 4-hour chart—where a death cross is also forming—the broader expectation is for a significant bearish continuation in the Dollar Index.
As always, I thank you for supporting my publications with a boost and sharing your own thoughts in the comment section. I wish you the best trading in the coming week. Cheers!

DXY FRGNT Forecast - Q4 | W50 | Y25 |📅 Q4 | W50 | Y25 |
📊 DXY FRGNT Forecast
🔍 Analysis Approach:
I’m applying Smart Money Concepts, focusing on:
Identifying Points of Interest on the Higher Time Frames (HTFs) 🕰️
Using those POIs to define a clear trading range 📐
Refining those zones on Lower Time Frames (LTFs) 🔎
Waiting for a Break of Structure (BoS) for confirmation ✅
This method allows me to stay precise, disciplined, and aligned with the market narrative, rather than chasing price.
💡 My Motto:
"Capital management, discipline, and consistency in your trading edge."
A positive risk-to-reward ratio, paired with a high win rate, is the backbone of any solid trading plan 📈🔐
⚠️ Losses?
They’re part of the mathematical game of trading 🎲
They don’t define you — they’re necessary, they happen, and we move forward 📊➡️
🙏 I appreciate you taking the time to review my Daily Forecast.
Stay sharp, stay consistent, and protect your capital
— FRNGT 🚀
TVC:DXY

Somethings Off. Santa Clause Rally Ending In Sync w/Dollar Drop?Trading Fam,
Providing a quick update on a few new and alarming chart events and indications I am seeing. Usually, when the dollar drops, as long as the VIX remains low, stocks and crypto will rise. However, an anomaly is currently occurring on the charts. As stocks seem to be topping, the dollar is also testing major 17 year and 42 year support! I am not quite sure how to read this, but it seems that in this case, we could see stocks drop along with the dollar. How could this happen? Unknown. Could it have something to do with BRICS? Could it have something to do with the upcoming Fed decision? I honestly don't know how to answer this. I am simply just reading what the charts are showing me and telling you what it might mean for stocks and crypto.
Let's dive in!
✌️Stew

DXY holding longs after correction-on my pairs with US dollar I'm still long for the following weeks. After It's correction the dollar should continue It's long movement.
I'm holding my longs on USD/CAD, USD/CHF, USD/JPY, GBP/USD.


Usdx . Dollar index Dollar index will invite us to his impulive party
Price will retrace to levels 98 . 97.485
Targeting 103 -104
Dont miss the party !
Party invalidation : daily close below 96.5 or below lowest low formed in recent downward trend .

The DXY has room to reboundThe DXY has room to rebound from the 98.848 level after the decline in new unemployment claims.
A stronger labor reading signals fewer layoffs and a resilient U.S. economy, reducing the likelihood of near-term Fed rate cuts.
Sticky rate expectations and stronger yield support typically lift the dollar, giving the DXY a bullish bias from current levels.

04.12.25 Daily ForecastPairs on Watch -
FX:EURUSD
FX:GBPUSD
A short overview of the instruments I am looking at for today, multi-timeframe analysis down to what I will be looking at for an entry. Enjoy!

DXY at a KEY “Decision Point” on the Supply ZoneAfter an extended bullish duration, the DXY is now challenging a technically critical “Supply Zone” (100.150 – 100.600). Further away from key levels, both pump and dump up and down, momentum oscillators on all time frames give us mixed signals of exhaustion from buyers and that we are near to making a big decision in the direction of our market.
A comprehensive technical look that includes the broader structures and multi-month macroeconomic supply-demand analysis.
TECHNICAL OUTLOOK
Critical Resistance (Purple Zone): We are currently sitting right inside that 100.150 – 100.600 corridor. This is a level we know well—it’s packed with strong selling pressure and smart money order blocks. Think of this zone as a huge mental hurdle for the bulls; trying to go "Long" here without seeing a clean, high-volume breakout is just asking for trouble with a bad risk/reward setup.
Trend Structure: That ascending yellow trendline connecting the lows since September has been holding the price up so far. But look closer—the space between the price and this trend support is squeezing tight (Compression). This usually tells us one thing: volatility is kicking in and a big move is brewing.
Negative Divergence (RSI) : Here’s the warning sign. While the daily chart is trying to make new highs or just hanging on at resistance, the RSI is losing steam and making lower highs. This "Bearish Divergence" is a classic signal that the trend is running on fumes.
Momentum (MACD) : The MACD histogram is fading out, which confirms the bulls are getting tired. It hints that profit-taking—and the sellers taking over—is likely just around the corner.
MACROECONOMIC AND FUNDAMENTAL DYNAMICS
Fed Expectations : The market is scrambling to rethink the Fed's rate path for 2025. We are watching the data like hawks right now; even a small sign of cooling in jobs or PMI data could spark a rejection from this resistance and send the DXY correcting downwards.
Bond Yields : Any pullback in the US 10-Year Treasury Yields (US10Y) is going to add fuel to the fire for sellers on the Dollar Index.
Liquidity Hunt: Watch out for the "fakeout." Market makers might try to push the price just above that 100.600 level to grab liquidity and hunt the stops of early shorters before slamming it back down. Keep your eyes peeled on the Price Action here.
STRATEGY AND OUTLOOK
Since we are banging our heads against resistance, opening new long positions here just isn't juicy enough risk-wise.
Bearish Scenario: If we see a hard crash with volume breaking that ascending yellow trendline, that seals the deal for a reversal. If that happens, we’re looking at intermediate supports first, with the main target being that 96.50 level down low.
Bullish Scenario : Unless we get a solid daily candle close above 100.800, any rallies should be looked at as opportunities to sell. If the price stays above that level, then this idea is dead in the water.
Conclusion: It’s a "sit on your hands" moment. Waiting for that trend support to break is the safest confirmation we can get before jumping in.
Disclaimer : Just sharing my personal notes and educational analysis here, not financial advice.
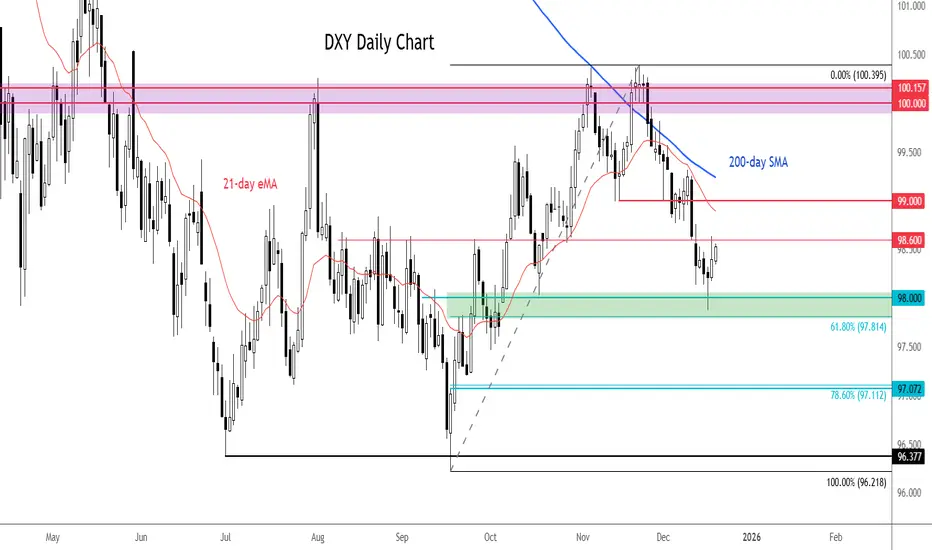
Dollar index levels to watch ahead of CPI, ECB and BOJAhead of today's release of US CPI and the upcoming rate decisions by the ECB and BOJ, the dollar index has stabilised slightly this week, although the broader picture remains one of consolidation with a downside bias.
The failure to break above the 100.00–100.40 resistance zone in November — an area that also capped gains in August — reinforced a pattern of lower highs and lower lows.
Since then, the index has broken below former support at 99.00 and 98.60, both of which now act as near-term resistance. As long as price remains below these levels, downside risks remain dominant despite recent stabilisation.
Initial support sits around 98.00, close to the 61.8% Fibonacci retracement at 97.81. A sustained break lower would expose the 97.00 level, with the next key support zone around the July–September lows near 96.20–96.40. Overall, rallies continue to look corrective unless the index can reclaim 99.00 decisively.
By Fawad Razaqzada, market analyst with FOREX.com
DXY - second area LONG DXY - second area LONG , this is second zone for long, use risk and trade managmnet

DXY Trade Set Up Dec 17 2025Price has pushed higher and is now testing a 4h FVG which i will expect a continuation higher into BSL and daily FVG before a reversal back down


MY OUTLOOK ON DXY 2025 We are range-bound in 2025. Caught some of the swings, looking for further downside to make a triple bottom. Don't know what 2026 holds, but I'm in serious anticipation of a trend reversal.

DXY Bullish this week: Buy pressure This week, for the DX,Y looking for Buys
Meaning:
Bullish
UCHF
UJ
UCAD
Bearish:
AU
EU
GU
NU

What's ahead for the NEW YEAR 26'?TVC:DXY
Becoming Profitable in the Auction, is a choice only chosen by the 'PROFITABLE'...
As of today the U.S. Dollar Index (DXY) has fallen significantly around -9.5% to -10% year-to-date, marking its worst performance in decades due to expectations of U.S. interest rate cuts and a strengthening global economy. Now the question is, What's ahead for the DOLLAR? Will it continue to weaken for the year of 2026 or gain back strength? What are your thoughts, lmk in the comments...
Continued Success,
TreyHighPwr

DXY Trade Set Up Dec 16 2025Price has swept SSL and has low range liquidity above which i will expect to be swept before a continuation lower

DXY – Technical & Fundamental OutlookTechnical:
The DXY continues to trade with a clear bearish bias after being rejected from the 100.00–100.30 supply zone. Price is making lower highs and lower lows, holding below prior resistance, which now acts as a strong cap. As long as the index remains below 99.00–99.50, downside pressure dominates, with room toward the 98.00 area. Any rebound looks corrective unless there is a clean recovery above 100.00.
Fundamental:
The dollar remains pressured by expectations of a more dovish Federal Reserve stance, with markets pricing in slower economic momentum and potential rate cuts ahead. Softer US macro data and easing inflation expectations continue to weigh on USD demand, while risk assets gain relative strength. Near-term DXY direction will be driven by incoming US data and Fed communication, but the broader bias stays bearish unless fundamentals shift materially.

DXY key levels to look out for this trading weekI am posting the key levels on DXY to take into account while trading this week, analysis based upon Forex Factory strength of news releases.
Price action Price has already tested the breaker block currently sweeping and closing inside from here we might get a reaction to the upside

DXY FORECASTMY idea on DXY coming next week. Dxy created a daily imbalance with good order block, Using FIB retracement premium zone falling in between the imbalance zone.. A good retracement for a short will be a good one to look into even in an uptrend market because only internal low has been tsken so far
