dxy 1h🔹 Overall Outlook and Potential Price Movements
In the charts above, we have outlined the overall outlook and possible price movement paths.
As shown, each analysis highlights a key support or resistance zone near the current market price. The market’s reaction to these zones — whether a breakout or rejection — will likely determine the next direction of the price toward the specified levels.
⚠️ Important Note:
The purpose of these trading perspectives is to identify key upcoming price levels and assess potential market reactions. The provided analyses are not trading signals in any way.
✅ Recommendation for Use:
To make effective use of these analyses, it is advised to manually draw the marked zones on your chart. Then, on the 5-minute time frame, monitor the candlestick behavior and look for valid entry triggers before making any trading decisions.
Trade ideas

HSC+SH EUTo accomodate any attempt to reach pre ois high or weekly
Half session confirmation LDN 2nd moving 24 pips, flexed SL 2 pips to give trade breathing space in case atte.pted to reach Weekly high, aligns with DXY movement (reversing against strong holding support line) that might hold for one last time :)

FOMC OutlookAs US–China trade war concerns ease, the market’s attention is turning to today’s FOMC meeting. The Fed is expected to cut rates by 25 basis points, a move that is already fully priced in. The decision comes amid “rising risks in the labor market,” as emphasized by nearly all Fed members.
In addition to today’s expected 25 bps cut, markets are also pricing in another reduction at the December meeting. With inflation increasing more slowly than expected and Trump easing tariffs, the Fed now has greater flexibility to lower rates, aligning with our outlook.
Two main topics will be in focus at this meeting. The first is quantitative tightening (QT). The Fed slowed QT earlier this year, and based on Powell’s recent comments, it could slow further or even be halted entirely. The 10-year Treasury yield has already fallen below 4% in anticipation of such a move. The Fed is likely to announce the end of QT or signal that it will conclude soon. If the announcement did not come, it will be seen as hawkish.
The second topic is further rate cuts in 2026. Markets are pricing in two to three additional cuts that year. Powell’s tone regarding the 2026 outlook could be one of the key drivers of today’s market reaction.
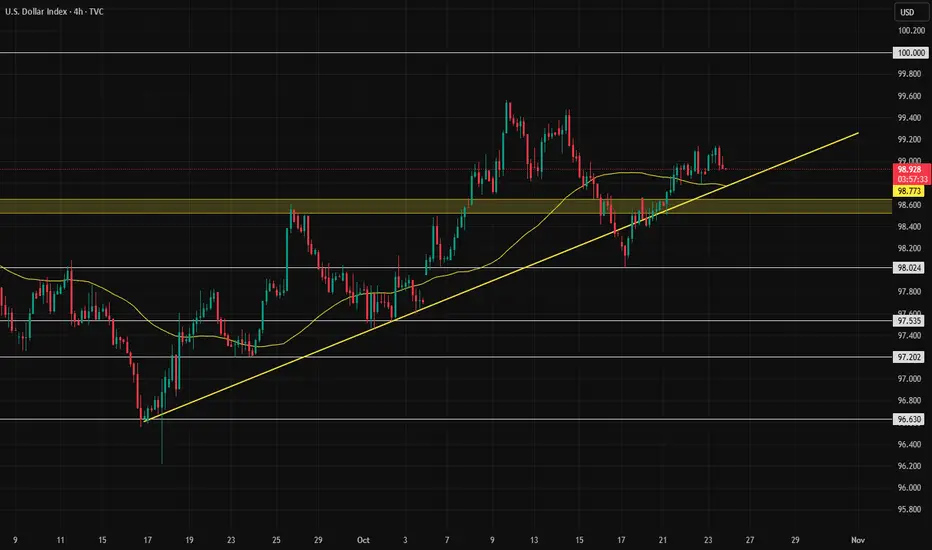
The dollar index remains calm ahead of the meeting. After testing the long-term trendline from 2011 (white line), the dollar recovered above its 100-day moving average and has since turned flat. The 99.60–100.80 zone, previously a major support, now acts as resistance. The dollar is currently trapped between that resistance and the long-term trendline. Depending on the outcome of today’s FOMC meeting, the index could start to move either toward the resistance area or back to the trendline.

DXY: DECODED ANALYSIS My technical analysis on DXY: It currently shows a bullish trend on the quarterly, monthly, and weekly charts. The target is $111.68.
This information is for educational purposes only.
Always DYOR (Do Your Own Research).
Note: TradingView does not allow showing certain charts that go beyond technical analysis.

DXY relative perf. to predict market tops.Using intermarket analysis. During expensive markets, demand for US dollar grows - and often it correlates with stock market tops. Step further - we can use intermarket analysis of DXY/SPX. Look for trend break out and Higher Lows in the structure. ✅

US Dollar Coiled for Breakout ahead of the FedThe US Dollar is coiling just below resistance, with DXY trading within a contractionary range ahead of tomorrow’s FOMC rate decision. The index rallied nearly 3.5% off the yearly lows before stalling, with price consolidate within the first weekly range of October heading into the highly anticipated FOMC rate decision tomorrow. The focus is on a breakout of this range to drive the next directional move as we head into the close of the month.
Weekly support rests with the 61.8% retracement of the mid-September rally / 2025 low-week close (LWC) at 97.50/65. A break / weekly close below this threshold would threaten downtrend resumption toward the 2021 high at 96.94 and the June low at 96.37 – both areas of interest for possible downside exhaustion / price inflection IF reached. The next major technical consideration rests 94.65/97- a key pivot-zone defined by the March 2020 swing low, the 78.6% retracement of the 2021 advance, and the 100% extension of the 2023 decline. Look for a larger reaction there IF reached.
Weekly resistance is eyed at the 2023 low / 209 high / April low-week close (LWC) at 99.59/67 with bearish invalidation just higher at the 2024 low / LWC at 100.16/42- a breach / weekly close above this threshold is needed to suggest a more significant low is in place / a larger trend reversal is underway. Subsequent resistance objectives eyed at the 38.2% retracement of the yearly range at 101.55 and the 52-week moving average at 101.98.
Bottom line: The U.S. Dollar is coiled just below resistance, and the focus is on a breakout of the 97.50-99.66 range for guidance heading into the close of the month. From a trading standpoint, losses should be limited to 97.50 IF the Dollar is higher on this stretch with a breach above 100.41 needed to validate a more significant breakout in price.
-MB

DXY Long-Term big surprise revealed by Gold! Hi Guys,
I've been doing some research on the DXY and Gold charts and I've been reading news headlines
For the past 20 years and trying to link it with both DXY and Gold charts and I've found out
Some interesting facts that literally flipped the market upside down.
So I pointed each even with the corresponding candle and I would love to know what do you guys
Think about this so feel free to comment and share your opinion on what's really going on behind
The scenes.

DXY — The Market UpdateDXY — The Market Therapist’s Take
🧭 Context
The U.S. Dollar sits between 98.613 and 98.143 — the high and low from Tuesday, October 21.
That zone still controls the market’s psychology.
Price is absorbing every order above and below it — a quiet accumulation phase that looks like chaos, but isn’t.
The question isn’t “where next,” it’s “who’s still trapped inside.”
📐 Technical Map
Daily structure remains bullish range, while weekly and monthly dynamic maps stay bearish.
Four months straight, price has rotated through the same rhythm — collecting both buy and sell stops across cross-assets.
It’s not indecision; it’s design.
If 98.613 breaks, we open expansion higher.
If 98.143 gives way, next pivot becomes the target.
🌐 Fundamental Pulse
The dollar’s not crashing — it’s unwinding its old story.
For two years, the script was simple: high yields, safe haven, strong America.
Now, traders are rewriting the plot.
Prediction markets show a 40% chance of a U.S. recession in 2025.
Rate-cut expectations jumped from one to three.
Meanwhile, Germany’s €500 B infrastructure and defense plan signals a new fiscal identity for Europe — and money follows that kind of momentum shift.
📊 Volume & Order Flow Map
Volume tools mark 98.197 as the month’s Volume Key line.
Close above it, and the bias turns bullish — potential for expansion.
Close below, and we remain in a controlled range.
This is no accident — it’s liquidity engineering.
Volume flow reveals the intention behind every candle.
🎯 Plan
Price symmetry holds mid-range, trapping traders chasing both sides.
In this kind of terrain, in-and-out execution is survival, not fear.
Stay inside structure until the market itself declares direction.
The currency game isn’t random — it’s orchestration.
When you can’t hold bias, hold discipline.
When price hides intent, follow volume.
Institutional Logic. Modern Technology. Real Freedom.

DXY Weekly Outlook - Impact on XAU/USD & EUR/USD📊DXY Weekly Outlook - Impact on XAU/USD & EUR/USD
On the weekly timeframe, the U.S. Dollar Index (DXY) has shown a clear Market Structure Shift (MSS) after retesting a key support zone, identified as a weekly breaker block.
This technical setup suggests a bullish outlook for the upcoming week. 📈
A strengthening dollar typically translates into a weaker Euro and potential downward pressure on Gold (XAU/USD) due to their negative correlation with the USD.
In addition, there is engineered draw on liquidity to the upside, supported by an unfilled imbalance (weekly Fair Value Gap) , providing a strong indication that price may continue to seek higher levels in order to rebalance this inefficiency.
Also, we have identified a Smart Money Technique (SMT) divergence on the weekly timeframe between DXY and EUR/USD, adding strong confluence to our outlook.
Specifically, DXY has formed a lower low, while EUR/USD has created a higher high ,an indication of underlying dollar strength and bearish momentum building for EUR/USD.
On the EUR/USD weekly chart, a liquidity grab followed by a Market Structure Shift further supports our bearish bias for the pair in the coming week.
In summary:
DXY: Bullish bias 🐂
EUR/USD: Bearish bias 🐻
XAU/USD: Bearish bias 🐻
Overall, based on current structure, SMT divergence, and prior technical analysis, I expect the U.S. Dollar to strengthen in the week ahead, with EUR/USD and Gold likely to experience downward movement.

DXY RARE BULLISH FRIDAY SET UPFridays are notoriously bad for dollar, however, today’s Friday session is different.
Due to the ongoing shutdown US data releases are backed and stacked up. There is a large manipulation in play (but don’t worry, trump is busy building his ballroom wing edition plans to the White House and too busy today for tariff surprises).
Long to target zone. Safe exit at 99.5, brave buyers could extend further.


DXYDaily structure pointing to an easing of price action in the near term. 5 bar fractals providing the extremes of the range. The bullish Cypher is obviously incomplete and a guess. But the bottom of the range and the shift in sentiment needs to be revisited before any upside. The Cypher would give us the wyckoff spring and upside taking out highs on the way to 💯.

Analysis of the Dollar Index.The Dollar Index has been in an upward trend towards 100 for nearly 40 days, and the likelihood of reaching the 100 level is high. This is probably going to happen in the coming weeks.
It’s almost bullish across all timeframes below the daily, and only negative news can change this trend.
DXY LONGit couldn't break the channel and moves down.
maybe something great will happen.
I am looking at oil.

DXY OutlookWhen the Dollar Rises, Crypto Feels the Heat 💵🔥
The DXY (U.S. Dollar Index) tracks how strong the dollar is against other currencies. When it climbs, it means investors are moving money into safe assets like cash or U.S. bonds — and away from risky plays like Bitcoin and altcoins.
A stronger dollar makes crypto more expensive globally, reduces demand, and usually pushes prices down.
When the DXY cools off, liquidity flows back into risk assets — that’s when crypto tends to bounce.
In short:
📈 DXY up = crypto down
📉 DXY down = crypto up
Watch the DXY; it’s one of the best macro indicators for crypto moves.

The Dollar Index (DXY) AnalysisDXY is holding above 98.75 (Fib 61.8%), indicating a short-term bullish bias after bouncing from the recent low near 98.15.
Momentum remains positive, with the index approaching resistance at R1: 99.00 and a potential upside target toward R2: 99.25–99.40 zone.
RSI near 60 reflects moderate bullish momentum without being overbought.
Bollinger mid-band (around 98.75) acts as near-term support, keeping intraday sentiment positive.
Bias stays bullish above 98.75, but rejection near 99.25 may trigger minor profit booking.
Fundamental Factors
- Foreign institutional investors have restarted accumulating US stocks:
- October witnessed the highest purchase of US stocks by non-US investors
- Total purchase made = +$22 billion so far in October, the most in last 4 months.
- Marking the 3rd consecutive monthly inflow, after negative inflows reported in July.
- Meanwhile, foreign holdings of US equities rose to a record $20 trillion last quarter.
It seems everyone again wants to enter the US stock market.
Remember 2 Things:
1. When stock market (riskier market) attracts demand =>> The safe havens (Gold) "might" get weaker
2. For Foreign Investors, to invest in US Stock markets =>> first needs to purchase US Dollar =>> US Dollar Strengthens
- When US Dollar strengthens =>> Gold weakens


King Dollar Returns: 98.190 Break💵 Dollar Breakout — Cross Assets Dumping Hard
The U.S. Dollar just flipped 98.190 CAP
After weeks of hesitation, DXY broke clean through the 98.190 daily imbalance, turning prior resistance into a launchpad — and global markets are reacting fast.
📊 Technical Frame
The daily imbalance that capped price now acts as fresh support, confirming a higher-timeframe breakout.
Momentum alignment across 4H and Daily frames signals a firm trend shift.
Upside magnet sits at 98.800–99.200, the next liquidity shelf where sellers may regroup.
🌐 Fundamental Pulse
Cross assets are dumping — EUR AND GBP all bleeding as Dollar strength tightens global liquidity.
Yields grind higher with markets reloading for extended Fed tightness.
Risk aversion and portfolio deleveraging are amplifying the move — capital is flowing back into USD safety.
🧭 Takeaway
The Dollar is back in charge. Above 98.190, the structure supports continuation toward 99+.
In this regime, correlation flips: strong Dollar = weak everything else.
When the Dollar breathes in, global markets exhale.

US DOLLAR UPDATE DXYDXY — Rangebound but Firm: 98.19 Holds the Line
Dollar holds steady inside Friday’s range — a quiet coil before the macro rotation.
🧭 Context
The Dollar spent Monday trapped between Friday’s high and low, liquidating the upper wick at 98.190 before closing back within range.
Price currently sits near the 50% Fibonacci retracement (98.123), keeping the bullish range intact but unconfirmed.
The market is balanced, not directional — patience is the edge here.
📊 Technical Map
Structure: Price remains inside a clean bullish range with a volume imbalance still unfilled near 97.436.
Momentum: Mildly bullish but range-dependent — upward bias, no breakout confirmation yet.
Key Levels:
Support → 97.672 / 97.436
Pivot → 98.123
Resistance → 98.190 / 98.420
🌐 Fundamental Pulse
This week’s key drivers: PMI flash, GDP (Thu), and PCE inflation (Fri) — all high-impact data that will steer the Fed narrative.
Yields remain firm but cooling; risk appetite mixed as traders await fresh growth signals.
Without new inflation pressure, the Dollar likely stays rotational within its higher-timeframe band until late-week catalysts.
🎯 Plan
Primary: Avoid midrange noise. Best setups are at range extremes — 97.6 support and 98.2 resistance.
Execution Filter: Wait for volume expansion or 1H close confirmation before breakout engagement.
Alternative: Failure to hold 98.12 reopens imbalance toward 97.43; a break above 98.19 invites continuation to 98.4–98.6.
⚠️ Risk / Alt
Range = noise. Stay tactical. High-frequency trades only until volatility expands.
🧠 Mindset Pulse
“In dull markets, discipline is the premium asset — not conviction.”
Professionals don’t chase noise; they preserve readiness.

DXY: The Market Is Looking Down! Short!
My dear friends,
Today we will analyse DXY together☺️
The recent price action suggests a shift in mid-term momentum. A break below the current local range around 98.118 will confirm the new direction downwards with the target being the next key level of 98.055 and a reconvened placement of a stop-loss beyond the range.
❤️Sending you lots of Love and Hugs❤️

Forex weekly review: fundamental analysis I found myself feeling a little fed up during the week starting Monday 13 October, unable to form a strong confidence in the near term direction of the currencies. I felt lack a lack of US data is really starting to bite, central bank speakers didn't really tell us anything new, Mr trump's brokerage of peace in the middle east didn't create any 'risk on oomph'. All we were left with was snippets of headline news regarding China's reaction to 'tariff escalation', none of which I felt comfortable trading in either direction.
But, far be it for me to complain about a US government shutdown making my trading decisions more difficult. There are actual people wondering when their next day of work will be and if they will even have a job to go back to.
On a positive note, we did get a couple of catalysts moving the currencies, 'soft' employment data from the UK and Australia created momentum for potential short term trades, I say short term because the data was against the tide of 'hawkish interest rate rhetoric' from both countries.
Earnings season kicked of fairly positively, it may well be that the tech company earnings over the next couple of weeks will create our best opportunities in the absence of US data, but hopefully the shutdown will end before it comes to that.
I have read US CPI data will be reported at some point despite the shutdown, I'm unsure how relevant it will be considering it'll be old news.
The previous week's JPY euphoria (negative JPY) was unwound due to new LDP leader TAKACHI attempting to sound hawkish. Which leaves us with a cloud surrounding our two staple currencies, the USD (no data) and JPY (rate hike uncertainty).
Finally, the week ended with a bit of back and forth, concerns over the US banking sector created risk off sentiment, seeing the VIX rise to 28. But Mr Trump tempered the negativity with positive china comments.
I begin the new week without a clear bias, prepared to trade momentum with a catalyst in either direction.
On a personal note, it was a week of two AUD JPY trades, both stopped out. I stand by my AUD JPY long 'risk on' trade, especially as the stop loss was behind 1hr support. But I accept that Friday's AUD JPY short trade was a mistake, perhaps an attempt to pre-empted the market out of frustration, I tried to predict a risk off end to the week. A mistake, especially considering Mr Trump's positive china comments. And a reminder to myself to trade clear momentum with a catalyst. With that in mind, the time to trade to bank induced negativity would have been during Friday's Asian session.
Let's see what the new week brings.

DXY - Potential FutureAlthough there is a clear bearish channel (purple 1px lines), I believe this is not the true pattern and it will form a low on the orange rail, then go upwards to the top rail as capital flies to safety, before the real decline of the DXY begins.
TA is a mapping of a more complex system, we can use to navigate these charts, however its simplicity leads me to believe the market makers are capable of manipulating expectation while channels are still forming.
TA is a game between market maker (Gods of the markets) and individuals who use it. Therefore tricks etc.. apply.
Let's see.

DXY — Between Balance and Breakout
Date: Sunday, October 19
Timeframe: Daily
Analyst: @CORE5DAN
Context
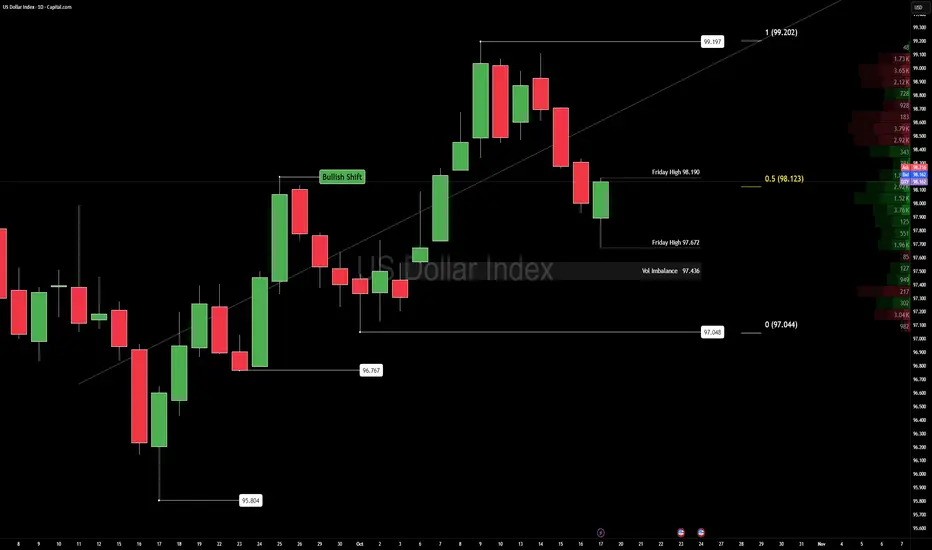
The U.S. Dollar Index holds a bullish daily range between 99.197 and 97.048, now sitting around the Fibonacci 50% retracement at 97.044.
Friday’s session formed a tight box — high 98.190, low 97.672 — showing compression inside balance conditions.
Price trades above mid-range, with a volume imbalance near 97.436 acting as a magnet for short-term rotation.
Key liquidity rests just below 97.700, and reactions there could define early-week direction.
Technical Map
• Structure: Short-term bullish, still inside a broader weekly bearish framework. Watch 97.436–97.700 — a clean reaction zone where imbalance and liquidity converge.
• Momentum: Range-bound bullish, confirming control but lacking expansion. A daily close above 98.190 opens the path toward the range high at 99.197.
• Volume: Imbalance remains unfilled — ideal for mean-reversion setups before any breakout impulse.
Fundamental Pulse (Week Ahead)
• Macro Drivers:
— US GDP advance data: key for growth tone.
— Core PCE inflation: the Fed’s favored inflation gauge.
— Fed speakers and PMIs: tone setters for November rate outlook.
• Yields:
— The 10-year sits near 4.6%.
— A push higher = bullish Dollar, stronger short-term flows.
— A pullback = potential consolidation across USD pairs.
• Global Flows:
— Mild rotation out of risk assets and emerging markets supports the Dollar.
— EURUSD and XAUUSD both reflect this hesitation near key supports.
Plan
Bias stays bullish in the short term, bearish in the long term.
We favor volume imbalance fills and reaction trades at 97.436–97.700 before re-evaluating structure.
If macro data or yield spikes support Dollar demand, expect continuation toward 98.190+.
Otherwise, a drift below 97.436 would signal distribution and confirm corrective pressure.
“Structure is the compass; sentiment is the weather.”
Mindset Pulse
“Authority comes from clarity, not prediction.”
Trade what’s confirmed — not what’s comfortable.