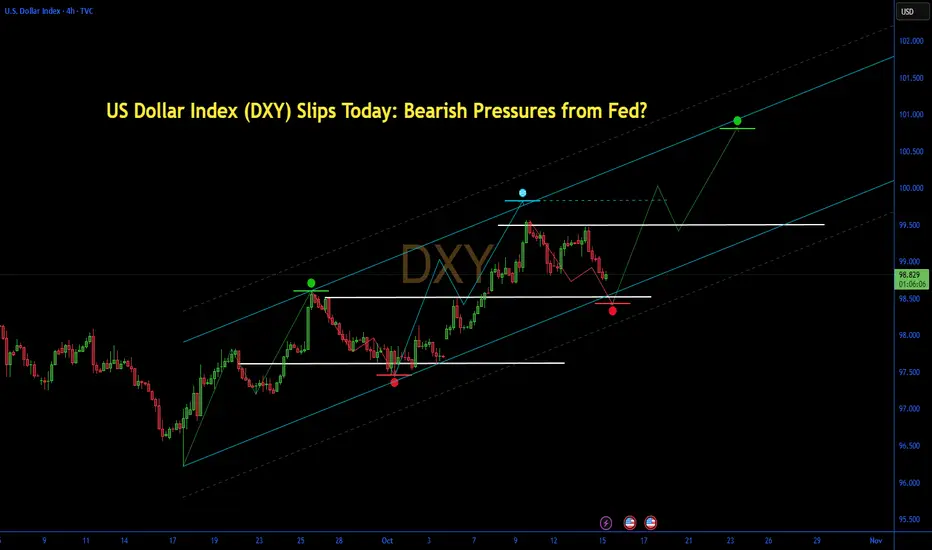
US Dollar Index (DXY) Slips Today: Bearish Pressures from Fed?The US Dollar Index (DXY) is down today, trading around 98.86 to 98.91, with a daily decline of approximately 0.15% to 0.21% or about 0.15 to 0.23 points.
This extends a pullback from recent highs near 99.57, marking the second consecutive session of losses as the index slips below 99.00.
Key pressures include Federal Reserve Chair Jerome Powell's dovish comments on a softening labor market, which have boosted expectations for another quarter-point rate cut this month, followed by more in December and potentially three additional reductions next year.
The ongoing U.S. government shutdown has delayed critical economic data releases, adding uncertainty and weighing on sentiment. Escalating U.S.-China trade tensions, such as threats of a cooking oil embargo and sanctions on related firms, are further undermining the dollar amid broader economic risks.
Despite a 2.31% monthly gain, the index remains down 4.52% over the past year, with forecasts pointing to further softening toward 98.43 by quarter-end and 96.54 in 12 months. Recent market chatter reinforces a bearish tilt, with the euro and yen gaining ground on related policy shifts abroad.
Trade ideas
USDX — rebound from demand zoneThe U.S. Dollar Index (USDX) is correcting within an upward channel. After testing the demand zone 98.20–98.80 on the 4H chart, a double bottom pattern appeared, signaling a potential bullish continuation.
Strong Smart Money and volume support remain near 98.50. As long as price stays above this area, the bullish scenario remains valid.
Targets for growth are located at 100.12 and 101.03 — key supply zones and previous highs.
The dollar is supported by solid U.S. macro data and expectations that the Federal Reserve will maintain higher rates for longer. This keeps the USD attractive and favors further recovery.
The bullish bias remains while price holds above 98.20. Only a confirmed breakdown below 97.50 would shift the structure to bearish.

15.10.25 Morning ForecastPairs on Watch -
FX:EURUSD
FX:GBPUSD
FX:AUDUSD
A short overview of the instruments I am looking at for today, multi-timeframe analysis down to what I will be looking at for an entry. Enjoy!

DXYDXY is very bullish and we just hit our first tp of the week anticipating for a second take profit as Cot report indicated that we still bullish for the week.

US DOLLAR IS FILLING IN DISCOUNT
Traders are pricing in a possible Fed rate cut, while fresh U.S.–China trade tension adds uncertainty to global flows.
Technically, the dollar sits in its weekly mid-range, printing a 5th inside bar behind last Thursday’s move — the classic order-loading phase.
Price is rotating between a key bullish low weakness zone at 98.30 and a bearish order block near 99.00 — a compression range where liquidity builds before expansion.
Structure remains bearish-biased but currently in bull-back mode.
Buyers are pressing into bearish volume nodes, leaving no clean swing setups — just a 50/50 zone where patience pays.
Expect one side of this range to be cleared before the next directional leg.
Until then, we stay tactical — cross-market focused, scalping for bread and butter while the market sets up its next move.


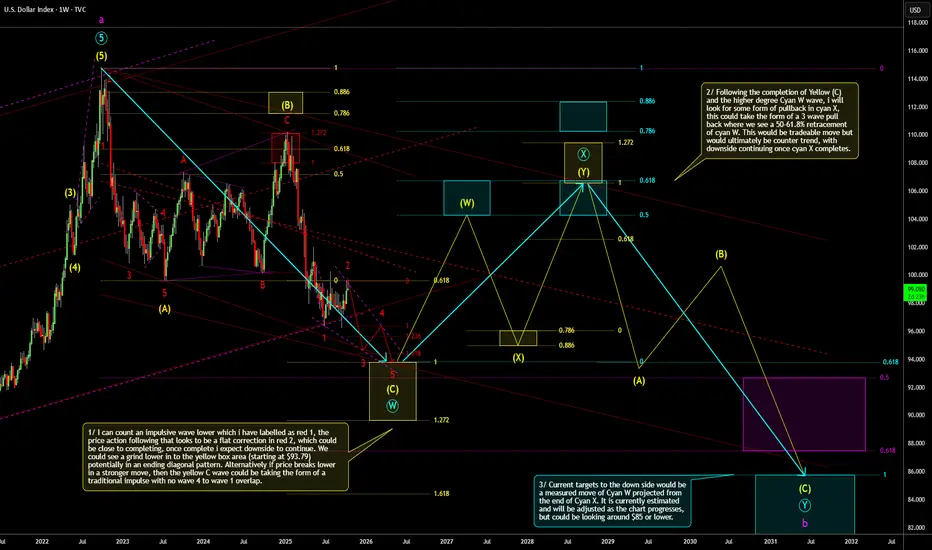
DXY Weekly Outlook (Count 3)This is a weekly timeframe outlook of the TVC:DXY . This is in alignment with my previously posted outlook which so far is playing out close to how I expected. This shows the wider view of what I think could be playing out. Still targeting the same yellow zone for a potential termination of the yellow (C) wave, after which we could see a counter trend consolidation. Current price action on the lower timeframe looks like it is forming a bearish flat correction which could be wave 2 in red. I'll look get a lower time frame update together, when time allows. More comments on the chart.
Resistance 100The dollar index has already covered more than half of the way to reach the 100 resistance, which it hasn't been able to approach for a long time, and it's highly likely that this will happen.

Dollar Index Wave 5 Incoming | Elliott Wave Analysis | DXY Break📊 In today’s Day 51 analysis, we break down the Dollar Index (DXY) using Elliott Wave theory.
Price completed Wave (iv) and is now preparing for a potential Wave (v) decline targeting the 94–95 zone.
This could bring short-term weakness to the USD and strength to EUR/USD.
🧩 Structure: Impulse → Wave (v) in progress
🎯 Target: 94.00 – 95.00
⚠️ Invalidation: Above 100.50


DXY: The Dollar’s Long Cycle — Heading Back to 9/11 Levels?The U.S. Dollar Index ( INDEX:DXY ) has navigated through decades of pivotal global shifts — from the end of the Gold Standard and the 1979 Oil Crisis to the Plaza Accord, the Global Financial Crisis, and now the post-pandemic monetary reset.
Each of these events marked critical macro turning points — and each time the dollar found new structural strength after major dislocations.
Now, DXY has consolidated above long-term resistance and appears to be building energy for another leg higher.
If history rhymes, we may see the dollar rally toward the levels reached during the aftermath of the September 11 attacks — a zone that historically represented both global uncertainty and U.S. capital inflows.
Bias: Bullish
Target Zone: 120–122
Timeframe: Multi-year (monthly chart perspective)

DXY index Near Resistance – Will Powell Trigger the Next Move?To kick off this week, let's take a quick look at the upcoming key indexes in the economic calendar before diving into the DXY analysis ( TVC:DXY ).
On Tuesday, we have Fed Chair Powell speaking, which could stir some excitement in the DXY index and ripple through correlated financial markets . Then, on Thursday , we have a bunch of key indexes like Core PPI, Core Retail Sales, PPI, and Unemployment Claims coming out. These releases could spark some volatility as well.
So, before we jump into the DXY analysis , I wanted to give you a heads-up on this week’s events
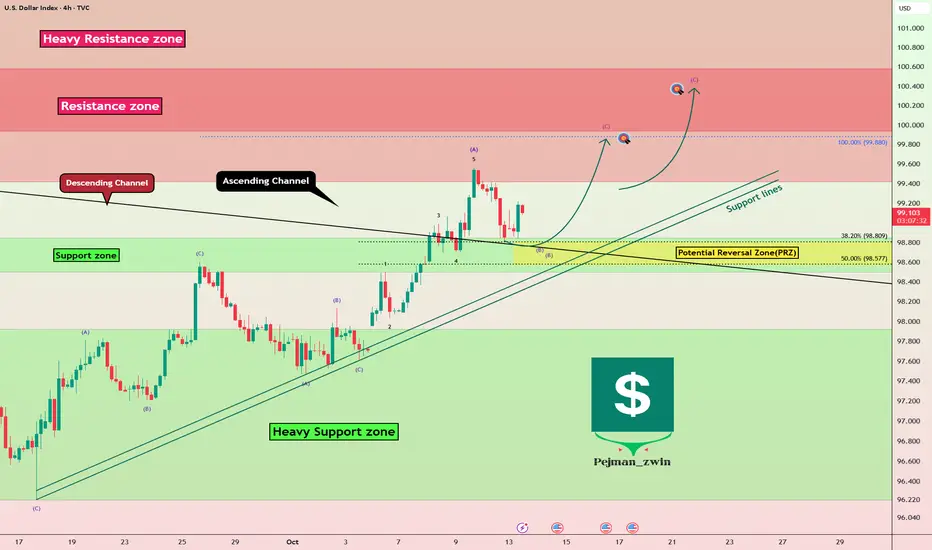
From a technical analysis standpoint , the DXY index is currently moving near a Heavy Resistance zone($101.30-$99.42) . At the same time, it has managed to break above the upper line of its descending channel and is now in a pullback phase to retest that broken line.
In terms of Elliott Wave theory , it seems that the DXY is completing wave B of a zigzag corrective(ABC/5-3-5) .
I expect that wave B will finish around the Potential Reversal Zone(PRZ) , and we might see the DXY index approach that Resistance zone($100.58-$99.93) before Powell’s speech tomorrow .
First Target: $99.770
Second Target: $100.06
Stop Loss(SL): $98.28
Please respect each other's ideas and express them politely if you agree or disagree.
U.S. Dollar Index Analysis (DXYUSD), 4-Hour Time Frame.
Be sure to follow the updated ideas.
Do not forget to put a Stop loss for your positions (For every position you want to open).
Please follow your strategy and updates; this is just my Idea, and I will gladly see your ideas in this post.
Please do not forget the ✅' like '✅ button 🙏😊 & Share it with your friends; thanks, and Trade safe.
Anticipating a Stronger DollarThe U.S. dollar ( TVC:DXY ) has been strengthening since the 2008 crisis, and I expect this trend to continue. I anticipate the Dollar Index (DXY) could reach a target of 120 by the next election or even sooner.

DXYHello... According the expectations of a two-step reduction in US interest rates based on CME, as well as global geopolitical tensions, the recent China-US dispute, and the continuation of the Russia war, the demand for safe assets, including the dollar, will increase. On the other hand, we are witnessing a decrease in the interest rate of ten-year US bonds, so I expect the value of the dollar to increase in the coming days... Technically, the dollar index has broken into an upward triangle and all of indicators indicate to an upward trend. Good luck.

DXY: Key Reversal or Dead Cat Bounce?The U.S. Dollar Index has found footing around the 0.618 Fibonacci retracement near 97.8, breaking a long downtrend. Its push toward the 99.35–100 range suggests a possible retest of a broken structure and alignment with the 50-day EMA. I noticed this move also aligns with short-term recovery signals.
Technical View (1D)
RSI climbing above 50 hints at renewed momentum.
MACD turning green shows early signs of follow-through.
Price is testing 100–101, a former support turned resistance.
If momentum holds, 102, 104, and 106 are the next resistance zones.
Support remains steady at 98, 97, and 95.8, which are shown as strong confluence points with Fibonacci structure.
Scenarios:
If DXY closes above 100.3, I’d expect continuation toward 102.4 or 104.2.
Failure to clear 100 followed by a drop under 98.5 could send it back toward 97.2 or even 95.8.
For now, my bias stays neutral to slightly bullish in the short term. A clean breakout above 100 would confirm a structural shift upward. None the less, I’m watching U.S. yields and upcoming CPI data closely and considering the factor that stronger inflation or a hawkish Fed tone could fuel the next DXY leg higher.
Thank you for your time and support, and as always please remember that this is always NFA and DYOFR, respectfully.
Bullish bounce off?US Dollar Index (DXY) has bounced off the pivot which is an overlap support that lines up with the 38.2% Fibonacci retracement and could rise to the 1st resistance.
Pivot: 98.77
1st Support: 98.41
1st Resistance: 100.14
Disclaimer:
The above opinions given constitute general market commentary, and do not constitute the opinion or advice of IC Markets or any form of personal or investment advice.
Any opinions, news, research, analyses, prices, other information, or links to third-party sites contained on this website are provided on an "as-is" basis, are intended only to be informative, is not an advice nor a recommendation, nor research, or a record of our trading prices, or an offer of, or solicitation for a transaction in any financial instrument and thus should not be treated as such. The information provided does not involve any specific investment objectives, financial situation and needs of any specific person who may receive it. Please be aware, that past performance is not a reliable indicator of future performance and/or results. Past Performance or Forward-looking scenarios based upon the reasonable beliefs of the third-party provider are not a guarantee of future performance. Actual results may differ materially from those anticipated in forward-looking or past performance statements. IC Markets makes no representation or warranty and assumes no liability as to the accuracy or completeness of the information provided, nor any loss arising from any investment based on a recommendation, forecast or any information supplied by any third-party.

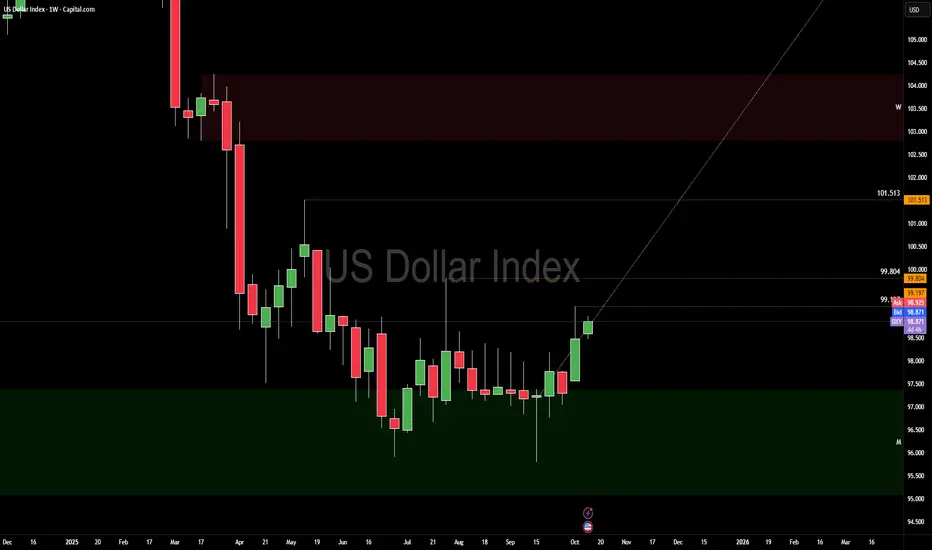
DOLLAR INDEX (DXY) — TECHNICALS FIRST, FUNDAMENTALS SECOND
Technically, the key level this week is 99.197. If DXY manages a bullish close above it, we should see a weekly structure shift higher. That opens the door for 99.8 → 101.5 as internal algorithmic targets. This isn’t wishful thinking — this is how systems behave when liquidity regimes flip.
Under that lens, any rejections beneath 99.197 or weak closes around it remain valid short setups — but only after structure gives the nod. Don’t force trades ahead of confirmation.
In the background, the dollar is reacting to trade-war rhetoric and political shifts. Trump’s 100 % tariffs on Chinese imports raised volatility, but he later softened his tone, suggesting more cooperation than conflict. Its complet currency war.
Meanwhile, some analysts argue a bullish case for the dollar remains due to relative U.S. productivity strength and higher real yields.
These narratives give motive, but do not override price structure.
So from CORE5’s frame: structure leads, news lags. Let clean price confirmation in the 99.197 zone tell you whether to lean into long bias or respect the risk of failure. Eyes locked.
DXY: Strong Growth Ahead! Long!
My dear friends,
Today we will analyse DXY together☺️
The recent price action suggests a shift in mid-term momentum. A break above the current local range around 98.869 will confirm the new direction upwards with the target being the next key level of 98.977 and a reconvened placement of a stop-loss beyond the range.
❤️Sending you lots of Love and Hugs❤️

DXY: 100 on the Horizon as Trade Tensions Lift the DollarThe U.S. Dollar Index (DXY) is showing renewed bullish momentum as both technicals and fundamentals align to support further upside.
Technically, the chart reveals a clear inverse head-and-shoulders pattern, with a confirmed neckline breakout above 98.50–98.70. This zone now acts as strong support, reinforced by the 20- and 50-day moving averages trending upward. Price remains well within its ascending channel, suggesting bullish structure remains intact.
As long as DXY holds above 98.50, the path of least resistance points higher, with a medium-term target around 99.80–100.50 — a major resistance zone and psychological round number.
On the fundamental side, escalating U.S.–China trade tensions — including Trump’s renewed 100% tariff threats and China’s warning of retaliation — have reignited safe-haven demand for the dollar. Meanwhile, weakness in the euro and yen adds further tailwinds to DXY’s strength.
The combination of a bullish chart setup and a flight-to-safety narrative suggests 100 could be on the cards if the index continues to respect support and maintain momentum above the moving averages.

DXYU.S Dollar Index
- Bullish Channel as an corrective pattern in Short Time Frame
- Break of Structure
- Completed " 12345 " Impulsive Waves and " A " Corrective Waves
- RSI - Divergence
- Order Block

DXY Analysis – Bullish Structure Still IntactIn my latest DXY analysis, I mentioned that the 100.00 level remains the next key target for the U.S. Dollar Index.
After an initial push higher to 99.55, the index faced some selling pressure and is now trading slightly below 99.00.
However, the constructive bullish structure remains intact as long as price holds above the 99.60 support zone.
________________________________________
1. Technical Context
• The recent pullback looks more like a healthy correction rather than a trend reversal.
• The higher-lows pattern remains valid, keeping the bullish momentum alive.
• The 99.60 area now acts as a key pivot zone — holding above it favors a renewed push toward 100.00.
________________________________________
2. Trading Implications
Given this setup, selling rallies in EUR/USD and GBP/USD remains the preferred strategy, as both pairs are likely to face renewed dollar strength once DXY resumes its upward leg.
________________________________________
In short:
The Dollar Index remains bullish.
As long as 99.60 holds, the path of least resistance stays upward — and 100 remains on the radar. 🚀

Dxy index on high time frame
"Focusing on the DXY index on the high time frame, a downward trend is observed on the daily time frame. Utilizing the liquidity concept, the price has swept liquidity and appears poised for a decline. The first potential target could be around 97.5."
If you have more insights to share or need further assistance, feel free to let me know!

DXY Trade Plan 13/10/2025Dear Traders,
💵 U.S. Dollar Index (DXY) Analysis – 16H Timeframe
📅 October 13, 2025
The U.S. Dollar Index (DXY) remains in a mid-term consolidation phase, but recent bullish momentum suggests that a new upward leg may soon begin.
After testing resistance near 99.10, DXY is showing signs of a short-term pullback. The 97.50–97.80 area (highlighted in blue) stands out as a strong demand/support zone, aligning with previous structure and horizontal support levels.
If the index manages to hold above this area, a bullish reversal from this zone could trigger a continuation move toward the 102.00–102.10 resistance level — the next major upside target.
This scenario would align with a potential recovery in USD strength across major pairs, particularly if macro data supports tightening or a risk-off sentiment in markets.
📊 Summary:
Overall Trend: Bullish bias after correction
Key Support Zone: 97.50 – 97.80
Key Resistance Target: 102.00 – 102.10
Scenario: Waiting for a pullback into 97.5–97.8 zone for a possible long continuation toward 102
Regards,
Alireza!
