Bullish bounce off key support?The US Dollar Index (DXY) is declining toward the pivot level and may rebound toward the 1st resistance.
Pivot: 98.67
1st Support: 97.85
1st Resistance: 100.07
Disclaimer:
The opinions given above constitute general market commentary and do not constitute the opinion or advice of IC Markets or any form of personal or investment advice.
Any opinions, news, research, analyses, prices, other information, or links to third-party sites contained on this website are provided on an "as-is" basis, are intended to be informative only, and are not advice, a recommendation, research, a record of our trading prices, an offer of, or solicitation for, a transaction in any financial instrument and thus should not be treated as such. The information provided does not involve any specific investment objectives, financial situation, or needs of any specific person who may receive it. Please be aware that past performance is not a reliable indicator of future performance and/or results. Past performance or forward-looking scenarios based upon the reasonable beliefs of the third-party provider are not a guarantee of future performance. Actual results may differ materially from those anticipated in forward-looking or past performance statements. IC Markets makes no representation or warranty and assumes no liability as to the accuracy or completeness of the information provided, nor any loss arising from any investment based on a recommendation, forecast, or any information supplied by any third party.
Trade ideas

Bullish bounce off?US Dollar Index (DXY) is reacting off the pivot and could bounce to the 1st resistance.
Pivot: 99.08
1st Support: 98.08
1st Resistance: 99.80
Disclaimer:
The opinions given above constitute general market commentary and do not constitute the opinion or advice of IC Markets or any form of personal or investment advice.
Any opinions, news, research, analyses, prices, other information, or links to third-party sites contained on this website are provided on an "as-is" basis, are intended to be informative only, and are not advice, a recommendation, research, a record of our trading prices, an offer of, or solicitation for, a transaction in any financial instrument and thus should not be treated as such. The information provided does not involve any specific investment objectives, financial situation, or needs of any specific person who may receive it. Please be aware that past performance is not a reliable indicator of future performance and/or results. Past performance or forward-looking scenarios based upon the reasonable beliefs of the third-party provider are not a guarantee of future performance. Actual results may differ materially from those anticipated in forward-looking or past performance statements. IC Markets makes no representation or warranty and assumes no liability as to the accuracy or completeness of the information provided, nor any loss arising from any investment based on a recommendation, forecast, or any information supplied by any third party.

DXY Structure Remans Weak, short itDXY broader structure remans weak and best time to short , sell on rse

SHORTING OPPORTUNITYMarket moved towards the WH&L zone which is alongside previous SH&L. The DXY is also shows a change in direction as Health Bullish Candle started being established.

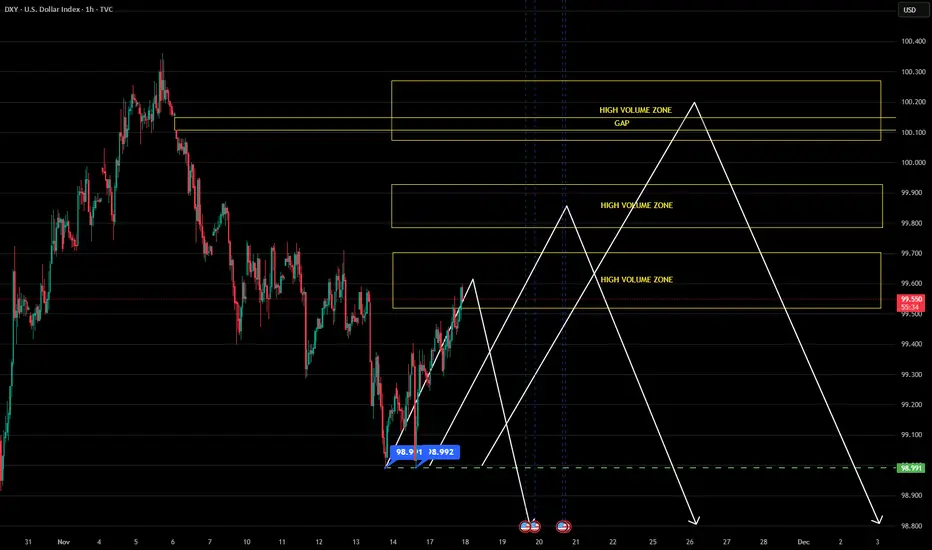
Trading Idea: DXY — Potential Reversal PointsTrading Idea: DXY — Potential Reversal Points
Technical Overview
The Dollar Index has formed a significant resistance level, from which price has moved toward the first high-volume zone. The chart highlights three potential areas of volume concentration, each capable of acting as a reaction point.
Key Zones
Zone 1 — The nearest high-volume area, serving as the first potential support level.
Zone 2 — An intermediate volume accumulation area.
Zone 3 — The most compelling zone, featuring an unfilled gap. The presence of this gap creates an additional price magnet, as markets tend to fill price gaps over time.
Trading Scenario
The primary hypothesis anticipates price movement toward the third high-volume zone with the objective of filling the gap. This area is expected to produce the strongest reaction and potential reversal.
However, monitoring price behavior in the first two zones remains essential. A clear bounce with confirmation could indicate an earlier conclusion to the downward movement.
Risk Management
Wait for price reaction in each designated zone and seek confirming signals before entering a position. While the unfilled gap in the third zone increases the probability of price reaching that level, it does not guarantee a reversal.
DXY FRGNT Daily Forecast -Q4 | W47| D17 | Y25 |📅 Q4 | W47| D17 | Y25 |
📊 DXY FRGNT Daily Forecast
🔍 Analysis Approach:
I’m applying Smart Money Concepts, focusing on:
Identifying Points of Interest on the Higher Time Frames (HTFs) 🕰️
Using those POIs to define a clear trading range 📐
Refining those zones on Lower Time Frames (LTFs) 🔎
Waiting for a Break of Structure (BoS) for confirmation ✅
This method allows me to stay precise, disciplined, and aligned with the market narrative, rather than chasing price.
💡 My Motto:
"Capital management, discipline, and consistency in your trading edge."
A positive risk-to-reward ratio, paired with a high win rate, is the backbone of any solid trading plan 📈🔐
⚠️ Losses?
They’re part of the mathematical game of trading 🎲
They don’t define you — they’re necessary, they happen, and we move forward 📊➡️
🙏 I appreciate you taking the time to review my Daily Forecast.
Stay sharp, stay consistent, and protect your capital
— FRNGT 🚀
TVC:DXY

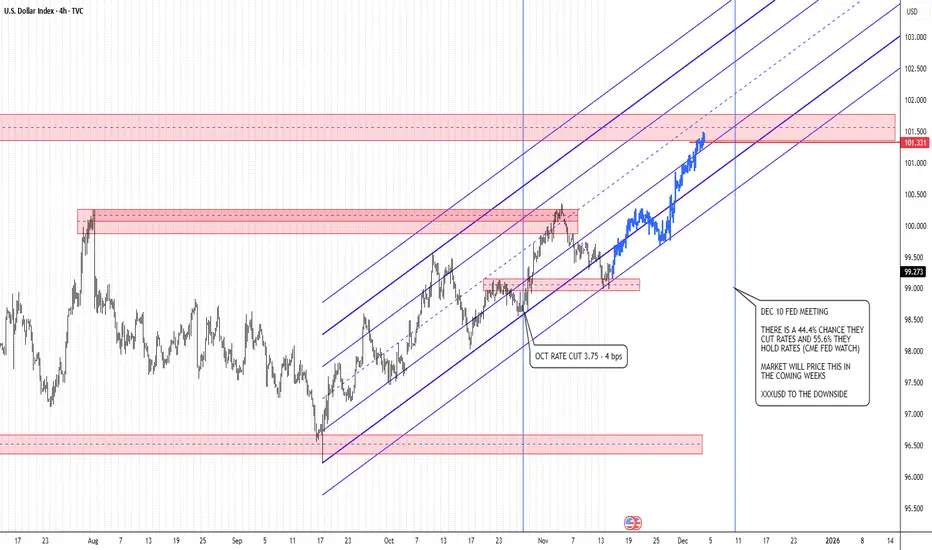
Dollar Index: Bullish Structure + Fed Expectations AligningDXY remains inside a well-defined ascending channel and is currently building structure above mid-channel support. With the Dec 10 Fed meeting approaching, the macro narrative may soon favor additional USD strength.
According to CME FedWatch, markets are pricing:
55.6% probability the Fed holds rates
44.4% probability of a cut
A hold keeps U.S. yields supported and has historically provided short-term upside pressure on the Dollar Index.
Technical Outlook
Price is respecting the ascending channel
Current pullback sits on a key demand zone + channel support
Higher-timeframe supply is above, but continuation structure is intact
The October rate cut reaction formed a clean bullish trend leg — this could be the next impulsive wave
My Bias
I’m anticipating USD strength into — and potentially after — the December Fed meeting, especially if the Fed reiterates cautious, data-dependent language rather than confirming more cuts.
Bullish Thesis:
A Fed hold + risk-off repricing → upside continuation on DXY
Key Levels to Watch:
🔼 100.80
🔼 101.50 (major supply break target)
🔼 102.20+ if momentum accelerates
Invalidation:
A clean break below channel support + demand zone.
U.S. Dollar Index Gearing Up for a Powerful Upswing!💵 DXY — U.S. Dollar Index | Profit Pathway Setup (Swing Trade)
🧭 Bias: Bullish (Confirmed Setup)
📈 Market Type: Index (USD Strength Focus)
🧠 Strategy Style: Layered Limit Entry with SMA Pullback + Triangular MA Breakout
🎯 Trade Plan Breakdown
📊 Setup Insight:
The DXY (U.S. Dollar Index) has confirmed a bullish momentum as price reclaims above the Simple Moving Average (SMA) and breaks through the Triangular Moving Average (TMA) resistance zone — signaling potential continuation strength for the dollar.
📥 Entry Zone (Layering Strategy):
My “Thief Strategy” approach uses multiple limit layers for precision stacking entries:
Buy Limit Layers: 99.00 → 99.50 → 100.00
(You can extend or adjust layers based on your own conviction and risk appetite.)
🛑 Stop Loss:
My Thief SL sits near the recent lower low wick for structure protection → 98.50
💬 Note: Dear Ladies & Gentlemen (Thief OG’s) — I’m not recommending my exact SL.
You manage your own risk — make money, take money, your call.
🎯 Target (Take Profit):
The moving average line is acting like a police barricade — strong resistance area, potential overbought trap zone. Be smart and escape with profits near 102.00.
💬 Note: Dear Ladies & Gentlemen (Thief OG’s) — TP is flexible.
Lock profits where you’re satisfied; don’t let greed arrest your gains. 🚓💰
🌐 Correlated Market Watch
Keep an eye on these correlated pairs & assets for confirmation signals or divergence clues:
💶 $EUR/USD → Inverse correlation (DXY up → EUR/USD down)
$XAU/USD (Gold) → Often moves opposite to USD strength
💷 FX:GBPUSD → Mirrors EUR/USD volatility when DXY surges
BITSTAMP:BTCUSD → Weakens when DXY strengthens due to liquidity shifts
💹 FX:USDJPY → Supports bullish dollar narrative if yield spreads widen
These pairs can help you validate sentiment and timing entries better — especially during London & New York sessions when DXY liquidity peaks.
🧩 Technical Key Points
✅ SMA pullback confirms bullish continuation zone
🔺 Triangular Moving Average breakout shows renewed strength
🧱 99.00–100.00 acts as accumulation floor
🚨 102.00 remains resistance barricade zone (potential trap)
⏰ Best observed during London/NY overlap for volatility cues
✨ “If you find value in my analysis, a 👍 and 🚀 boost is much appreciated — it helps me share more setups with the community!”
⚠️ Disclaimer: This is a Thief-style trading strategy — just for fun and education. Not financial advice. Trade wisely and manage risk like a pro.
#DXY #USDollarIndex #ForexTrading #SwingTrade #TechnicalAnalysis #TradingIdeas #PriceAction #SMAStrategy #MovingAverages #CurrencyTrading #DollarStrength #ForexSignals #TradingStrategy #MarketAnalysis #ChartPatterns #BullishSetup #RiskManagement #ForexCommunity #TradingView #DXYAnalysis

DXY : Potential Long Entries , Targetting 100.360I am now scanning for potential entry opportunities. This post builds on the previous DXY Posts :
1. DXY 30 SEPTEMBER 2025 Post
2. USD Retracement to 99.5
3. USD Longs to 100.360

DXY — Sunday War MapThe U.S. government has reopened after a 43-day shutdown, but the gap in economic data remains.
Several key datasets were not collected during the closure, and the missing information cannot be reconstructed.
As a result, the Dollar is now trading on partial visibility rather than complete fundamentals.
Macro Overview
The most recent complete inflation report is September CPI at 3.0%, with core inflation also at 3.0%.
Earlier in the month, the U.S. Dollar Index (DXY) briefly moved above 100.
It then retreated toward 99 after consumer sentiment fell to a three-year low.
Last week’s muted behavior reflects uncertainty, not a structural shift.
When information is missing, liquidity becomes cautious and price action compresses.
Key Events This Week (Nov 17–21)
FOMC Minutes — Wednesday, Nov. 20
This release provides the first reliable view into Federal Reserve discussions since the shutdown.
Markets will look for whether policymakers supported multiple rate cuts or expressed hesitation.
Consumer Sentiment — Friday, Nov. 22
Last month saw a more than 30% year-over-year decline.
Another weak reading will influence Dollar positioning.
Delayed Data Returns
Housing, industrial production, and jobless claims will re-appear gradually this week.
These incomplete releases still matter ahead of the December 9–10 Federal Reserve meeting.
The Dollar is currently driven more by data absence than by clear economic direction.
MSM — Market Structure Mapping
DXY remains inside a major daily bullish range:
Range Low: 97.672
Range High: 99.985
Price sits near the 50% geometric midpoint.
Last week closed at 98.776, maintaining structural balance and preserving the broader bullish framework.
VFA — Volume Flow Analytics
Price continues to hold on the 98.725 bullish volume node, a level typically used for quiet accumulation.
This suggests ongoing absorption of buy-side orders at discount levels ahead of potential volatility expansion.
OFD — Order Flow Dynamics
Liquidity remains concentrated around two notable participation zones:
Aggressive buyers: 98.243
Aggressive sellers: 99.225
These zones are often retested early in the week to assess participation or clear weak inventory before direction establishes.
PEM — Precision Execution Modeling
Mid-range conditions are typically used to clear stops on both sides before intent forms.
Execution criteria for the week:
Respect higher-timeframe direction
Wait for confirmation
Avoid mid-range noise
Act only when structure, flow, and behavior align
High-quality setups generally appear after liquidity sweeps, not before.
Psychological Frame
The major risk this week is acting on incomplete data.
The shutdown left a statistical gap that has not yet been resolved.
Professionals avoid committing capital until visibility improves.
The appropriate approach for the week is simple: observe first, act later.
— CORE5DAN
Institutional Logic. Modern Technology. Real Freedom.

DXY Is Very Bullish! Buy!
Here is our detailed technical review for DXY.
Time Frame: 1D
Current Trend: Bullish
Sentiment: Oversold (based on 7-period RSI)
Forecast: Bullish
The market is on a crucial zone of demand 99.274.
The oversold market condition in a combination with key structure gives us a relatively strong bullish signal with goal 101.270 level.
P.S
Overbought describes a period of time where there has been a significant and consistent upward move in price over a period of time without much pullback.
Like and subscribe and comment my ideas if you enjoy them!

USD Bullish A positive trend for the USD is expected, due to good economic data or interesting political news.

DXY Weekly Outlook: Key Imbalance Zones and Scenarios for the Last week, the DXY price reached the weekly FVG, tested its lower boundaries, and delivered the expected reaction. Now the chart shows new variables that allow us to forecast potential movement for the upcoming week.
Let’s examine the daily timeframe. The price has formed a bearish FVG. There are no other potential resistance zones on the daily chart, and the overall movement has been tight and directional, which is logical after hitting a strong higher-timeframe level. At the moment, the only structural reference on the daily chart is this newly formed FVG, and we should expect the price to operate within its boundaries.
One possible development is that the price respects the reaction from the weekly FVG and continues downward toward the next weekly support level. Below, there is also an unfilled gap that may attract price and serve as a local point B.
Another possible development is that the price breaks through the bearish daily FVG, forms a higher close, and continues moving toward the global point B we marked last week. This would signal that the strong overall trend remains intact and that buyers still dominate on the higher timeframes.
For now, the key focus is on how the price behaves inside the daily FVG. Whether this imbalance zone holds or gets broken will determine the further structure. We monitor reactions on the boundaries and wait for confirming volume to validate the next direction.

DXY FRGNT Daily Forecast - Q4 | W47| D18 | Y25 |📅 Q4 | W47| D18 | Y25 |
📊 DXY FRGNT Daily Forecast
🔍 Analysis Approach:
I’m applying Smart Money Concepts, focusing on:
Identifying Points of Interest on the Higher Time Frames (HTFs) 🕰️
Using those POIs to define a clear trading range 📐
Refining those zones on Lower Time Frames (LTFs) 🔎
Waiting for a Break of Structure (BoS) for confirmation ✅
This method allows me to stay precise, disciplined, and aligned with the market narrative, rather than chasing price.
💡 My Motto:
"Capital management, discipline, and consistency in your trading edge."
A positive risk-to-reward ratio, paired with a high win rate, is the backbone of any solid trading plan 📈🔐
⚠️ Losses?
They’re part of the mathematical game of trading 🎲
They don’t define you — they’re necessary, they happen, and we move forward 📊➡️
🙏 I appreciate you taking the time to review my Daily Forecast.
Stay sharp, stay consistent, and protect your capital
— FRNGT 🚀
TVC:DXY

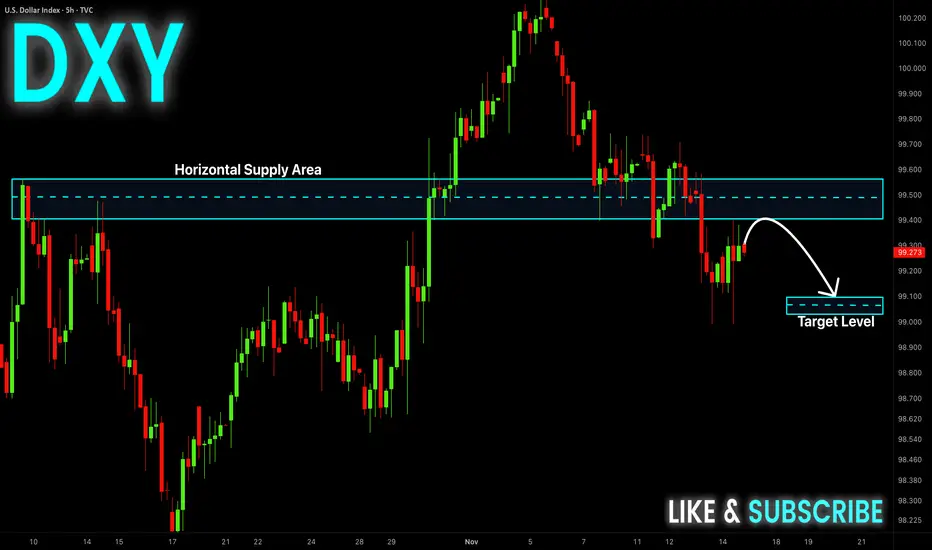
DXY Will Fall! Sell!
Hello,Traders!
DXY price taps into a clean supply block, creating a shift in order flow as liquidity above the highs gets swept. A corrective push toward the next demand pocket is likely. Time Frame 5H.
Sell!
Comment and subscribe to help us grow!
Check out other forecasts below too!
Disclosure: I am part of Trade Nation's Influencer program and receive a monthly fee for using their TradingView charts in my analysis.
DXY Is Entering a Decision Zone — The Next Move Starts Here.DXY | Neutral Bias | 4H Frame
CORE5 View: Price has filled its inefficiencies and now meets the weekly balance head-on. This is the decision point for the next impulse.
Fundamental Context
Tomorrow is the real driver: PPI + jobless claims, with CPI right behind it.
These three data points set the short-term path for the dollar’s yield expectations.
Markets are holding steady into the releases — no rush, no conviction.
This is a waiting zone until numbers show direction.
Market Structure Context
Price has pushed into the discount side of the 4H range, tapping the same zone that has triggered rotations before.
All single prints beneath have now been filled, removing imbalances.
Now the structure is pressing the weekly balance at 98.766, a level that normally slows momentum and forces the market to show its hand.
This is where structure decides between rotation or continuation.
MSM — Market Structure Mapping
The 4H structure carries a bearish tone, but it is pushing straight into weekly balance, which often neutralizes momentum.
Nothing is broken, but nothing is confirmed.
This is where professionals wait for liquidity to choose dominance.
DGM — Dynamic Geometry Modeling
The downward leg into discount matches the prior leg in size and rhythm.
Symmetry is complete.
Geometrically, this is a natural location where rotation can start — but only if liquidity agrees.
VFA — Volume Flow Analytics
Anchored volume sits at 98.725, only a few points below current price.
This is a reliable decision level:
• Rotation often begins here when volume defends.
• If price accepts below this node, bearish continuation opens quickly.
It’s a participation pivot — the market chooses, not us.
OFD — Order Flow Dynamics
Order flow still favors the bearish side.
No meaningful attempt higher, no failed push, no shift in intent.
Buyers are quiet; sellers are steady.
Patience here protects capital.
PEM — Precision Execution Modeling
We’re sitting mid-range into end-of-day liquidity with clear pools both above and below.
In these conditions, price often drifts, cleans both sides, and waits for tomorrow’s data.
For cross-market positioning, holding off until USD bias confirms is the professional move.
🧠 CORE5 Rule of the Day
“Context leads. Direction follows. Structure only works when you let it speak first.”

DXY firmed between the hawkish Fed and Waller call of cuts.
The dollar strengthened despite the contrast between the Fed’s overall hawkish tone and Waller’s support for rate cuts.
Cleveland Fed President Hammack noted that policy must remain somewhat restrictive to bring inflation back to target, while St. Louis Fed President Musalem also emphasized that any policy easing should proceed cautiously.
In contrast, Fed Governor Waller said he is not concerned about a renewed acceleration in inflation and argued that several months of labor-market softness justify additional rate cuts. He added that tariffs are unlikely to have a lasting impact on inflation and that restrictive policy is increasingly weighing on the economy, particularly on lower- and middle-income households.
DXY briefly tested the support at 99.30 before climbing above both EMAs. The converging EMAs indicate a potential shift toward a bullish trend.
If DXY closes above both EMAs, the index may advance toward 99.80.
Conversely, if DXY breaks below both EMAs and 99.30, the index could retreat toward the next support at 99.00.

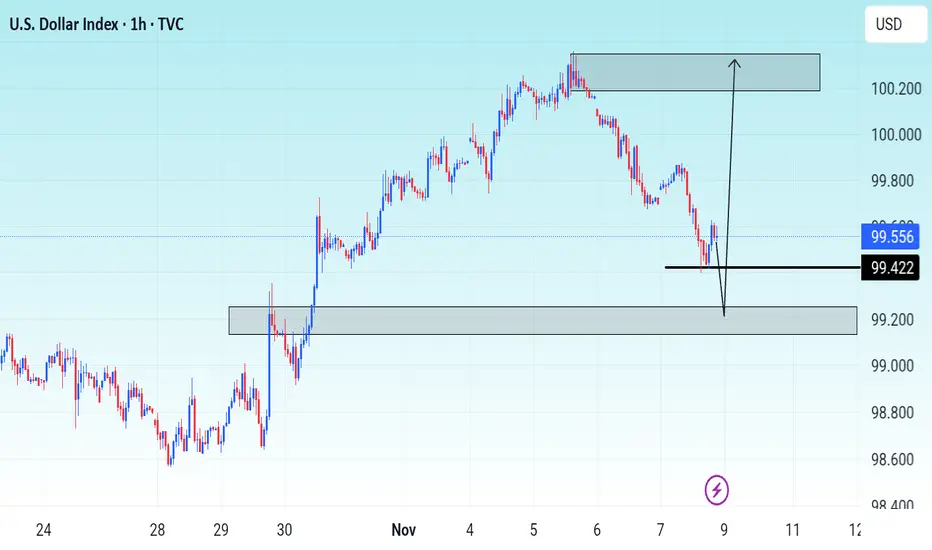
DXY Will Go Lower! Short!
Please, check our technical outlook for DXY.
Time Frame: 5h
Current Trend: Bearish
Sentiment: Overbought (based on 7-period RSI)
Forecast: Bearish
The market is approaching a significant resistance area 99.554.
Due to the fact that we see a positive bearish reaction from the underlined area, I strongly believe that sellers will manage to push the price all the way down to 99.097 level.
P.S
We determine oversold/overbought condition with RSI indicator.
When it drops below 30 - the market is considered to be oversold.
When it bounces above 70 - the market is considered to be overbought.
Like and subscribe and comment my ideas if you enjoy them!

DXY Near Key Liquidity Pools — Which One Gets Taken First?NY Session Update
The Dollar opens New York trading holding firm in mid-range, rotating around the 0.50 region near 98.828.
The session begins with a steady structure, and flow remains shaped primarily by the broader macro tone rather than intraday volatility.
The Dollar spent the week under steady pressure as investors reassessed U.S. growth momentum. Several datasets were delayed, and the backlog created uncertainty around how strong the underlying economy actually is. The tone from the Federal Reserve shifted subtly toward patience — less focus on tightening, more on maintaining optionality.
At the same time, global risk appetite improved. Equities held firm, and capital rotated into other major currencies, reducing the Dollar’s safe-haven advantage. That combination — softer growth signals, stabilizing risk, and non-committal policy language — kept the Dollar pinned in mid-range structure.
Looking ahead, the next meaningful movement will likely come from surprise prints rather than scheduled events. Employment data, inflation momentum, and backlog clears remain the pressure points. Until those catalysts hit, the Dollar stays in observation mode: stable, compressed, and sensitive to macro tone rather than intraday noise.
NEXT WEEK’S U.S. DOLLAR DRIVERS
Inflation releases – Headline and core CPI/PPI data will test momentum in pricing pressure.
Employment & labour data – Wage momentum, participation and unemployment trends remain under the microscope.
Policy tone from the Federal Reserve – Speeches and any shifts in guidance around timing will carry enhanced weight.
Global risk-sentiment flow – Equity performance and risk-asset appetite at the NY open will continue to influence USD positioning.
Data backlog clarity – Delayed prints and residual effects from previous disruptions may create surprises in either direction, affecting Dollar flow.
CORE5 Pillar Overview
MSM — Market Structure Mapping:
Price remains inside weekly balance, with activity clustered around 98.776 — consistent with mid-range conditions.
VFA — Volume Flow Analytics:
The 4H anchored volume node at 98.725 continues to mark the area of most participation.
OFD — Order Flow Dynamics:
Recent activity shows hesitation to move deeper into the lower inefficiency zones.
PEM — Precision Execution Modeling:
Liquidity context remains defined by areas near 98.30 and 99.30, with the broader range limits at 97.672 and 99.985.
This provides the wider map for understanding structural rotation.
CORE5 Rule of the Day
Mid-range moves feed ego, not equity.
—
— CORE5DAN
Institutional Logic. Modern Technology. Real Freedom.

USD Rejected at Resistance- Key Test Ahead for DXYThe US Dollar reversed sharply off pivotal resistance into the November open with DXY poised to mark a second consecutive weekly loss. The focus is now on whether the pullback marks the start of a larger correction or a brief pause within the broader uptrend.
The Dollar has now fallen more than 1.2% off the monthly high with the decline now breaking below the September uptrend. A simple channel extending off the monthly high is guiding this decline with initial support now eyed at 99.68/78- a region defined by the August high-day close, the May low and the 38.2% retracement. Look for a larger reaction there IF reached with a break / close below needed to suggest a more significant high is in place and a larger trend reversal is underway. Subsequent support rests at 98.03 and the 2018 high / 61.8% retracement at 97.71/80.
Weekly open resistance is eyed at 99.62 and is backed closely by the November open at 99.75. A break / close above this threshold would threaten resumption of the September uptrend with key resistance steady at 100.15/35- a region defined by the 2024 low, the 200-day moving average and the 2024 low close. Strength beyond this pivot zone is needed to fuel the next major leg of the US Dollar advance. The next major technical consideration is eyed at the 1.618% extension of the September advance at 101.32.
Bottom line: DXY reversed from key resistance into the monthly open with a break below then September upslope threatening a deeper setback- be on the lookout for a possible exhaustion low in the days ahead. From a trading standpoint, losses would need to be limited to 98.68 IF this is a simple correction with a break above 100.35 needed to mark uptrend resumption.
-MB

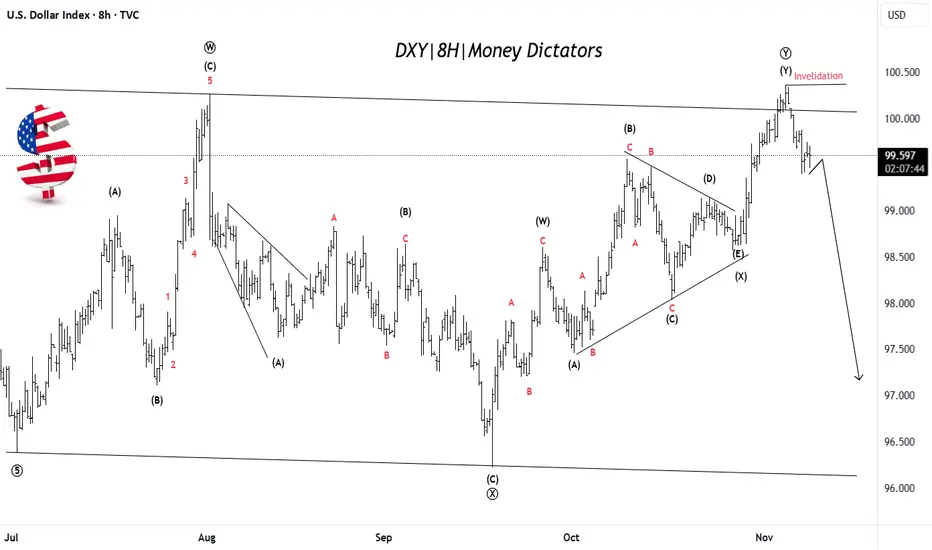
US Dollar Weakness Likely After Final Push UpDXY has completed a complex corrective W–X–Y pattern, with the final leg (Y) recently topping near the 100.50 zone. Price has failed to break above the invalidation level, suggesting the uptrend is losing strength. This signals that the dollar may have finished its corrective phase and could now start a fresh bearish wave targeting lower zones near 97–98. The overall structure indicates that momentum is shifting from bullish to bearish. In simple terms: rally is likely over → downside move toward new lows expected next.
Stay tuned!
@Money_Dictators
Thank you :)
US Dollar: Buy The Rally!Welcome back to the Weekly Forex Forecast for the week of Nov. 10-14th
In this video, we will analyze the following FX market: USD Dollar
The USD is in a pullback... that I believe is ending. Buying is the best bet! Once price gives the signature of a market shift from bearish to bullish, buys are valid!
Enjoy!
May profits be upon you.
Leave any questions or comments in the comment section.
I appreciate any feedback from my viewers!
Disclaimer:
I do not provide personal investment advice and I am not a qualified licensed investment advisor.
All information found here, including any ideas, opinions, views, predictions, forecasts, commentaries, suggestions, expressed or implied herein, are for informational, entertainment or educational purposes only and should not be construed as personal investment advice. While the information provided is believed to be accurate, it may include errors or inaccuracies.
I will not and cannot be held liable for any actions you take as a result of anything you read here.
Conduct your own due diligence, or consult a licensed financial advisor or broker before making any and all investment decisions. Any investments, trades, speculations, or decisions made on the basis of any information found on this channel, expressed or implied herein, are committed at your own risk, financial or otherwise.

USD Dollar index is higher holding up. TVC:DXY price overall is bullish and looks before it continues with the bullish machine movement it's most likely to grab liquidity first then it continues wit the buys either way anyway can happen.