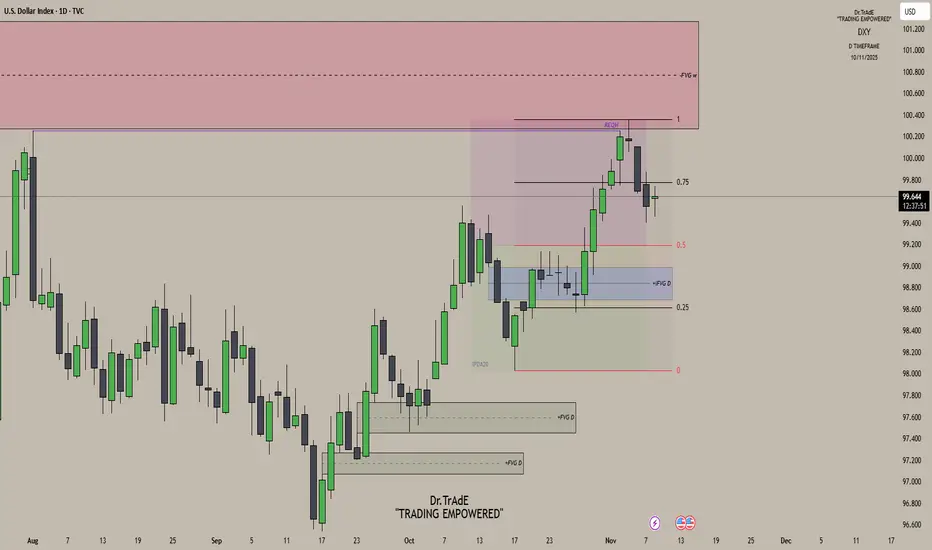
DXY Daily AnalysisLast Week’s Review:
Monday: Bullish delivery as price continued higher.
Tuesday: Price maintained bullish momentum but failed to take out the previous high, leaving equal highs — liquidity resting above.
Wednesday: That liquidity was swept as price reached into the weekly fair value gap, completing delivery to the premium array and initiating bearish distribution.
Current Outlook:
On the daily chart, we’re still trading deep inside premium, and price is showing clear signs of exhaustion after that delivery into the weekly FVG. With bearish distribution now in play, my bias remains bearish. Any short-term push back into the 0.75 quadrant, I’ll treat as a retracement — a chance for price to reprice some lower-timeframe inefficiencies before the next leg lower. On the 4H chart, I’ll be watching for price to trade back into short-term FVGs or inefficiencies that align with this overall bearish narrative.
Trade ideas
DXY Bullish Continuation Risks Challenge the 100.20-ResistanceOn the daily chart, the DXY’s rebound from its 17-year support near 96 resembles an inverted head-and-shoulders breakout, currently testing the 100.20 resistance.
A confirmed close above this level would complete the pattern, targeting the 101.80 and 103.40 levels — moves that could potentially pressure GBPUSD toward 1.2940 and 1.2740, as detailed in the following charts.
From the downside, if the DXY retreats below 99.40, the selling pressure on major currencies may ease. In that scenario, the DXY is expected to retest the neckline and validate the inverted head-and-shoulders formation, with the trendline connecting consecutive lower highs from May to August, between 98.50 and 98.00.
- Razan Hilal, CMT

DXY, US DOLAAR UPDATEDXY — Structure & Flow Brief
DXY | Bullish Bias | Daily Frame | CORE5 View:
Dollar remains in short-term pullback mode inside a broader bullish structure, holding between 97.67 and 99.98 while traders watch this week’s macro lineup.
The key data hits Thursday and Friday — Jobless Claims, followed by PPI and Retail Sales.
Those reports will show if the economy is cooling or still running hot, shaping the next leg for the dollar.
Yields stay firm, keeping the tone quietly bullish, but most desks are flat until the data drops.
MSM — Market Structure Mapping (The Framework)
We’re trading inside a daily bearish candle, sliding into the imbalance near 98.964.
A close back above that cap would keep the broader trend context bullish.
If price doesn’t reclaim that level, the structure favors a move toward lower zones before the next leg.
VFA — Volume Flow Analytics (The Participation Map)
A main POC sits at 98.562, right inside the discount area of the range.
That’s a heavy-volume zone — price action can drive into it if downside momentum develops.
On news days, markets often run through these areas to clear liquidity before direction returns.
OFD — Order Flow Dynamics (The Behavior)
Price is currently parked inside an order-flow imbalance, filling single-print orders around 98.964.
It’s an absorption phase — volume is active, but larger players are keeping it balanced until catalysts arrive.
We’re seeing divergences across EURUSD, gold, and yields heading into Friday’s PPI and Retail Sales.
When the data hits, volatility often increases, and these imbalance zones tend to resolve.
PEM — Precision Execution Modeling (The Engagement Rules)
Trading the middle of the range is a low-edge play unless you’re scalping.
We’ve already had strong moves today, so there’s no reason to force new triggers here.
Within the CORE5 framework, we avoid engaging at the 50/50 range midpoint and wait for direction, confirmation, and flow alignment.
For now, it’s about risk control and patience until tomorrow’s data gives a clean framework signal.
CORE5 Rule of the Day:
Mid-range moves feed ego, not equity.
— CORE5DAN
Institutional Logic. Modern Technology. Real Freedom.

Bullish continuation setup?The US Dollar Index (DXY) is falling towards the pivot which is a pullback support that aligns with the 38.2% Fibonacci retracement and could bounce to the 1st resistance.
Pivot: 99.53
1st Support: 98.55
1st Resistance: 101.46
Disclaimer:
The above opinions given constitute general market commentary, and do not constitute the opinion or advice of IC Markets or any form of personal or investment advice.
Any opinions, news, research, analyses, prices, other information, or links to third-party sites contained on this website are provided on an "as-is" basis, are intended only to be informative, is not an advice nor a recommendation, nor research, or a record of our trading prices, or an offer of, or solicitation for a transaction in any financial instrument and thus should not be treated as such. The information provided does not involve any specific investment objectives, financial situation and needs of any specific person who may receive it. Please be aware, that past performance is not a reliable indicator of future performance and/or results. Past Performance or Forward-looking scenarios based upon the reasonable beliefs of the third-party provider are not a guarantee of future performance. Actual results may differ materially from those anticipated in forward-looking or past performance statements. IC Markets makes no representation or warranty and assumes no liability as to the accuracy or completeness of the information provided, nor any loss arising from any investment based on a recommendation, forecast or any information supplied by any third-party.

USD Potential Retracement to 99.5I am anticipating a potential retracement on DXY :
Price has run above the recent daily range high. I am now anticipating a potential retracement or pullback.
I will be monitoring H4 and H1 Timeframe price action to see if H1 and H4 lows can start getting taken to validate the idea.
I will also be monitoring the close of Wednesdays Daily Candle.
I am anticipating DXY to pullback to around 99.475 to look for more long positions.
Once dxy has traded back to the key level / support area i will then target 100.360

DXYSo DXY showing great structure after failing to continue bullish as it did not break above the supply zone and now, moving bearish ensuring the to move towards previous demad zone which price created.

US DOLLAR INDEX (DXY) shortsFor DXY, I am looking for a continuation of last week's sells. There are two supply area I am looking to short from. I will sit on my hands until price reaches these areas and give a confirmation for sells. One market reaches these levels, an update will be sent out. Please do not jump in blindly. Manage risk!
-TD

Gold Vs DXYIt means using gold’s price in U.S. dollars as a report card on the dollar (and on paper money in general).
Gold is priced in USD (e.g., $2,000/oz).
If gold goes up a lot vs the dollar, that often signals:
The dollar is losing purchasing power (inflation / debasement fears), or
People are seeking a “safe haven” outside fiat currency.
If gold is weak vs the dollar, it usually means:
The dollar is relatively strong,
Markets are more comfortable holding cash, bonds, or risk assets instead of “hard money.”
So “checking gold against the dollar” is basically asking:
“How much real value does a dollar still buy, measured in something that can’t be printed?”

DXY : This Up Wave Won’t Last Long!The U.S. Dollar Index has made a corrective push up, but momentum looks weak. Structure suggests this “up wave” could soon fade, paving the way for another bearish move. Watch closely a potential reversal could be near!
Disclosure: We are part of Trade Nation's Influencer program and receive a monthly fee for using their TradingView charts in our analysis.*

DXYU.S Dollar Index
- Bullish Channel as an corrective pattern in Long Time Frame
- Break of Structure
- Completed " 1234 " Impulsive Waves
- Fibonacci Level - 23.60%
- Demand Zone

DXY FRGNT Weekly Forecast -Q4 | W46 | Y25 |📅 Q4 | W46 | Y25 |
📊 DXY FRGNT Weekly Forecast
🔍 Analysis Approach:
I’m applying Smart Money Concepts, focusing on:
Identifying Points of Interest on the Higher Time Frames (HTFs) 🕰️
Using those POIs to define a clear trading range 📐
Refining those zones on Lower Time Frames (LTFs) 🔎
Waiting for a Break of Structure (BoS) for confirmation ✅
This method allows me to stay precise, disciplined, and aligned with the market narrative, rather than chasing price.
💡 My Motto:
"Capital management, discipline, and consistency in your trading edge."
A positive risk-to-reward ratio, paired with a high win rate, is the backbone of any solid trading plan 📈🔐
⚠️ Losses?
They’re part of the mathematical game of trading 🎲
They don’t define you — they’re necessary, they happen, and we move forward 📊➡️
🙏 I appreciate you taking the time to review my Daily Forecast.
Stay sharp, stay consistent, and protect your capital
— FRNGT 🚀
TVC:DXY

DXY (DOLLAR INDEX) outlook for this weekDXY Weekly Outlook
Looking at the dollar this week, it’s aligning nicely with my setups on EU and GU. I’m watching to see if price will mitigate the 8hr supply zone, which fits perfectly with my plan to buy EU and GU from their demand zones — since a move down in the dollar typically means those pairs will push higher.
Alternatively, if the dollar bounces from demand and continues up, then I’ll be looking for sell opportunities on EU and GU instead.
Overall, DXY still looks bullish long term, and I believe this current downside move is just a temporary bearish correction before continuing higher.

DOLLAR INDEX 3HR CHART DOLLAR index from TVC broker already attained 100.354 before correction and i see the buying pace to return into 100$ and above despite rate cut .the close of the newyork session came back to my demand floor and reacted on long position based on the rule of break and retest.
FUNDAMENTAL OF DOLLAR INDEX .
The U.S. Dollar Index (USDX or DXY) is a measure of the value of the U.S. dollar relative to a basket of six major foreign currencies: the euro (EUR), Japanese yen (JPY), British pound (GBP), Canadian dollar (CAD), Swedish krona (SEK), and Swiss franc (CHF). It was created by the U.S. Federal Reserve in 1973 shortly after the Bretton Woods Agreement dissolved. The index is maintained and published by the Intercontinental Exchange (ICE).
How the Dollar Index Works
The index is a weighted geometric mean of the dollar’s value relative to the six currencies, with the euro having the largest weight (57.6%).
A rise in the index indicates dollar strengthening against these currencies, while a decline indicates dollar weakness.
Impact on Gold Price
Gold is priced in U.S. dollars globally, so its price has an inverse relationship with the dollar index.
When the dollar strengthens (index rises), gold becomes more expensive in other currencies, reducing demand and often causing gold prices to fall.
Conversely, when the dollar weakens (index falls), gold becomes cheaper internationally, increasing demand and driving prices up.
Additionally, gold is viewed as a safe-haven asset, so macroeconomic factors influencing the dollar also indirectly affect gold's price dynamics.
The relationship between the U.S. Dollar Index (DXY) and the U.S. 10-year Treasury yield (US10Y) is closely interconnected, reflecting how currency strength and bond yields interact in financial markets.
Key Points of Dollar Index and US10Y Relationship:
Positive Correlation:
Generally, the Dollar Index and the US 10-year Treasury yield move together. When the 10-year yield rises, it often signals expectations of stronger U.S. economic growth and potential inflation, which tends to boost demand for the U.S. dollar, pushing the Dollar Index higher.
Yield Attraction:
Higher U.S. Treasury yields make U.S. assets more attractive to global investors, increasing the demand for dollars to buy Treasury securities. This capital inflow strengthens the dollar against other currencies, reflected in a rising Dollar Index.
Monetary Policy Expectations:
The 10-year yield is influenced by Federal Reserve monetary policy and market expectations. When the Fed signals tightening (rate hikes), yields rise, supporting dollar strength. Conversely, easing tends to lower yields and weigh on the dollar.
Safe-Haven Dynamics:
During economic uncertainty or risk-off events, both U.S. Treasuries and the dollar may see increased demand. This can sometimes cause a decoupling if yields fall (due to bond buying) while the dollar strengthens as a safe haven.
Reasons for Dollar Index Rising Despite Rate Cuts:
Safe-Haven Demand:
Even with rate cuts, in times of global uncertainty or geopolitical tensions, the U.S. dollar remains a preferred safe-haven currency. Investors flock to the dollar for safety, pushing the index higher.
Relative Central Bank Policies:
The dollar’s strength is relative. If other major central banks (ECB, BOJ, BOE,RBA,RBNZ,BOC ) maintain lower rates or ease monetary policy more aggressively, the dollar can strengthen even if the Fed cuts rates.
Market Expectations and Rate Cut Timing:
Rate cuts may have been widely anticipated and priced in ahead of time. The dollar may have declined earlier, and once the cut occurs without negative surprises, it can stabilize or rebound.
Economic Outlook and Inflation:
If the rate cut is seen as precautionary with a still strong U.S. economy or persistent inflation, dollar strength may persist since the Fed is not signaling prolonged easing.
Yield Curve and Bond Flows:
Even with short-term cuts, longer-dated Treasury yields may remain elevated due to inflation or growth expectations, attracting foreign capital and supporting the dollar.
Technical and Positioning Factors:
Trading dynamics, market positioning, and technical support levels can sustain or boost the dollar temporarily irrespective of fundamentals ,such as the break and retest of the daily supply roof and traders took long position on the retest of a broken supply as a new demand floor to close the week touching 100.354 before correction
#US10Y #DXY #dollar

DXY FRGNT Daily Forecast -Q4 | W46 | D11 | Y25 |📅 Q4 | W46 | D11 | Y25 |
📊 DXY FRGNT Daily Forecast
🔍 Analysis Approach:
I’m applying Smart Money Concepts, focusing on:
Identifying Points of Interest on the Higher Time Frames (HTFs) 🕰️
Using those POIs to define a clear trading range 📐
Refining those zones on Lower Time Frames (LTFs) 🔎
Waiting for a Break of Structure (BoS) for confirmation ✅
This method allows me to stay precise, disciplined, and aligned with the market narrative, rather than chasing price.
💡 My Motto:
"Capital management, discipline, and consistency in your trading edge."
A positive risk-to-reward ratio, paired with a high win rate, is the backbone of any solid trading plan 📈🔐
⚠️ Losses?
They’re part of the mathematical game of trading 🎲
They don’t define you — they’re necessary, they happen, and we move forward 📊➡️
🙏 I appreciate you taking the time to review my Daily Forecast.
Stay sharp, stay consistent, and protect your capital
— FRNGT 🚀
TVC:DXY

A clear long DXY coming weeksAccording to the monthly chart, DXY will push higher to reach 50% of the previous bearish leg, see weekly and 4h charts for more details.

Update of the Dollar Index analysisWith confirmation of the break of the 99.250 zone, we can say the trigger for a sell has been activated.
DXY — Range Structure HoldsThe US Dollar Index (DXY) started the week trading just below a bearish distribution fractal low at 99.321. Price holds inside a short-term bearish range between 99.000 (low) and 99.500 (high) while still operating within the broader daily bullish structure. DXY is currently moving through the daily imbalance cap near 99.035, sitting in the premium zone — compression remains active as larger participants stay patient. Market Structure Mapping (MSM) shows price tightening in that upper zone — the calm before the bigger players step in.
Market Structure Mapping (MSM) shows price pressing into the daily imbalance high near 99.035, lining up with the range-low fractal around 99.032. That’s the lower edge of Monday’s structure — tight, clean, and holding steady. Volume Flow Analytics (VFA) points to order-flow absorption — buyers keep hitting the tape, but liquidity keeps taking the other side.
It’s that slow-burn type of session where participation fades and bigger players quietly build positions under the surface. If that pattern holds, price could drift back toward the discount area once participation increases.
No rush — London already had its short trade this morning.
Now it’s just about waiting for confirmed order flow before taking the next setup.
The dollar’s steady as Washington works on a funding deal to end the government shutdown, calming market nerves.
Ten-year Treasury yields hover just above 4.1 %, keeping a floor under USD as investors still get paid to hold dollars.
Inflation’s sitting near 3 %, growth data is mixed, and delayed reports mean traders are reacting more to headlines than numbers.
For now, yields and improving political tone offer support — but it’s not bulletproof.
If debt or growth headlines turn sour again, that support can fade fast.
🦅 CORE5 RULE:
Slow days build strong traders. Wait for the flow, not the noise.
— CORE5DAN
Institutional Logic. Modern Technology. Real Freedom.

US Dollar Index (DXY)- Ready for shorts?I have been waiting for sell confirmations on this since market open this week. Momentum to the upside is really slowing down. We can expect possible shorts from current levels. I am waiting for a break to the downside followed by a correction to enter sells on this. Do not jump in blindly. Manage Risk!
-TD

FRGNT FUN COUPON FRIDAY -Q4 | W45 | D7| Y25 | DXY📅 Q4 | W45 | D7| Y25 |
📊 DXY FRGNT Daily Forecast
FRGNT FUN COUPON FRIDAY
🔍 Analysis Approach:
I’m applying Smart Money Concepts, focusing on:
Identifying Points of Interest on the Higher Time Frames (HTFs) 🕰️
Using those POIs to define a clear trading range 📐
Refining those zones on Lower Time Frames (LTFs) 🔎
Waiting for a Break of Structure (BoS) for confirmation ✅
This method allows me to stay precise, disciplined, and aligned with the market narrative, rather than chasing price.
💡 My Motto:
"Capital management, discipline, and consistency in your trading edge."
A positive risk-to-reward ratio, paired with a high win rate, is the backbone of any solid trading plan 📈🔐
⚠️ Losses?
They’re part of the mathematical game of trading 🎲
They don’t define you — they’re necessary, they happen, and we move forward 📊➡️
🙏 I appreciate you taking the time to review my Daily Forecast.
Stay sharp, stay consistent, and protect your capital
— FRNGT 🚀
TVC:DXY

DXY Selling view watch chart📉 DXY Update (4H Timeframe)
DXY currently reacting from the 100.300 supply zone, following selling pressure from the 100.000 level.
🔹 Technical Outlook:
Resistance / Supply Zone: 100.000 – 100.300
Support Levels: 99.800 🟡 | 99.500 🟢
Bias: Bearish below 100.000
💡 Price action shows signs of rejection at key resistance. Watch for confirmation before entering. Always trade with discipline and a clear plan.
⚠️ Risk Management Reminder:
Use proper position sizing and always protect your capital — no setup is 100% guaranteed.
👉 Like • Comment • Follow • Share
For more daily technical updates and insights 💹
#DXY #DollarIndex #ForexAnalysis #TechnicalAnalysis #PriceAction #TradingSetup #RiskManagement

Bullish momentum to extend?The US Dollar Index (DXY) is declining toward the pivot level, which serves as an overlap support zone, and may rebound toward the 1st resistance.
Pivot: 98.29
1st Support: 97.14
1st Resistance: 101.91
Disclaimer:
The above opinions given constitute general market commentary, and do not constitute the opinion or advice of IC Markets or any form of personal or investment advice.
Any opinions, news, research, analyses, prices, other information, or links to third-party sites contained on this website are provided on an "as-is" basis, are intended only to be informative, is not an advice nor a recommendation, nor research, or a record of our trading prices, or an offer of, or solicitation for a transaction in any financial instrument and thus should not be treated as such. The information provided does not involve any specific investment objectives, financial situation and needs of any specific person who may receive it. Please be aware, that past performance is not a reliable indicator of future performance and/or results. Past Performance or Forward-looking scenarios based upon the reasonable beliefs of the third-party provider are not a guarantee of future performance. Actual results may differ materially from those anticipated in forward-looking or past performance statements. IC Markets makes no representation or warranty and assumes no liability as to the accuracy or completeness of the information provided, nor any loss arising from any investment based on a recommendation, forecast or any information supplied by any third-party.

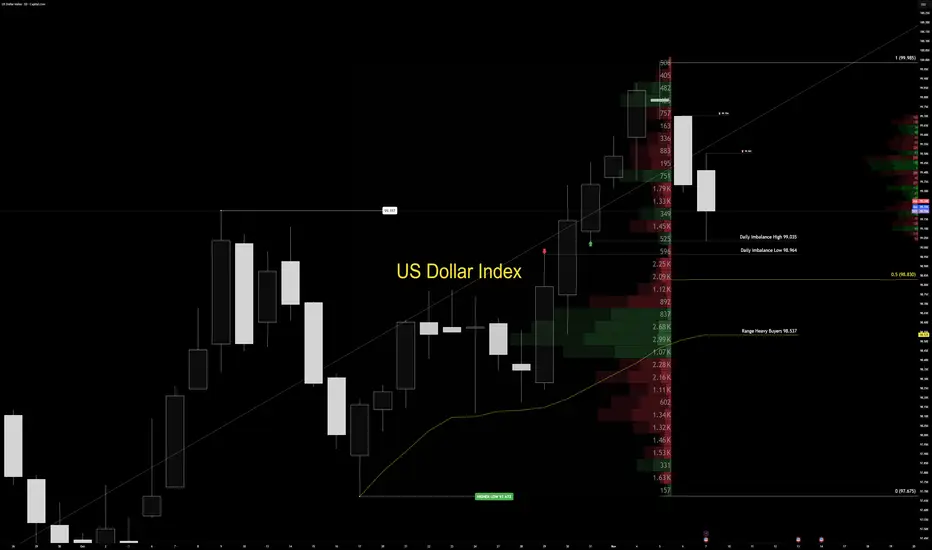
Sunday Dollar War Map | Week Ahead — DXY Structure OutlookThe US Dollar Index (DXY) continues to trade within a controlled bullish range, holding the upper half of its daily structure between 97.675 (range low) and 99.985 (range high). Price remains anchored inside premium territory, with a daily imbalance cap defined between 99.035 (high) and 98.964 (low).
Volume delta stays concentrated deep in the discount zone near 98.537, showing that institutional participation remains limited. Early in the week, price may probe deeper into that imbalance cap to trigger larger positioning before any directional expansion. Until confirmed volume steps in, the tactical stance remains clear: observe, don’t predict. Professionals wait for conviction — amateurs try to guess it.
The active order flow imbalance remains unfilled, and price typically reacts once single prints inside that imbalance get touched. However, the heavy volume concentration across the lower half of the range deserves attention — trading directly into the cap often causes reactive blowback. That’s not random; it’s how market maker logic plays out through volume flow behavior.
On the macro side, US yields continue to climb as investors demand higher compensation for duration risk. The 10-year Treasury yield hovers near 4.1%, while the 30-year sits close to 4.7%. Meanwhile, fiscal pressure continues to build — record government debt and renewed shutdown risks are keeping confidence fragile.
The outcome is a balancing act: rising yields support the dollar in the short term, while long-term credibility remains under pressure. For now, the dollar holds its ground — but each move is conditional.
Professionals trade participation, not prediction. The market doesn’t reward speed — it rewards confirmation. Let the tape show its hand before you show yours. Structure speaks first. Volume decides who listens.
— Institutional Logic. Modern Technology. Real Freedom.
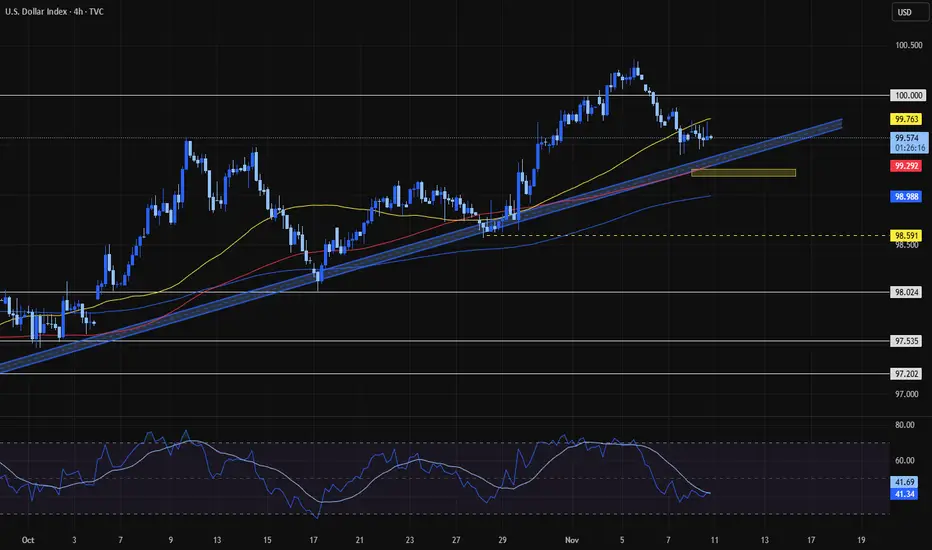
USD Falling Wedge Breakout, 4-month Highs into PullbackUSD put in another rate cut rally after the Fed's move last week and that extends the Q4 theme that's seen a continuation of higher-highs and lows ever since the Fed's initial rate cut announcement in September.
Yesterday saw test of a big level at 100.22, which was the swing low from last year's start of FOMC rate cuts. That level printed at the rate cut announcement, held the lows for the next couple of weeks, and then price launched into a massive reversal that ran for all of Q4 and into the first couple weeks of 2025.
This year's iteration has been different and Treasury yields aren't jumping like they were last year, but the impact in USD is similar as the bullish sequence has been driven by the FOMC announcements and that keeps bulls in the driver's seat for short-term trends.
With some profit taking showing after that push up to fresh highs and test of a key resistance level yesterday, the question now is whether bulls come in to defend the move. There's three spots of support just below price that each set the stage for continuation.
The 99.40 level was resistance earlier in October, after having shown as resistance in June. Just below that, the 98.98 Fibonacci level still looms large, and there's another spot of resistance turned support at 98.60 that sits below that and currently functions as an 's3' area. - JS
