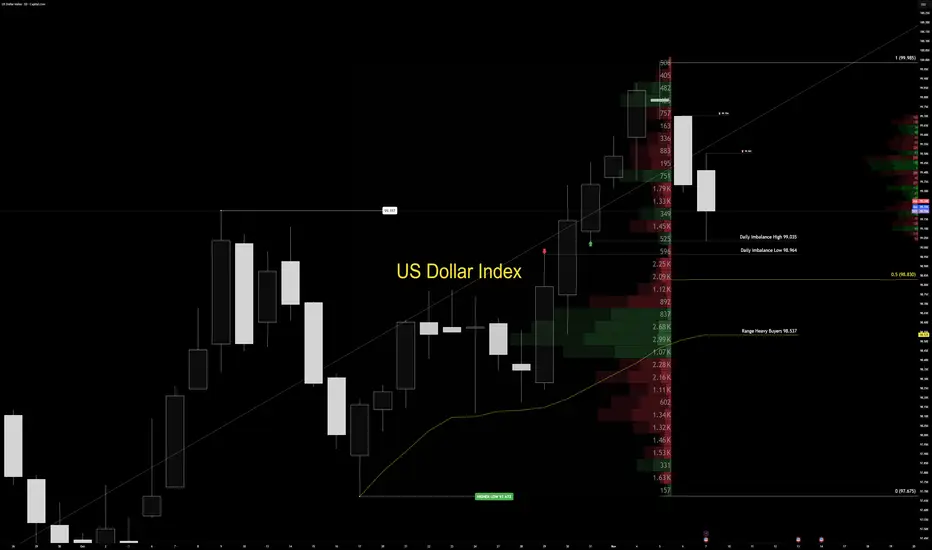
Sunday Dollar War Map | Week Ahead — DXY Structure OutlookThe US Dollar Index (DXY) continues to trade within a controlled bullish range, holding the upper half of its daily structure between 97.675 (range low) and 99.985 (range high). Price remains anchored inside premium territory, with a daily imbalance cap defined between 99.035 (high) and 98.964 (low).
Volume delta stays concentrated deep in the discount zone near 98.537, showing that institutional participation remains limited. Early in the week, price may probe deeper into that imbalance cap to trigger larger positioning before any directional expansion. Until confirmed volume steps in, the tactical stance remains clear: observe, don’t predict. Professionals wait for conviction — amateurs try to guess it.
The active order flow imbalance remains unfilled, and price typically reacts once single prints inside that imbalance get touched. However, the heavy volume concentration across the lower half of the range deserves attention — trading directly into the cap often causes reactive blowback. That’s not random; it’s how market maker logic plays out through volume flow behavior.
On the macro side, US yields continue to climb as investors demand higher compensation for duration risk. The 10-year Treasury yield hovers near 4.1%, while the 30-year sits close to 4.7%. Meanwhile, fiscal pressure continues to build — record government debt and renewed shutdown risks are keeping confidence fragile.
The outcome is a balancing act: rising yields support the dollar in the short term, while long-term credibility remains under pressure. For now, the dollar holds its ground — but each move is conditional.
Professionals trade participation, not prediction. The market doesn’t reward speed — it rewards confirmation. Let the tape show its hand before you show yours. Structure speaks first. Volume decides who listens.
— Institutional Logic. Modern Technology. Real Freedom.
Trade ideas
FRGNT FUN COUPON FRIDAY -Q4 | W45 | D7| Y25 | DXY📅 Q4 | W45 | D7| Y25 |
📊 DXY FRGNT Daily Forecast
FRGNT FUN COUPON FRIDAY
🔍 Analysis Approach:
I’m applying Smart Money Concepts, focusing on:
Identifying Points of Interest on the Higher Time Frames (HTFs) 🕰️
Using those POIs to define a clear trading range 📐
Refining those zones on Lower Time Frames (LTFs) 🔎
Waiting for a Break of Structure (BoS) for confirmation ✅
This method allows me to stay precise, disciplined, and aligned with the market narrative, rather than chasing price.
💡 My Motto:
"Capital management, discipline, and consistency in your trading edge."
A positive risk-to-reward ratio, paired with a high win rate, is the backbone of any solid trading plan 📈🔐
⚠️ Losses?
They’re part of the mathematical game of trading 🎲
They don’t define you — they’re necessary, they happen, and we move forward 📊➡️
🙏 I appreciate you taking the time to review my Daily Forecast.
Stay sharp, stay consistent, and protect your capital
— FRNGT 🚀
TVC:DXY

DXY H1Dollar Index hourly timeframe
Daily FVG ( Remains Open )
H4 BoS
H4 IFVG (Traded too in H1) Thursday
Traded too Daily FVG on Friday
H1 Breakway gap & FVG Created Friday ( Remains Open )
Draw on liquidity H4 Relative EQL @98.64 & Daily Gap @98.00

DXY Weekly OutlookOn the weekly chart, the DXY has reached the global point B that we marked five weeks ago. This move defined the direction for all dollar-related pairs over the past month and a half. Now it’s time to reassess the chart and outline the key mid-term scenarios.
Plan A:
The key level provides enough volume to trigger a deeper correction. The price bounces from one of the support zones and then continues the main trend. For now, there are no strong arguments on the chart to confirm a trend reversal — the structure remains bullish.
Plan B:
The price reacts to the nearest support area and continues moving upward without a deep correction. This scenario becomes valid only if we see renewed momentum and strong buy-side pressure.
We’re at an important turning point. Watch how the price reacts around point B — this will determine the next phase for the dollar.

US Dollar Index (DXY)- Ready for shorts?I have been waiting for sell confirmations on this since market open this week. Momentum to the upside is really slowing down. We can expect possible shorts from current levels. I am waiting for a break to the downside followed by a correction to enter sells on this. Do not jump in blindly. Manage Risk!
-TD

A clear long DXY coming weeksAccording to the monthly chart, DXY will push higher to reach 50% of the previous bearish leg, see weekly and 4h charts for more details.

USD Falling Wedge Breakout, 4-month Highs into PullbackUSD put in another rate cut rally after the Fed's move last week and that extends the Q4 theme that's seen a continuation of higher-highs and lows ever since the Fed's initial rate cut announcement in September.
Yesterday saw test of a big level at 100.22, which was the swing low from last year's start of FOMC rate cuts. That level printed at the rate cut announcement, held the lows for the next couple of weeks, and then price launched into a massive reversal that ran for all of Q4 and into the first couple weeks of 2025.
This year's iteration has been different and Treasury yields aren't jumping like they were last year, but the impact in USD is similar as the bullish sequence has been driven by the FOMC announcements and that keeps bulls in the driver's seat for short-term trends.
With some profit taking showing after that push up to fresh highs and test of a key resistance level yesterday, the question now is whether bulls come in to defend the move. There's three spots of support just below price that each set the stage for continuation.
The 99.40 level was resistance earlier in October, after having shown as resistance in June. Just below that, the 98.98 Fibonacci level still looms large, and there's another spot of resistance turned support at 98.60 that sits below that and currently functions as an 's3' area. - JS

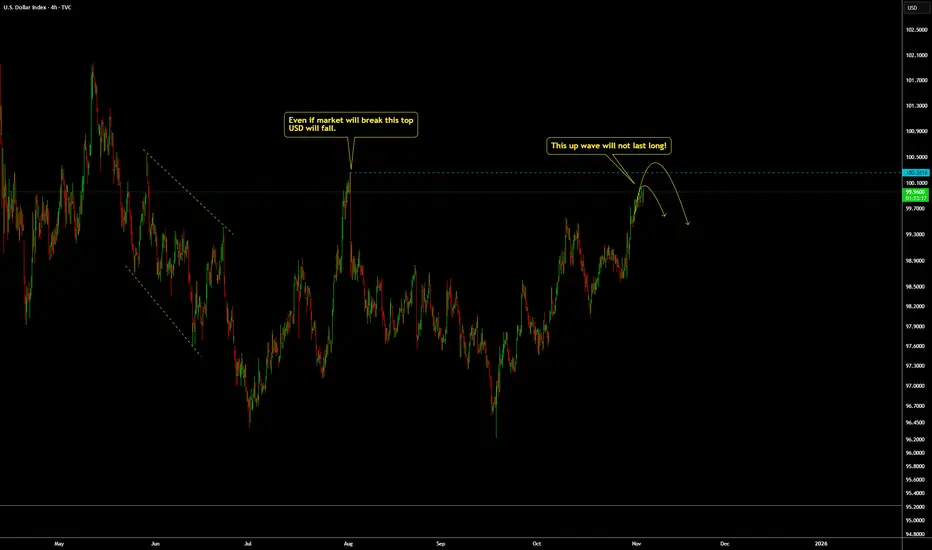
DXY(Dollar Index): This up wave will not last long.For TVC:DXY , don't be trapped with this up wave, it should not last long. What is happening now is only manipulation based on what we see.
Fed will continue to cut rates if not this year, next year and they are printing money, ending the QT and also things are not okay. Based on that, on the fundamental part of things and We Trade Waves wave analysis concept. Any sell setup we get for DXY we will go for it BUT:
Always remember WTW 4 Golder Rules:
1) Do not jump in
2) Do not over risk/trade
3) Do not trade without Stop Loss
4) Never ever add to a losing position!
Trade with care
We Trade Waves
WTW Team
Disclosure: We are part of Trade Nation's Influencer program and receive a monthly fee for using their TradingView charts in our analysis.
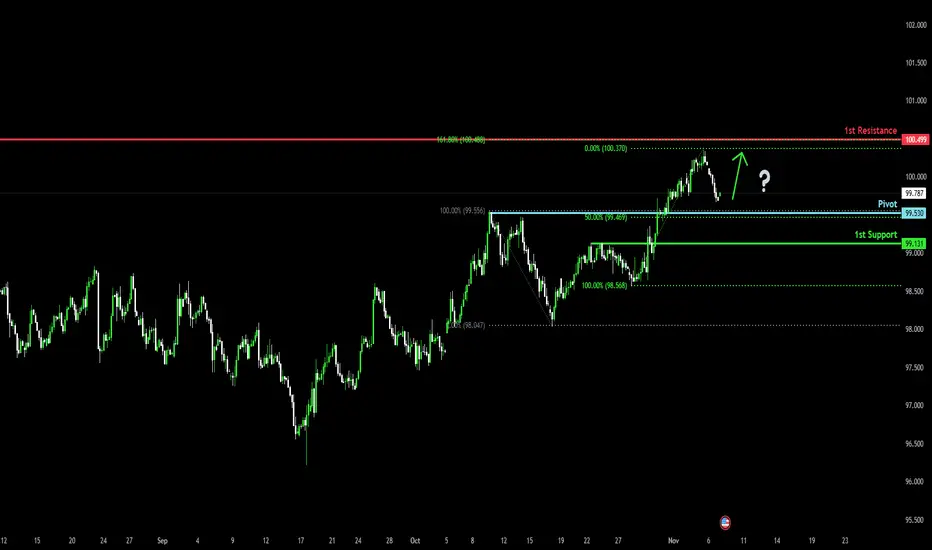
Bullish bounce off 50% Fibonacci support?The US Dollar Index (DXY) is falling towards the pivot, which has been identified as a pullback support that aligns with the 50% Fibonacci retracement and could bounce to the 1st resistance.
Pivot: 99.53
1st Support: 99.13
1st Resistance: 100.49
Disclaimer:
The above opinions given constitute general market commentary, and do not constitute the opinion or advice of IC Markets or any form of personal or investment advice.
Any opinions, news, research, analyses, prices, other information, or links to third-party sites contained on this website are provided on an "as-is" basis, are intended only to be informative, is not an advice nor a recommendation, nor research, or a record of our trading prices, or an offer of, or solicitation for a transaction in any financial instrument and thus should not be treated as such. The information provided does not involve any specific investment objectives, financial situation and needs of any specific person who may receive it. Please be aware, that past performance is not a reliable indicator of future performance and/or results. Past Performance or Forward-looking scenarios based upon the reasonable beliefs of the third-party provider are not a guarantee of future performance. Actual results may differ materially from those anticipated in forward-looking or past performance statements. IC Markets makes no representation or warranty and assumes no liability as to the accuracy or completeness of the information provided, nor any loss arising from any investment based on a recommendation, forecast or any information supplied by any third-party.
DOLLAR INDEX (DXY): Too Overbought Now
Looks like Dollar Index finally starts correction.
A test of a significant hisotric daily resistance triggered
a bearish movement and an intraday change of character
on a 4H time frame.
I think that the market may drop lower.
Goal - 99.8
❤️Please, support my work with like, thank you!❤️

DXY Near 100 as Rate-Cut Odds Fade and Uptrend Remains IntactHey Traders,
In today’s trading session we are monitoring the US Dollar Index (DXY) for a buying opportunity around the 100.000 zone. The Index is trading in a broader uptrend and currently is in a correction phase, approaching the trend support/resistance area near 100.000.
Structure:
The prevailing trend remains bullish, though price is consolidating and retesting the support/resistance level at 100.000. A solid rebound here could signal a resumption of the upward trajectory.
Fundamentals:
Recent commentary from the Federal Reserve indicates that a rate cut in December is increasingly unlikely. This hawkish tilt supports the Dollar and reinforces the up-trend scenario.
Next move:
Watching how price behaves around 100.000 — if the level holds, the bias remains bullish; a break below would call structural risk into question.
Trade safe,
Joe.

DXY — London Session🧭 Market Context
Dollar capped down overnight from 99.762 to 99.704 but still trades above the key bullish structure point at 99.525. The structure remains bullish overall, yet price keeps failing to break through 99.875 — the current cap. London session has filled yesterday’s balance range, leaving us in neutral territory.
We’re sitting on zero deviation — meaning equal chance to push higher or rotate lower.
Before taking any position, we need confirmation.
📈 Technical Frame DSM + VFA
Structure stays constructive but momentum is fading.
Volume shows thinning participation near 99.875 — professionals aren’t chasing.
If we see clear volume conviction through that level, we likely drive higher and fill the capped zone. If price slips below 99.525, expect a liquidity sweep into the lower volume pocket near 99.40. Right now, this is observation mode — not engagement mode.
🌍 Fundamental Frame (Macro Logic)
Overnight softness came from mild risk-on sentiment — Asia equities up, yields down.
Still, the Fed’s tone stays restrictive, and dollar demand remains under the surface.
This move looks more like positioning ahead of NFP than any real shift in trend.
🏛️ Coach’s Lens
When the market sits in balance, patience becomes the edge.
Professionals wait for clarity; amateurs act on hope.
Bias follows structure — not emotion.
🎯 Operator Rule
Confirmation defines conviction.
— CORE5DAN
Institutional Logic. Modern Technology. Real Freedom.

DXY Daily Outlook — Bullish Order Flow Toward Equal HighsHello traders 👋
On the DXY daily chart, we can clearly see that price showed a strong bullish reaction after grabbing liquidity below 96.37, initiating a bullish order flow that, in my view, is still in progress.
The equal highs above the current price act as a potential draw on liquidity and serve as my first bullish target.
However, keep an eye on the trendline liquidity forming below the current price — there’s a possibility that price may sweep this liquidity before continuing higher.
Overall, my bias remains bullish for now.
💌It is my honor to share your comments with me💌
🔎 DYOR
💡Wait for the update!

DXY Bullish Continuation Risks Challenge the 100.20-ResistanceOn the daily chart, the DXY’s rebound from its 17-year support near 96 resembles an inverted head-and-shoulders breakout, currently testing the 100.20 resistance.
A confirmed close above this level would complete the pattern, targeting the 101.80 and 103.40 levels — moves that could potentially pressure GBPUSD toward 1.2940 and 1.2740, as detailed in the following charts.
From the downside, if the DXY retreats below 99.40, the selling pressure on major currencies may ease. In that scenario, the DXY is expected to retest the neckline and validate the inverted head-and-shoulders formation, with the trendline connecting consecutive lower highs from May to August, between 98.50 and 98.00.
- Razan Hilal, CMT

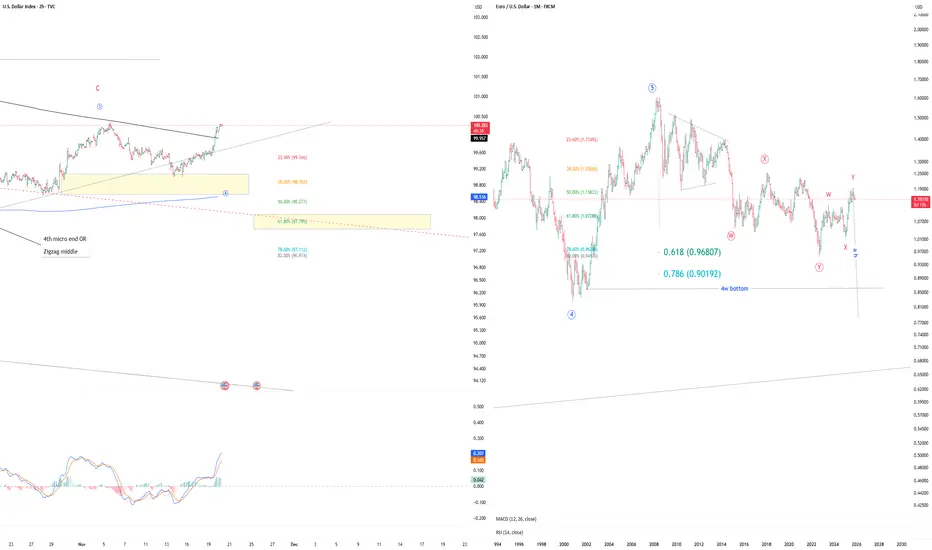
Turning pointThe DXY may have bottomed out on September 17. The subsequent price action could be a series of first and second waves. It either could be simply ABC.
We will get confirmation of this hypothesis next week. If the DXY fails to fall below 97.75, it will confirm that the EURUSD is on the verge of its most significant price movement since 2022.
If to look at the EURUSD SMA 1M TF, we can see that they are bending downward, which is a clue.
The bottom of EURUSD wave 4 is the target - 0.94 per single EUR unit
In addition, gold confirmed the end of the fifth wave intermediate degree this Friday. Gold and the US Dollar usually correlate with each other, usually.
In the short term two cases are probable:
1) DXY may break resistance 100.7 - 102%
2) Coll down to 97,795%
Most likely, both events will occur.
DXY FRGNT Daily Forecast -Q4 | W47| D20 | Y25 |📅 Q4 | W47| D20 | Y25 |
📊 DXY FRGNT Daily Forecast
🔍 Analysis Approach:
I’m applying Smart Money Concepts, focusing on:
Identifying Points of Interest on the Higher Time Frames (HTFs) 🕰️
Using those POIs to define a clear trading range 📐
Refining those zones on Lower Time Frames (LTFs) 🔎
Waiting for a Break of Structure (BoS) for confirmation ✅
This method allows me to stay precise, disciplined, and aligned with the market narrative, rather than chasing price.
💡 My Motto:
"Capital management, discipline, and consistency in your trading edge."
A positive risk-to-reward ratio, paired with a high win rate, is the backbone of any solid trading plan 📈🔐
⚠️ Losses?
They’re part of the mathematical game of trading 🎲
They don’t define you — they’re necessary, they happen, and we move forward 📊➡️
🙏 I appreciate you taking the time to review my Daily Forecast.
Stay sharp, stay consistent, and protect your capital
— FRNGT 🚀
TVC:DXY

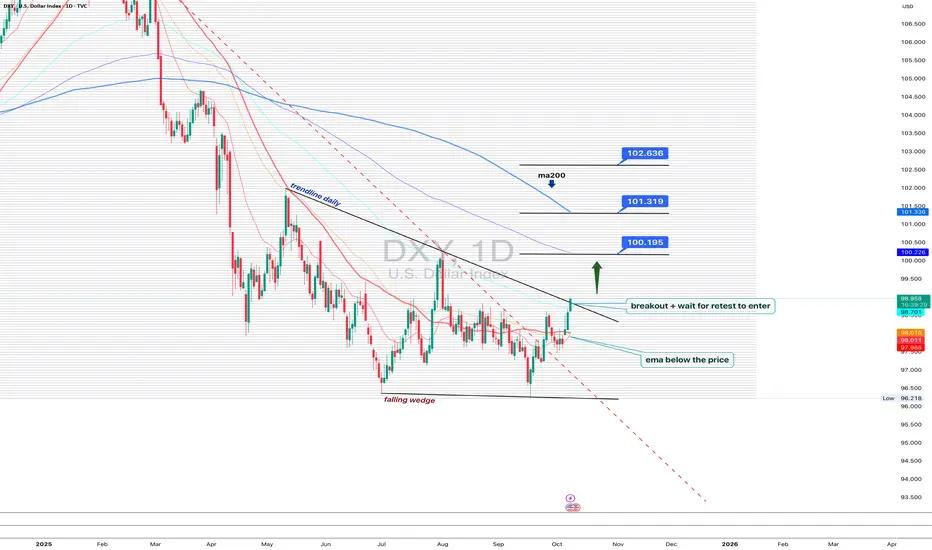
DXY 1D - dollar waking up, but patience is keyOn the daily chart, the US Dollar Index is showing the first signs of recovery: a falling wedge breakout and trendline breach hint that bulls are slowly reclaiming control. Price has moved above the EMA, a short-term bullish signal.
Still, MA200 remains above, reminding us that the broader trend is not yet flipped. The ideal play here - wait for a retest of the breakout trendline to confirm buyers’ strength before jumping in.
If price holds above 99.70, the next upside targets sit around 100.19, 101.31, and 102.63.
But keep in mind - DXY loves to test patience. False breakouts are its favorite sport.
Right now, the dollar looks ready to wake up, but maybe hit the snooze button one last time before the real move begins.

This is a very tough market/ a look at gold and silver and dxyOctober 19th I'm sure most people listening to this are also listening to their favorite show that helps them make a decision about the markets and the more services you start to look at the more confused you will be. Personally I'm spending very little time looking at the market but I try to take a quick glance of it either at the middle or beginning of the current day and then I can determine whether the market looks interesting or not. However the pattern on Bitcoin which I do not trade is the setup I would be looking for the markets that I would be looking to trade. Bitcoin is taking a little bit of a drawdown and there's a lot of information out there saying that Bitcoin is in trouble.... Probably from people who trade gold and silver///so you have to be careful of other people's biases.... But it will probably be tradable tomorrow on Bitcoin defined a reversal pattern going higher.... And you should be able to take a trade with a very small stop but you want to let the market come to you if you don't see a 2 bar reversal indicating that Bitcoin is going to go higher you can't take the trade.

DXYDollar annotated fib channel. Dollar is braving FED cuts and QT end shenanigans. All the while gold and silver are hitting ath, crypto is still relatively interesting, and megacaps have no fear

Dollar on the way down!This is on the daily timeframe.
Support has now become resistance.
Look for the dollar to be rejected at
these levels once again before heading
down to 90 cents. Watch for BTC to start
slowly grinding it's way back up to ATH by
early 2026. Good luck out there!!!

DXY SellsFor DXY price has been moving up in a corrective manner towards a supply area. Price is currently in the supply area and I am expecting shorts from this region. If I see any break and retest to the downside, I will be selling DXY.
Do not jump in blindly. Manage Risk!
-TD

DXY Turning Bearish: This Week’s Best USD Sell Setups!This week I’m watching the DXY closely, and the structure is giving a bearish outlook, opening the door for multiple USD sell opportunities across the board.
I’m analyzing high-probability sell setups on:
🔹 USDCAD – looking for downside continuation
🔹 USDCHF – bearish momentum building
🔹 USDJPY – potential reversal and sell structure forming
🔹 AUDUSD – bullish strength as USD weakens
🔹 GBPUSD – clean bullish flow against the dollar
🔹 NZDUSD – continuation buys as USD trends lower
🔹 GBPJPY – watching for yen strength + risk flow shifts
📊 With the dollar losing steam, these pairs are lining up for possible trend continuation or reversal plays. In this video, I’ll break down structure, key zones, confluences, and what confirmations I want before entering.
👍 Don’t forget to like, comment, and subscribe if you want weekly market breakdowns and trade ideas.
