Bretton Woods 2.0?Examining the long-term trend of TVC:DXY since the 1980s, we might be facing a staggering 40% reduction in valuation, potentially landing us around 60. If the US were to devalue the dollar this drastically, could it effectively erase the national debt? 🤔 Is Trump bold enough to consider such a move?
We know the FED is going to cut eventually, the question is when and by how much? Initial claims came in higher than estimated, with cracks beginning to show in the labor market, how much longer can JPow hold out?
Trade ideas

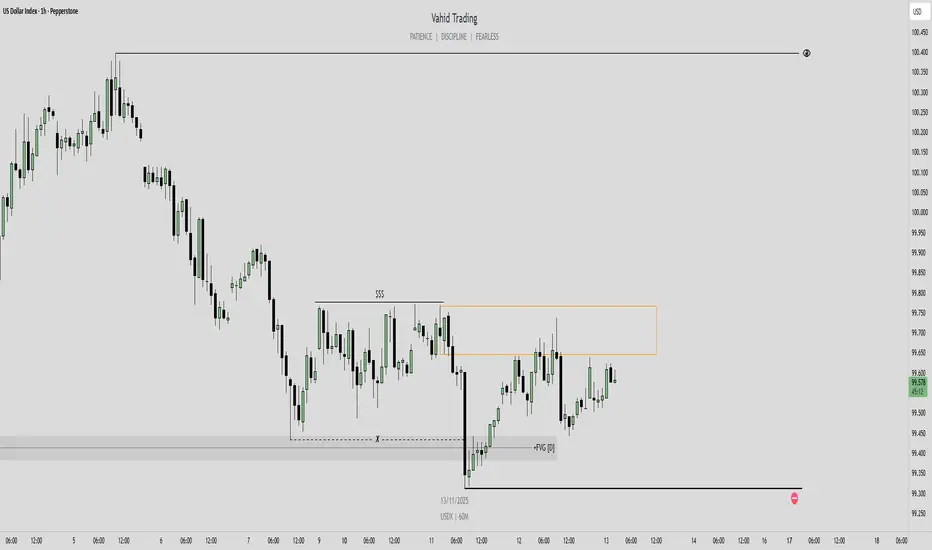
DXY Selling Idea before huge buys After years trying to understand the Forex Market, this is my next trading idea using Wyckoff Schematic Drawings. Only learnt about this this year. So lets break it down to understand this theory in Monthly Time Frame on DXY Dollar Index Chart.
Spring Theory is Three SC Sell Climax being done before the buy setup, Meaning?
After first SC then an ST Secondary Test of the low..Two SC must be reated before the buys. Posted chart just as a guide and analysis of Wyckoff Theory.
First SC @$78.00 Second SC @$71.13 Third SC should be around $64.00/$65.00 area.
Then to buy up taking out BS Buy Climax areas @$121.00 and $114.00 area to creat new HH Higher highs around $126.00 and $136.00 area. For now Sells are in play which is good oppounity on long term to buy Forex pairs like EURUSD and GBPUSD.

DXY LOCAL SHORT|
✅DXY rejects a premium-zone supply block, with intraday structure shifting bearish after collecting liquidity above recent highs. A drawdown toward the inefficiency below remains likely as momentum weakens. Time Frame 1H.
SHORT🔥
✅Like and subscribe to never miss a new idea!✅

DXY 4H🔹 Overall Outlook and Potential Price Movements
In the charts above, we have outlined the overall outlook and possible price movement paths.
As shown, each analysis highlights a key support or resistance zone near the current market price. The market’s reaction to these zones — whether a breakout or rejection — will likely determine the next direction of the price toward the specified levels.
⚠️ Important Note:
The purpose of these trading perspectives is to identify key upcoming price levels and assess potential market reactions. The provided analyses are not trading signals in any way.
✅ Recommendation for Use:
To make effective use of these analyses, it is advised to manually draw the marked zones on your chart. Then, on the 15-minute time frame, monitor the candlestick behavior and look for valid entry triggers before making any trading decisions.

Dxy showing signs of bears power Dxy have gotten below 98.907 level which indicates that the bears are still in charge so we are looking at shorts again
GOLD HEADING TO 4270? NOVEMBER 11 2025This is my view on the GOLD this week
After 3 failed rally by gold and the fake breakout of 4110 today; we could see gold rejoining the broken resistance at 4220 and rally up to 4270, a key level where we may see a second selloff of the commodity
Key level / buy entry 4128 / 4116
Target: 4240 / 4270

Shutdown Ended, What Is Next for the US Dollar?US shutdown ended after 43 days and set a new record. During the shutdown, a lot of economic data could not be released, and the lack of government spending caused a limited liquidity shortage. Now that the shutdown has ended, what is next for the US dollar?
US economy is expected to be hit by the shutdown in the fourth quarter. The impact is estimated to be around 1.5 percent on an already weakening economy. Over the last 25 years, annualized quarterly GDP growth has averaged 2.3 percent. Since 2021, US GDP rose above this average on a yearly basis. GDP was 2.8 percent in 2024, and this year it is expected to fall to 1.9 percent, below the long-term average, and it could drop further because of the shutdown. Growth in 2026 is also expected to be weak, with a forecast of only 1.8 percent.
While GDP is weakening, inflation forecasts still point to a near 3 percent pace, which is somewhat high in our view. This will keep the FED busy. Inflation implies a weaker currency unless supported by high rates. The FED has a dual mandate and cannot overlook the weakening GDP and softening labor market, so despite elevated inflation risks, rate cuts will continue. This will put ongoing pressure on the dollar, at least first half of 2026.
Dollar performance cannot be assessed without considering the euro, since 57.6 percent of the dollar index is tied to it. The eurozone is also expected to stay below its 25-year average growth rate of 1.32 percent. A 1.10 percent GDP rate with inflation below 2 percent is acceptable for the ECB. While the FED will be cutting rates, the ECB will likely hold, as Lagarde said in the latest press conference: “We are in a magnificent place.”
For the short term, the dollar is about to break its trend channel to the downside. Economic data from the US is expected to come in very weak. With expectations of weak data and easing liquidity problems, short-term downward pressure could push the index to 98.55 first. Below that initial support, the selloff could deepen. However, the long-term trend from 2011 is still holding(white trend).

DXY – Watching for Bullish Shift Above 99.765Hello traders,
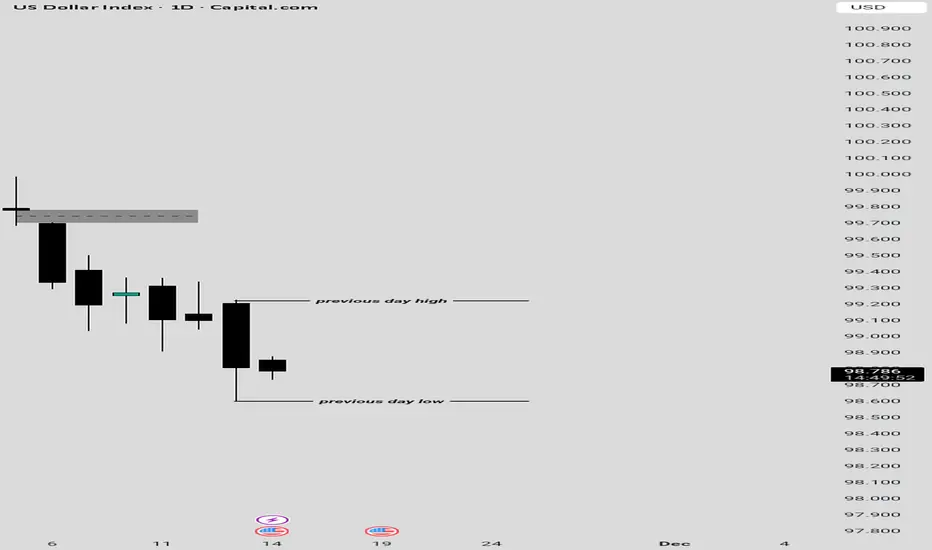
The Dollar Index (DXY) has completed a deep retracement — over 50% of the previous bullish leg — tapping into the daily bullish Fair Value Gap (FVG) and showing a bullish reaction from that area.
At this stage, if the market can hold Tuesday’s low and break above 99.765, it would confirm a bullish momentum shift, opening the path toward the next liquidity level at 100.397 as my main target.
However, if the price breaks below Tuesday’s low, this bullish scenario becomes invalid, and further downside movement could be expected.
Simple structure — just waiting for confirmation of direction. 📈
Dxy continuous movement to the upside This is the Dxy chart........
The Dxy found it difficult to move below the 98.900 level we have a slight strong hindsight that the algorithm is trying to take a push to the upside...... tomorrow will give us the final say if the market will get above 99.400 level
Markets to look at
Gbpusd.............bearish
Eurusd ..............bearish
Usdchf...............bullish

Trump leaving office - Political risk rises after Epstein emailsJeffrey Epstein allegedly claimed that Donald Trump spent hours in a house with one of the late trafficker’s victims and suggested the U.S. President was aware of his activities, according to an email released by congressional Democrats.
Will this latest scandal be enough to take Trump out of office? Probably not, but there is a non-zero chance still right.
For now, the potential end of the government shutdown appears to be overshadowing any market reaction. Still, traders shouldn’t overlook what a change in leadership could mean.
Last week, we explored how a J.D. Vance presidency might reshape U.S. markets by challenging corporate monopolies and potentially strengthening the dollar. The same logic applies here: if Trump were to lose the presidency, markets could quickly begin pricing in the next administration’s economic outlook.

Dollar Decision TimeDollar is about to decide to rally and target over 101 or go back to the blue, long term trend that started in 2011 and test it again. This week, it will be decision time for dollar and all the markets.

DXY Bullish Momentum Builds | Midweek Dollar Outlook 11/12/25The DXY remains bullish so far this week. In this midweek outlook, we break down key support and resistance levels, trend momentum, and what to watch heading into the weekend.
USDCAD/USDCHF/USDJPY: Looking for bullish moves
AU/EU/GU/NU: Looking for bearish moves

DXY idea 12.11.2025For the dollar index, I think that if the price breaks through the golden pocket, the price could reach the level of 100-100.5, which would be an ideal opportunity for a short from a confluence perspective. There is a weekly level and a value high here, and there is also a fibo of 0.786. For a long, I would see potential around the price of 97.7, where the wvap daily level and fibo of 0.382 are located nearby, for a broader context.

DXY (USD)Expecting upside continuation. We can see on HTF we have Bullish MS, with HH & HL formation.
Fundamentals:
- Rate cuts bets faded.
- Oct FOMC, Powell slightly less dovish to Hawkish tone - want to be cautious with future rate cuts & want to be data dependant.
- Dec rate cut probabilities dropped from 95% chance to 63% chance.
This means that US yields remain high, less investor outflow because of interest rate differentials, therefor we can see USD upside.
The only think thats probably impacting it is the US lockdown, and is now the longest ever, therefor investors still cautious as they would like to see data before we can see big drivers.

The dollar softens as weak data boosts Fed rate-cut expectations
According to ADP data, US companies laid off an average of 11,250 employees per week in October, reaffirming how quickly labor market conditions have softened over the past two weeks.
Meanwhile, the NFIB Small Business Optimism Index fell for a second straight month to 98.2 (prev. 98.9, cons. 98.3), marking the lowest level since April’s reciprocal tariff announcement. The NFIB noted that the government shutdown and tariffs have weighed on business sales.
The dollar may stay range-bound, awaiting fresh price catalysts between hopes for a shutdown resolution and further Fed rate cuts.
DXY briefly tested the ascending channel's lower bound before rebounding slightly. The index remains between both EMAs, suggesting a potential extension of the consolidation trend.
If DXY closes above EMA21, the index may advance toward the following resistance at 99.80.
Conversely, if DXY breaks below EMA78 and the support at 99.50, the price could fall below the channel’s lower bound.

Anticipating Dollar to go lowerbased of the daily and weekly its pushing down for corrections and filling in the fvg and sweeping sell side from everyone that still has there stop loss placed below what they believe is "support"

Gold Vs DXYIt means using gold’s price in U.S. dollars as a report card on the dollar (and on paper money in general).
Gold is priced in USD (e.g., $2,000/oz).
If gold goes up a lot vs the dollar, that often signals:
The dollar is losing purchasing power (inflation / debasement fears), or
People are seeking a “safe haven” outside fiat currency.
If gold is weak vs the dollar, it usually means:
The dollar is relatively strong,
Markets are more comfortable holding cash, bonds, or risk assets instead of “hard money.”
So “checking gold against the dollar” is basically asking:
“How much real value does a dollar still buy, measured in something that can’t be printed?”

POTENTIAL BEARS To complement the entire analysis of the major pairs shared on our previous posts, is this dollar index exhibiting a bearish AB D Correction pattern. And therefore we remain dovish.

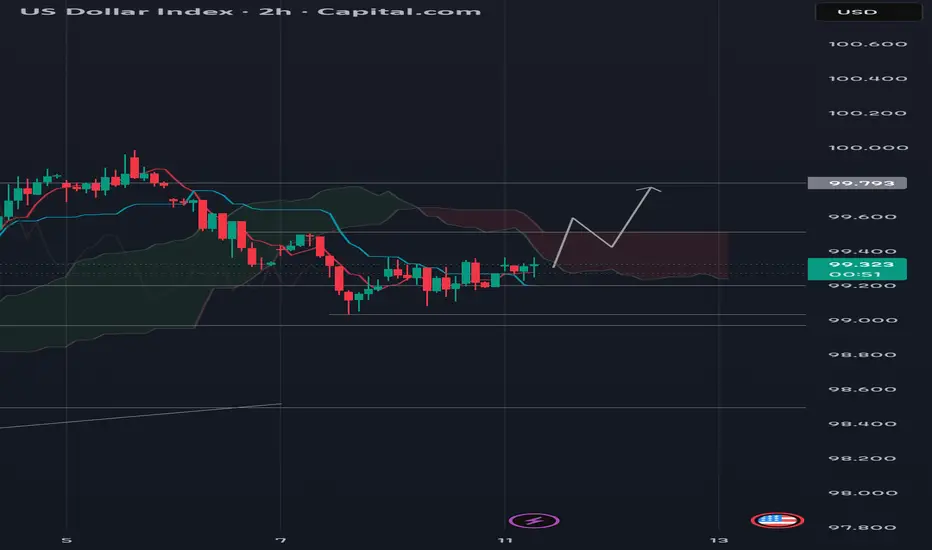
DXY (US Dollar Index) 2h Chart AnalysisThe DXY is currently consolidating in a tight range around the 99.30 mark after the recent move lower.
Current Price : 99.304
Key Support : The level around 99.00 looks like the next major psychological support.
Key Resistance: Bulls are currently gaining momentum but need to clear the upper bound of the recent consolidation, specifically the 99.40 - 99.50 area, to negate the short-term bearish pressure.
We are waiting for a breakout. A sustained break above 99.50 could see a retest of 99.80 - 100.00. A definitive move below 99.00 opens the door for a deeper correction towards the 98.80 area.
Bullish bounce off 50% FIbonacci support?Dollar Index (DXY) has bounced off the pivot and could rise to the 1st resistance, which acts as a swing high resistance.
Pivot: 99.41
1st Support: 99.13
1st Resistance: 100.29
Disclaimer:
The above opinions given constitute general market commentary, and do not constitute the opinion or advice of IC Markets or any form of personal or investment advice.
Any opinions, news, research, analyses, prices, other information, or links to third-party sites contained on this website are provided on an "as-is" basis, are intended only to be informative, is not an advice nor a recommendation, nor research, or a record of our trading prices, or an offer of, or solicitation for a transaction in any financial instrument and thus should not be treated as such. The information provided does not involve any specific investment objectives, financial situation and needs of any specific person who may receive it. Please be aware, that past performance is not a reliable indicator of future performance and/or results. Past Performance or Forward-looking scenarios based upon the reasonable beliefs of the third-party provider are not a guarantee of future performance. Actual results may differ materially from those anticipated in forward-looking or past performance statements. IC Markets makes no representation or warranty and assumes no liability as to the accuracy or completeness of the information provided, nor any loss arising from any investment based on a recommendation, forecast or any information supplied by any third-party.

Gbp/Usb bear forecast.Where price is now + DXY show a potential bearish movement on cable and potentailly see DXY send price higher for a premium wick CE may monthly candle. Until i talk to you nexttime God`s willing, Embrace the uncertainty with a cool headed. Thank`s

Day market cautiously adjusts its bullish stance The DXY cautiously maintains its bullish stance, rising 1.52% since the last week of October. With momentum building, the index now sets its path toward mitigating the 101.000 level, signaling continued dollar resilience amid shifting market conditions. follow for more insights , comment and boost idea

DXY Potential Longs To 100.360DXY Has retraced to the key level that I anticipated at the start of last week , i am now anticipating potential longs to run above 100.360.
I noted a good initial reaction at the anticipated key level , i will now be looking for opportunities to go long.
