DXY – Big Week Ahead, Watch These Zones-Dollar still stuck in a range. No need to guess, just watch the heavy levels:
-96.66 = bullish liquidity zone
-99.80 = bearish liquidity zone
-This week is packed with heavy news:
-NFP Friday – jobs report could shake markets hard
-Fed credibility under fire – politics trying to pressure the central bank
-Be careful with dollar pairs — market makers love stop hunts around news.
Best to stay patient → let price show which zone breaks first.
DX.F trade ideas

The DXY chart for my EURUSD & EURFUTURES tradeCant see it all but theres a perfectly formed very long leg which is 200 bars long and 1000pips, then a perfectly formed 12hr ascending flag, 3 different trendlines which have even HH HLs on 2 of them, and lastly a 2hr support turned resistance entry at the 12hr flag retest after the breakout.

US job numbers this week. Keeping an eye on USD and US indicesWe are keeping a close eye on the US job numbers this week, as those fall into the Fed's spotlight. The expectations are low, so it would be interesting to see if the numbers can get even lower. Let's take a look.
MARKETSCOM:DOLLARINDEX
FX_IDC:EURUSD
Let us know what you think in the comments below.
Thank you.
75.2% of retail investor accounts lose money when trading CFDs with this provider. You should consider whether you understand how CFDs work and whether you can afford to take the high risk of losing your money. Past performance is not necessarily indicative of future results. The value of investments may fall as well as rise and the investor may not get back the amount initially invested. This content is not intended for nor applicable to residents of the UK. Cryptocurrency CFDs and spread bets are restricted in the UK for all retail clients.

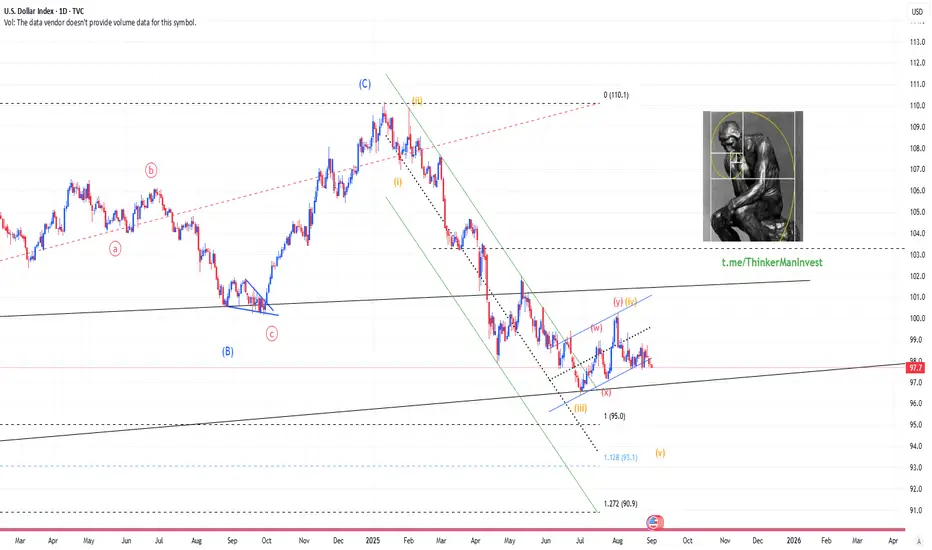
DXY Forecast: H&S Continuation Pattern?The DXY rebound between July and August has shaped a head and shoulders pattern. The chart is now testing the downside breakout, with the daily RSI turning bearish and slipping below the 50 level. A clean break below the 97.50 support could extend losses toward 97.20 and 96.50, with the full head and shoulders pattern pointing to a potential move down toward the 95.00–94.50 zone.
On the upside, a rebound above the 98.00 level would suggest some bullish recovery. However, a sustained move above 100.20 is needed to confidently shift the outlook toward a longer-term bullish reversal.
Key Events This Week
• ISM PMIs: to clarify US economic activity (Tuesday–Thursday)
• US NFPs and their impact on rate cut expectations and DXY price action (Friday)
• Effects of US trade and legal developments, EU political shifts, and Middle East escalations on risk sentiment
- Razan Hilal, CMT

DXY | 1SPT directional sentiment (SMC)“DXY moving like it just clocked in for a Monday shift 🥱📉… got smacked with that Friday LQC and now stumbling down to 97.100 like it’s chasing a Black Friday discount 🛒. Daily bias still bearish, 4H looking weak, and on the 1H the bulls tryna flex but only after sweeping some liquidity 🐂➡️🚪.
If price taps back into that chef’s POI kitchen 🍳 and fails to hold, the bears finna drag this straight to the basement 📉🐻. Until then, we vibin’ in discount land waiting for confirmation signals. This POI remains the make-or-break zone 🧩 heading into the next sessions.”**

Title: USDX 4H — expectations vs realityThe dollar index once again finds itself in a position where heroic posture doesn’t match reality. Price is capped at 97.85 right at the 0.382 Fibonacci level and every move higher quickly fades like a spark in the rain. If the breakout fails the road towards 97.24 and 96.90 seems far more realistic since the 0.618 retracement and demand zone are located there.
Moving averages are pressing from above, volumes don’t support the bulls and technically the setup favors weakness rather than strength.
Watching USD behavior every dip in gold silver euro and pound becomes a clear swing trading buy opportunity.
Fundamentally the dollar is also under pressure as markets expect a dovish Fed, Treasury yields stay weak and risk appetite drives capital into other assets. In the end the greenback looks more like a tired runner than a sprinter ready to race.

DXYThe U.S. Dollar Index (DXY) is currently exhibiting a bearish trend, driven by a combination of dovish Federal Reserve expectations, weakening economic confidence, and technical breakdowns. Market sentiment has shifted toward potential rate cuts, with investor concerns over the Fed’s independence and rising U.S. fiscal risks adding further pressure.

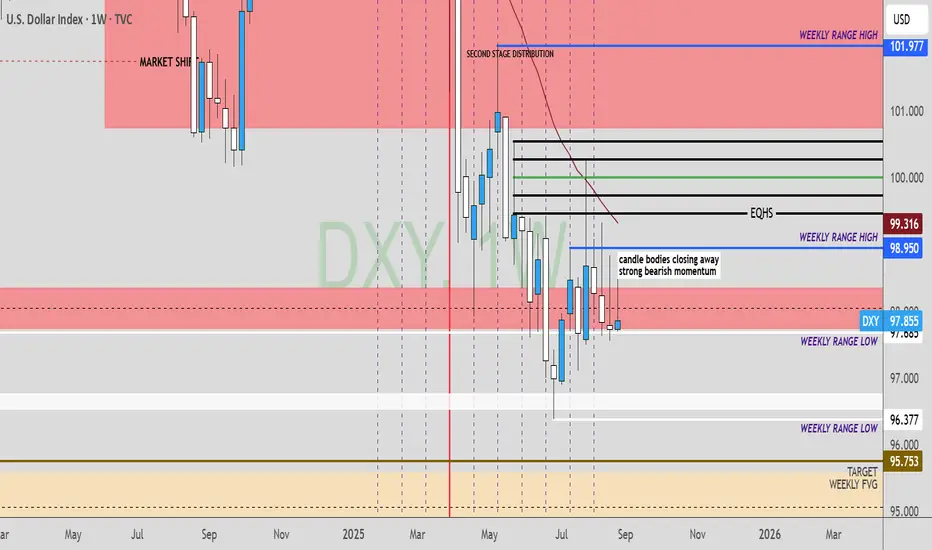
DXY Weekly Price Forecast DXY has been moving sideways - Caution trading this week wait for proper weekly candle body closes before looking for a directional bias

DXY :Signs of weakness towards support at 95, even 91DXY:
Signs of weakness towards support at 95, even 91 are gradually becoming evident.
With this scenario, it will be a bad scenario for gold, gold will increase in price to other very high levels.
Forex Weekly Review: Fundamental analysis. USD to weaken? The week starting Monday 25 August ended where it began, with roughly an 85% likelihood of a September FED rate cut.
There was a lot of external noise in-between. But all the while, the currencies 'movement' remained fairly muted.
Given the reaction to chair Powell's speech the previous Friday, I was quite surprised by the USD strength on Monday.
Throughout the week, we did get a few 'events', namely Mr Trump 'firing' FED member cook, whilst simultaneously stirring the tariff pot. The firing of COOK is an interesting one as it brings into question the FED's independence and is a scenario that could rumble on for a while. We also got 'discouraging' forward guidance from NVIDEA. On another week, all of these narratives would have 'likely' spurred 'sour sentiment'. But any moves were muted, which I put down to many traders being away on 'summer breaks', the fact the VIX hovered around 15 all week (despite the negativity) backs up this theory.
In other news, we did a bit of 'action,' on Monday when political uncertainty in France weakened the EUR. And on Friday 'in line with expectations' US PCE data (eventually) weakened the USD. The theory being inflation is still benign enough for the FED to cut rates in September.
Finally, 'soft' CAD GDP data keeps a BOC September rate cut firmly on the table.
On a personal note, I only really perceived two opportunities all week, the EUR weakness on Monday (which I didn't trade) and the USD opportunity on Friday (GBP USD long). Although that was a tricky one because the dollar did initially strengthen on the headline. We only saw the 'true reaction' once the US market opened.
Throughout the week, I did find myself a little frustrated with the lack of my perceived opportunities over the last few weeks, I'm very intrigued to see if volume picks up once 'institutional traders' return to their desks.
I begin the new week with my 'risk on' bias in tact (particularly following weekend news of a supreme court tariff ruling). But I suspect the narrative surrounding the US jobs market could play a big role this week.
Results:
Trade 1: GBP USD +1.2
Total = +1.2%

DXY Outlook – Bearish Lean, Choppy SetupDollar had a hard run the last three weeks with heavy bearish candles on the weekly. Price action has been messy, not easy to just get in and ride. My bias is still bearish, but I’m also looking at the bigger picture.
On the monthly chart, key distribution sits under 94.095 and we haven’t reached it yet. Over the last two months price has been filling the bullish order block around 95.971 order block on the dollar index. If the market maker decides to move, it could go fast once the data lines up, whether in the first or second week.
Right now we are sitting in a bearish volume channel lower end. Selling late is not smart because most of the move has already passed. That doesn’t mean there are no trades, but it does mean higher frequency and tighter risk until the next clear setup.
From the economic side the jobs data is weak with only 73K added last month, which keeps pressure on the Fed to cut. The Fed is also seen as politicized, which hurts credibility and weighs on the dollar. Markets are already pricing a September cut and analysts are leaning bearish. At the same time inflation is still sticky near 2.9 percent while jobs are slowing, which leaves the Fed boxed in. Headline PCE is flat, not strong enough to flip hawkish and not weak enough to go fully dovish. That mix can trap the dollar between 97 and 100 until one side breaks.
Best move is to keep watching the data closely before trading dollar markets. Bias stays bearish, but chop risk is high.

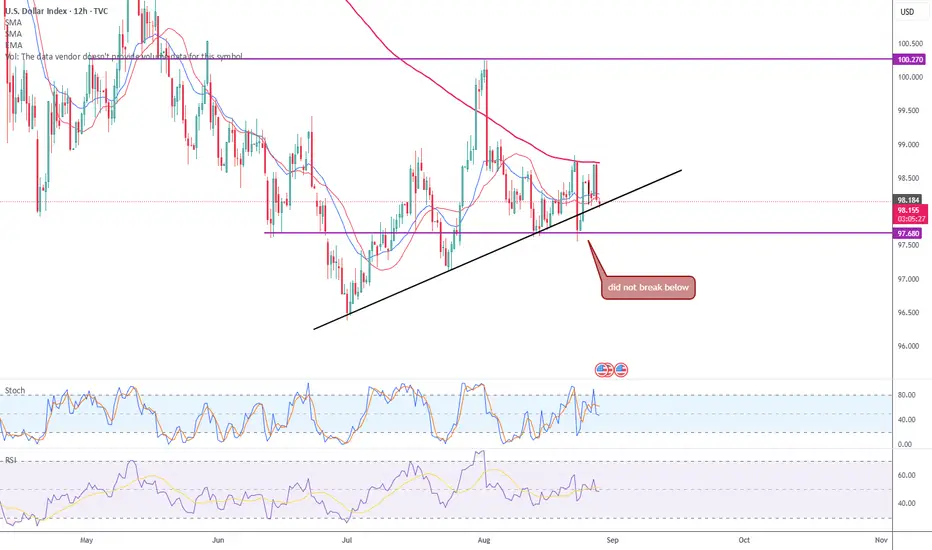
LIQUIDITY SWEEP ON DXY BEFORE FALLINGIn this weekend dollar index analysis presentation, my thesis is sideways liquidity sweep before a daily bear flag breakout to the downside. Momentum and RSI on the higher timeframe are still to downside suggesting more selling. Price is still trapped below all our moving averages confirming our trend bias. On the weekly time frame we have a couple of inverted candles at a fib 0.618 support zone suggesting a likely reversal from a higher low but I think these inverted candles are liquidity sweeps from the 0.382 fib retrace resistance level. The daily chart has a strong shooting star which initiated selling pressure to the current trendline support level at 97.432 where our last daily candle was a doji indecision or pause.
In the coming first trading week of September, I will be watching for clear break of the trendline on the daily chart and a confirmed breakout of the fib 0.618 support zone at 97.187 for an initial target of 96.702 and final target of 96.155.
Thank you and have a great profitable trading new month. Cheers!!

ALLOCATION IN FAVOR OF FOREIGN CURRENCIESDollar Weakness expected to persist into Q4
Weekly draw towards 95.73
-bullish equities
-bullish us2y
-bullish fx
DXY directions I would love to see DXY under 96 it has a lot of SSL on those levels, for this week I will aim to the FVG at 1 hour and then look for short positions aim the PML.

USD/CAD, GBP/USD, EUR/USD Video of my trades last week.My 3rd video explaining my trades for last week 25-29nd August and the week ended with a nice profit of 2.58%.
If you have any questions send me a message here or on X and enjoy the weekend.

All eyes on the PCE todayWatching the US dollar reaction carefully today.
TVC:DXY
MARKETSCOM:DOLLARINDEX
Let us know what you think in the comments below.
Thank you.
75.2% of retail investor accounts lose money when trading CFDs with this provider. You should consider whether you understand how CFDs work and whether you can afford to take the high risk of losing your money. Past performance is not necessarily indicative of future results. The value of investments may fall as well as rise and the investor may not get back the amount initially invested. This content is not intended for nor applicable to residents of the UK. Cryptocurrency CFDs and spread bets are restricted in the UK for all retail clients.


DXY TECHNICAL VIEWA bullish outlook before the drop. We react based on price reactions to related pairs

DXYDXY (US Dollar Index) Analysis
• Daily Timeframe:
The price is moving within a range and currently trading near the support zone.
• 1H Timeframe:
A clear Dow Theory structure is forming as the market continues to make Lower Highs (LHs) and Lower Lows (LLs).
• Expectation:
There is a high probability that the price may continue downward to test the support level.
Trading Idea:
You can look for a short-term sell entry towards the support area with a 1:1 risk-to-reward ratio
Conclusion: If the support breaks, further bearish continuation is likely. However, if the support holds, a potential reversal can be expected.

DXY BullishDollar index was showing some downward trend but now there is bullish divergence and we can take buy entry for some good gains keeping the last low as stop loss.

EURUSD and DXY - Reading Instituitonal Order FlowHi there,
It's been a while since my last post. Just catching up on my favourite pair, the EURUSD, and of course not missing out on the DXY for comparative analysis as it is heavily tied to the strength of the EURUSD.
For those new, these are ICT Concepts, with my own touches in it. Hope you enjoy
Happy trading!
- R2F Trading

DOLLAR INDEX (DXY)DXY (WEEKLY CHART)
DOLLAR INDEX:
Current rates are clear now in the US. Rates are very close to fair value on the US Treasury market. I’m in the waiting books on this one, another long term year(s) to invest here. Technicals show, there is some sellside liquidity to sweep.
- C.N Skolo
(Journal FX Charts)
