DXY LONG SETUPDXY is on a good zone for a potential swing buy again .. we can use it as a cross reference in shorting order USD quote pairs..
DX.F trade ideas

DXY Analysis – Aug 17, 2025Last week, we expected a short-term retracement towards 98.8 to clear liquidity before heading back to 99.6.
However, selling pressure turned out to be stronger than anticipated, and price failed to deliver that move.
This week, we expect sell orders to be triggered slightly lower, around the 98 – 98.1 zone.
At the same time, the bullish levels we highlighted last week no longer hold the strength to support a recovery.
📉 As a result, a new bearish leg could be forming, with the next downside target set at 95.0.

Bearish drop?US Dollar Index (DXY) is reacting off the pivot, which acts as an overlap resistance and could drop to the 1st support.
Pivot: 98.27
1st Support: 94.66
1st Support: 94.66Risk Warning:
Trading Forex and CFDs carries a high level of risk to your capital and you should only trade with money you can afford to lose. Trading Forex and CFDs may not be suitable for all investors, so please ensure that you fully understand the risks involved and seek independent advice if necessary.
Disclaimer:
The above opinions given constitute general market commentary, and do not constitute the opinion or advice of IC Markets or any form of personal or investment advice.
Any opinions, news, research, analyses, prices, other information, or links to third-party sites contained on this website are provided on an "as-is" basis, are intended only to be informative, is not an advice nor a recommendation, nor research, or a record of our trading prices, or an offer of, or solicitation for a transaction in any financial instrument and thus should not be treated as such. The information provided does not involve any specific investment objectives, financial situation and needs of any specific person who may receive it. Please be aware, that past performance is not a reliable indicator of future performance and/or results. Past Performance or Forward-looking scenarios based upon the reasonable beliefs of the third-party provider are not a guarantee of future performance. Actual results may differ materially from those anticipated in forward-looking or past performance statements. IC Markets makes no representation or warranty and assumes no liability as to the accuracy or completeness of the information provided, nor any loss arising from any investment based on a recommendation, forecast or any information supplied by any third-party.

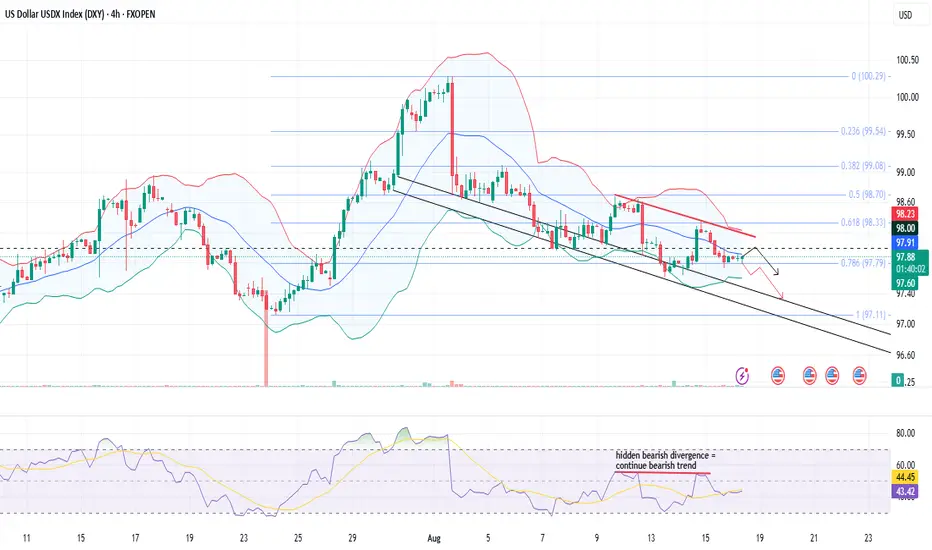
DXY Comprehensive AnalysisThe US Dollar Index (DXY) on the 4H chart remains under pressure, trading near 97.71 and holding below the key resistance zone of 98.20–98.30, aligned with the 20 SMA (middle Bollinger band) and 0.786 Fibonacci retracement (97.78), signaling a firm bearish bias.
Price action might continue to respect the descending trend, with recent candles showing rejection from the upper boundary and pointing toward a possible retest of 97.50–97.10 support levels. However, it will be crucial for prices to breach the fib level 0.786 and sustain lower.
Bollinger Bands are moderately compressed, suggesting controlled volatility, while RSI at 42 indicates weak momentum with a hidden bearish divergence (prices making lower highs and RSI making constant highs), reinforcing downside potential.
Unless the index reclaims 98.30 on strong buying, intraday traders may look for short opportunities on pullbacks, targeting 97.50 and then 97.10.
With no major data releases today, technical levels are likely to drive moves, and continued dollar weakness could support risk assets like equities and commodities, particularly gold and emerging market currencies.
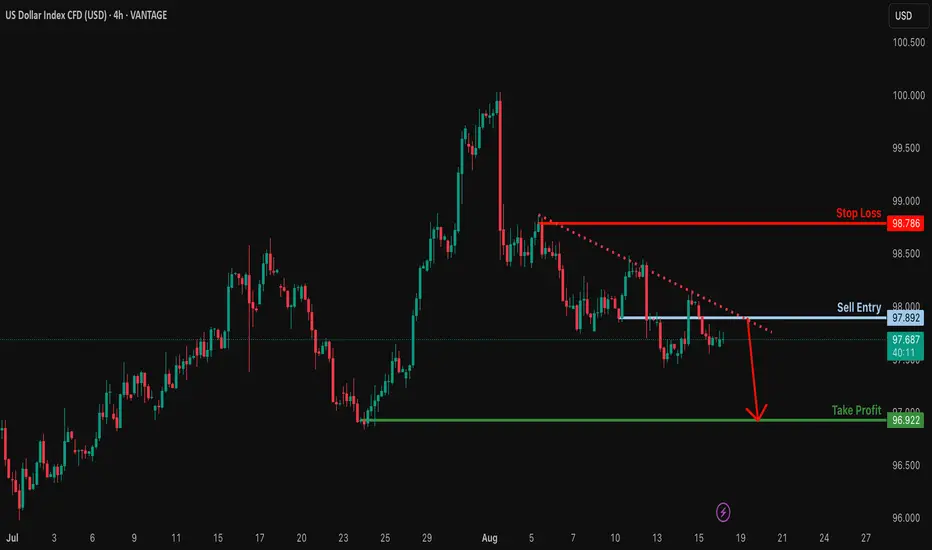
Potential bearish drop?USDX is rising towards the resistance, which is a pullback resistance, and could drop from this level to our take-profit.
Entry: 97.89
Why we like it:
There is a pullback resistance.
Stop loss: 98.78
Why we like it:
There is a pullback resistance.
Take profit: 97.92
Why we like it:
There is a swing low support.
Enjoying your TradingView experience? Review us!
Please be advised that the information presented on TradingView is provided to Vantage (‘Vantage Global Limited’, ‘we’) by a third-party provider (‘Everest Fortune Group’). Please be reminded that you are solely responsible for the trading decisions on your account. There is a very high degree of risk involved in trading. Any information and/or content is intended entirely for research, educational and informational purposes only and does not constitute investment or consultation advice or investment strategy. The information is not tailored to the investment needs of any specific person and therefore does not involve a consideration of any of the investment objectives, financial situation or needs of any viewer that may receive it. Kindly also note that past performance is not a reliable indicator of future results. Actual results may differ materially from those anticipated in forward-looking or past performance statements. We assume no liability as to the accuracy or completeness of any of the information and/or content provided herein and the Company cannot be held responsible for any omission, mistake nor for any loss or damage including without limitation to any loss of profit which may arise from reliance on any information supplied by Everest Fortune Group.
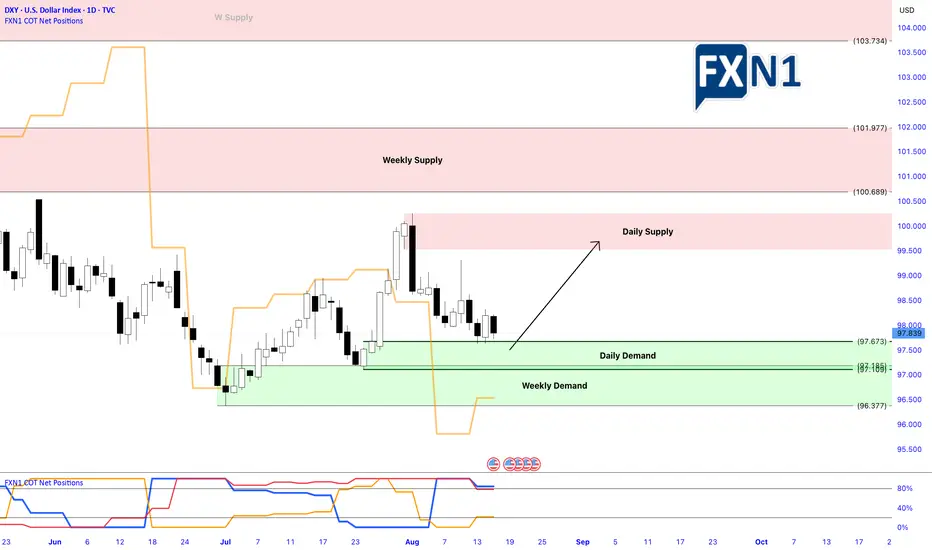
DXY:Key Levels and Political Events: Preparing for the Next MoveThe latest Commitment of Traders (COT) report indicates that there have been negligible changes in the behavior of commercial traders regarding the DXY. Meanwhile, retail traders have significantly reduced their long positions, cutting about 30% of their holdings to the short side. In contrast, non-commercial traders have increased their long positions by approximately 11.14%, suggesting a divergence in market sentiment: retailers appear to be leaning toward shorting the dollar, while non-commercials might be starting to accumulate long positions.
Over the past week, the price rebounded at our daily demand zone, which could signal a potential continuation of the upward trend in the coming week. However, the market's next move will depend heavily on how it opens after the weekend and the market's reaction to the upcoming Trump-Putin meeting.
What are your thoughts on these developments?
✅ Please share your thoughts about DXY in the comments section below and HIT LIKE if you appreciate my analysis. Don't forget to FOLLOW ME; you will help us a lot with this small contribution.
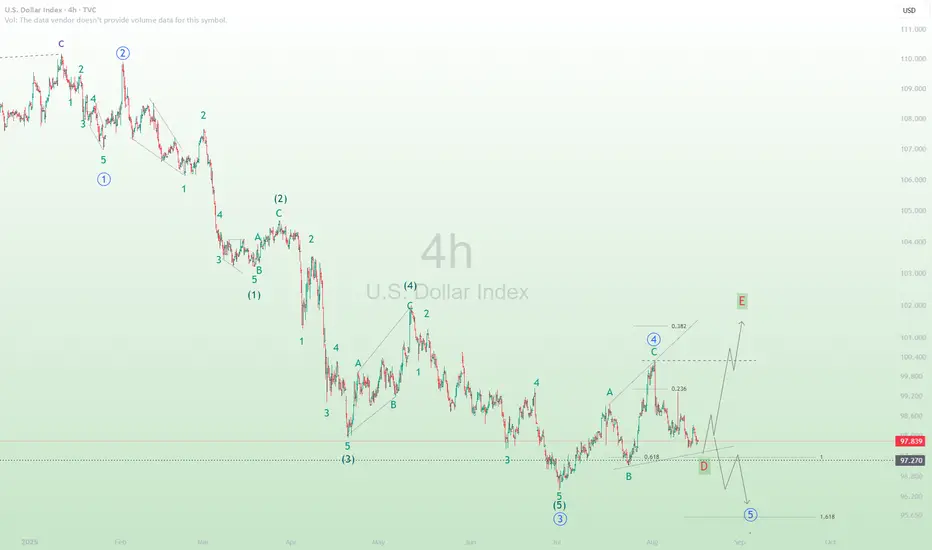
DXY Index: Wave 4 needs confirmation.The DXY index already completed wave C and moved near to the level of wave B.
If wave 4 in the blue circle is completed, the sub-wave B will be broken soon to complete the wave 5 in the blue circle.
If the pattern of wave 4 is going to be an expanded triangle, we can see wave D and wave E to finalize wave 4 in the blue circle.
This is only my view of EW for DXY. I may be wrong.
# DXY (US Dollar Index) Technical Analysis & Forecast# DXY (US Dollar Index) Technical Analysis & Forecast
**Base Price:** 97.839 (August 16, 2025 - 12:55 AM)
## Executive Summary
The DXY at 97.839 shows the USD in a consolidation phase near key technical levels. Multiple analytical frameworks converge around critical support/resistance zones, suggesting an imminent directional breakout within the next trading sessions.
## Japanese Candlestick Analysis
### Intraday Patterns (5M-1H)
- **Current Formation:** Doji-like indecision around 97.85 level
- **Key Reversal Zones:** 97.50 (Hammer potential), 98.20 (Shooting Star zone)
- **Momentum Candles:** Watch for Marubozu above 98.00 or below 97.60
- **Evening Star Setup:** Three-candle reversal pattern completion around 98.15
- **Morning Star Potential:** Bullish reversal signal near 97.45 support
### Swing Patterns (4H-Monthly)
- **Engulfing Patterns:** Critical at 98.50 weekly resistance and 97.00 monthly support
- **Harami Cross:** Indecision pattern suggesting range-bound action
- **Piercing Line/Dark Cloud:** Key reversal patterns at major S/R levels
- **Three White Soldiers:** Bullish continuation above 98.00
- **Three Black Crows:** Bearish breakdown below 97.50
## Harmonic Pattern Analysis
### M & W Formations
- **Double Top (M):** Resistance confluence at 98.80-99.00 zone
- **Neckline:** Critical break level at 97.25 for M-pattern completion
- **Double Bottom (W):** Support structure around 96.50-96.80
- **W-Pattern Target:** Bullish objective at 99.20-99.50 on completion
- **Measured Move:** M-top target 96.00, W-bottom target 99.00
### ABCD Pattern Analysis
- **Bullish ABCD:** Current structure suggests C-point at 97.20, D-target 99.80
- **Bearish ABCD:** Alternative count with D-wave completion at 96.20
- **AB=CD Equality:** Time and price symmetry around 98.25 pivot
- **Extension Ratios:**
- 127.2% extension at 99.45
- 161.8% extension at 100.20
- 200% extension at 101.50
## Elliott Wave Analysis
### Primary Count
- **Current Position:** Wave 4 correction of larger degree impulse from 94.50
- **Wave Structure:**
- Wave 1: 94.50 → 96.80
- Wave 2: 96.80 → 95.20
- Wave 3: 95.20 → 98.90
- Wave 4: 98.90 → 97.20 (current)
- Wave 5 Target: 100.50-101.20
### Alternative Count
- **ABC Correction:** Large degree correction from 105.00 highs
- **A-Wave:** 105.00 → 100.80
- **B-Wave:** 100.80 → 99.20 (current)
- **C-Wave Target:** 94.00-95.50
### Time Projections
- **Wave 4 Completion:** 3-5 trading days
- **Wave 5 Duration:** 8-13 days
- **Cycle Completion:** 21-34 days
## Wyckoff Analysis
### Market Structure
- **Phase:** Late accumulation or early distribution
- **Trading Range:** 97.00-99.00 (established range)
- **Point of Support (PS):** 97.20 level
- **Secondary Test (ST):** Current price action around 97.85
- **Sign of Strength (SOS):** Break above 98.50 with volume
- **Last Point of Support (LPS):** Final test around 97.40
### Volume Characteristics
- **Accumulation Signals:** High volume on declines, low volume on rallies
- **Distribution Signals:** High volume on rallies, climactic action above 98.50
- **No Demand:** Weak rallies with declining volume
- **Stopping Volume:** Heavy volume at support levels
## W.D. Gann Theory Analysis
### Time Theory
- **Natural Cycles:** 30, 60, 90, 120-day cycles active
- **Anniversary Dates:** Previous major highs at 105.00 (time squares)
- **Seasonal Pattern:** USD strength typically in Q3-Q4
- **Time Windows:**
- Minor: 7-10 days
- Intermediate: 21-30 days
- Major: 90-120 days
### Square of 9 Analysis
- **Current Position:** 97.839 sits at 347° on the wheel
- **Key Angles:**
- 0°/360°: 98.00 (major resistance)
- 45°: 97.20 (support)
- 90°: 98.80 (resistance)
- 180°: 96.40 (major support)
- 270°: 99.60 (major resistance)
### Price Targets from Square
- **Bullish Targets:** 98.44, 99.25, 100.69
- **Bearish Targets:** 97.21, 96.49, 95.36
### Angle Theory
- **1x1 Angle:** Primary trendline from 94.50 low at 97.60
- **2x1 Angle:** Acceleration line at 98.20
- **1x2 Angle:** Support line at 97.00
- **Fan Lines:** Multiple confluence zones at 97.25, 98.15, 99.05
### Squaring Price and Time
- **Price Squares:** 97.00, 98.00, 99.00, 100.00
- **Time Squares:** 144 hours (6 days), 233 hours (10 days)
- **Geometric Harmony:** 50% level at 97.50, 62% at 98.10
## Ichimoku Kinko Hyo Analysis
### Cloud (Kumo) Analysis
- **Current Position:** Price trading above cloud (bullish bias)
- **Cloud Support:** 97.20-97.40 zone
- **Future Cloud:** Bearish twist in 26 periods around 98.60
- **Cloud Thickness:** Medium strength S/R levels
### Signal Line Analysis
- **Tenkan-sen (9):** 97.75 - short-term momentum line
- **Kijun-sen (26):** 97.55 - medium-term trend line
- **Senkou Span A:** 97.65 (leading span)
- **Senkou Span B:** 97.30 (leading span)
- **Chikou Span:** Confirming current price action strength
### Trading Signals
- **TK Cross:** Tenkan above Kijun (weak bullish)
- **Price vs Kijun:** Above baseline (bullish bias)
- **Cloud Break:** Monitor 97.20 break for bearish signal
## Technical Indicators Analysis
### RSI (Relative Strength Index)
- **14-Period RSI:** 52.8 (neutral zone)
- **Overbought Level:** >70 (watch 98.20+ levels)
- **Oversold Level:** <30 (watch 97.00- levels)
- **Divergence Signals:** Hidden bullish divergence on 4H timeframe
- **Trend Confirmation:** Break above 55 confirms bullish momentum
### Bollinger Bands
- **Upper Band:** 98.45 (immediate resistance)
- **Middle Band (20 SMA):** 97.80 (dynamic support/resistance)
- **Lower Band:** 97.15 (immediate support)
- **Band Width:** Moderate volatility (expansion expected)
- **Squeeze Indicator:** Potential breakout setup forming
### VWAP Analysis
- **Daily VWAP:** 97.72 (key pivot level)
- **Weekly VWAP:** 97.91 (resistance)
- **Monthly VWAP:** 98.15 (major resistance)
- **Volume Profile:** High volume node at 97.50, 98.10
- **VWAP Deviation:** +1 std dev at 98.20, -1 std dev at 97.30
### Moving Averages
- **SMA 20:** 97.78 (short-term trend)
- **SMA 50:** 97.45 (medium-term support)
- **SMA 200:** 96.80 (long-term bullish above this)
- **EMA 8:** 97.85 (immediate dynamic resistance)
- **EMA 21:** 97.70 (key dynamic support)
- **WMA 10:** 97.82 (weighted recent price bias)
## Multi-Timeframe Analysis
### Intraday Analysis
#### 5-Minute Timeframe
- **Trend:** Sideways with upward bias
- **Range:** 97.75-97.95 immediate trading range
- **Scalping Levels:** Buy 97.78, Sell 97.88
- **Breakout Levels:** Above 97.95 or below 97.75
#### 15-Minute Timeframe
- **Pattern:** Ascending triangle formation
- **Apex:** Around 97.90 level
- **Time Target:** Next 2-3 hours for breakout
- **Volume:** Declining (coiling for move)
#### 30-Minute Timeframe
- **Structure:** Higher lows pattern since 97.20
- **Resistance:** 98.00 psychological level
- **Support:** 97.60 swing low
- **Momentum:** Neutral to slightly bullish
#### 1-Hour Timeframe
- **Trend:** Corrective move within larger uptrend
- **Key Level:** 98.20 hourly resistance
- **Support Zone:** 97.40-97.60
- **Next Move:** 4-6 hour window for direction
#### 4-Hour Timeframe
- **Pattern:** Bull flag consolidation
- **Pole:** Move from 97.00 to 98.90
- **Flag:** Current consolidation 97.20-98.20
- **Target:** 99.80-100.20 on upside break
- **Invalidation:** Break below 97.00
### Swing Analysis
#### Daily Timeframe
- **Primary Trend:** Bullish since July 2025
- **Current Phase:** Healthy pullback/consolidation
- **Key Resistance:** 99.00-99.20 zone
- **Major Support:** 96.80-97.00 zone
- **Expected Duration:** 5-8 trading days
#### Weekly Timeframe
- **Long-term Trend:** Sideways to up since Q2 2025
- **Weekly Range:** 96.50-99.50
- **Momentum:** Neutral with bullish undertone
- **Critical Level:** Weekly close above 98.50
#### Monthly Timeframe
- **Macro Trend:** Recovery from 2024 lows
- **Monthly Resistance:** 100.00-101.00 zone
- **Monthly Support:** 95.00-96.00 zone
- **Cycle Position:** Mid-cycle consolidation
## Key Levels & Price Targets
### Critical Support Levels
1. **97.60** - Immediate support (4H swing low)
2. **97.40** - Minor support (Gann angle)
3. **97.20** - Major support (Ichimoku cloud)
4. **97.00** - Key support (psychological + Wyckoff PS)
5. **96.80** - Weekly support (200 SMA)
6. **96.50** - Monthly support (major swing low)
### Critical Resistance Levels
1. **98.00** - Immediate resistance (psychological + Gann square)
2. **98.20** - Minor resistance (previous swing high)
3. **98.50** - Major resistance (weekly level)
4. **98.90** - Key resistance (recent high)
5. **99.20** - Weekly resistance (harmonic target)
6. **100.00** - Monthly resistance (major psychological)
### Price Projections
#### Bullish Scenario (Probability: 55%)
- **Catalyst:** Break above 98.20 with volume
- **Target 1:** 98.80-99.00
- **Target 2:** 99.50-99.80
- **Target 3:** 100.20-100.50
- **Timeline:** 2-3 weeks
#### Bearish Scenario (Probability: 35%)
- **Catalyst:** Break below 97.40 with volume
- **Target 1:** 97.00-96.80
- **Target 2:** 96.50-96.20
- **Target 3:** 95.80-95.50
- **Timeline:** 1-2 weeks
#### Neutral Scenario (Probability: 10%)
- **Range:** 97.40-98.20
- **Duration:** 1-2 weeks
- **Strategy:** Range trading
- **Breakout:** Eventually expected
## Risk Management Framework
### Position Sizing
- **Conservative:** 1% risk per trade
- **Moderate:** 1.5% risk per trade
- **Aggressive:** 2% risk per trade
### Stop Loss Guidelines
- **Intraday:** 20-30 points from entry
- **Swing:** 50-80 points from entry
- **Long-term:** 100-150 points from entry
### Take Profit Strategy
- **Scale out:** 25% at first target
- **Trail stops:** Above key support/resistance
- **Final target:** Risk-reward minimum 1:2
## Trading Strategies
### Intraday Strategy
- **Long Setup:** Break above 98.00 with volume
- **Entry:** 98.05-98.10
- **Stop:** 97.75
- **Target:** 98.45-98.60
### Swing Strategy
- **Long Setup:** Pullback to 97.40-97.60
- **Entry:** Scale in on support test
- **Stop:** Below 97.00
- **Target:** 99.00-99.50
### Momentum Strategy
- **Breakout Play:** Above 98.50 or below 97.00
- **Volume Confirmation:** Required
- **Follow Through:** Next day continuation
- **Risk:** Tight stops due to false breaks
## Market Outlook Summary
The DXY at 97.839 presents a critical inflection point with multiple technical frameworks suggesting an imminent directional move. The slight bullish bias is supported by:
- Elliott Wave suggesting Wave 5 higher
- Wyckoff accumulation characteristics
- Gann time cycles favoring upward movement
- Ichimoku cloud support holding
However, traders should remain vigilant for:
- False breakouts in current range
- Federal Reserve policy changes
- Global economic developments
- Risk sentiment shifts
**Primary Expectation:** Bullish breakout above 98.20 targeting 99.00+
**Alternative Scenario:** Range continuation 97.40-98.20
**Bearish Scenario:** Break below 97.00 targeting 96.50
*Analysis Date: August 17, 2025*
*Next Update: August 19, 2025*
*Key Event Risk: Federal Reserve communications, Economic data releases*
For those interested in further developing their trading skills based on these types of analyses, consider exploring the mentoring program offered by Shunya dot Trade.(world wide web shunya dot trade)
I welcome your feedback on this analysis, as it will inform and enhance my future work.
Regards,
Shunya.Trade
world wide web shunya dot trade
⚠️ Disclaimer: This post is educational content and does not constitute investment advice, financial advice, or trading recommendations. The views expressed here are based on technical analysis and are shared solely for informational purposes. The stock market is subject to risks, including capital loss, and readers should exercise due diligence before investing. We do not take responsibility for decisions made based on this content. Consult a certified financial advisor for personalized guidance.
DXYDXY needs some more downside before it starts to give us strength.
Disclosure: We are part of Trade Nation's Influencer program and receive a monthly fee for using their TradingView charts in our analysis.

DXY will stay strong this presidential cycleProof is in the pudding. TA shows what it shows. Dollar is dominant. Trump went into power.
We will see what happens.

my view on the DXY for the next trading week 18 Aug / 22 Aug This coming week I expect the DXY Index to text the 98.200 /98.300 resistance and lower to the 97.100 level of support, this is a strong support HOWEVER a close below that will call the next support 96.450
A break of 98.600 will more ikely resume uptrebd to 99.600 - 100.000
Keep always an eye to the DATA released throught the week and enter your tradng positions ALWAYS at support or resistance - this week I will be REACTIVE rather than predictive

DXY Outlook: A Final Dip Before a Major Rip?This is a multi-timeframe analysis of the US Dollar Index (DXY), combining technical structure with the current fundamental landscape. The thesis presents a short-term bearish view for the coming week, followed by a significant mid-term rally, which ultimately may be part of a larger long-term corrective structure.
Analysis Breakdown
1. Short-Term View (Weekly Outlook): Bearish 📉
Technical: On the daily chart, the DXY continues to consolidate within a large symmetrical triangle after a strong bullish impulse. While currently holding the 0.382 Fibonacci support, we could see one final push downwards this week. The target for this dip would be the stronger confluence zone located at the 0.50 Fibonacci retracement level, which aligns perfectly with a key Daily Demand Block. This move would serve to hunt liquidity resting below the triangle's support line before the true direction is revealed.
Fundamental: With a relatively quiet economic calendar early in the week, markets may position themselves ahead of future inflation data. This could provide the window for this final corrective leg down.
2. Mid-Term View (1-3 Month Outlook): Very Bullish 📈
Technical: This is the core of our thesis. We anticipate a strong rejection from the aforementioned 0.50 Fibo / Demand Zone. A confirmed bounce from this area, followed by a decisive daily candle close above the triangle's upper trendline, would signal the end of the consolidation and the resumption of the primary bullish trend. The initial target would be the previous high, with potential to extend further.
Fundamental: This bullish rally would be fundamentally driven by a persistent "higher for longer" interest rate narrative from the Federal Reserve. Any incoming data showing sticky inflation or continued economic strength in the US would act as a major catalyst, forcing the market to price out rate cuts and re-price a strong dollar.
3. Long-Term View (6M+ Outlook): Bearish 📉
Technical: Zooming out, the entire bullish structure we are seeing in 2025 can be interpreted as a large corrective wave within the multi-decade macro downtrend that began post-1985. The anticipated mid-term rally, while significant, would likely find its ultimate peak at a major historical resistance level before the larger structural downtrend resumes.
Fundamental: Long-term headwinds for the dollar remain, including rising US national debt and geopolitical de-dollarization trends. Furthermore, eventual success in curbing inflation would lead to the rate cuts that the current administration is advocating for to boost trade competitiveness, aligning with this long-term bearish view.
Strategic Plan
The immediate strategy is one of patience.
Short-Term: Look for signs of weakness to confirm the dip towards the primary support zone.
Mid-Term: The A++ setup is to wait for a confirmed bullish reversal from the key Demand Zone. A long position would be considered only after a clear breakout of the triangle pattern, targeting the yearly highs. This bullish scenario remains the primary thesis as long as the key demand zone holds.

DXY LONG FROM RISING SUPPORT|
✅DXY is trading in an uptrend
Along the rising support line
Which makes me bullish biased
And the pair is about to retest the rising support
Thus, a rebound and a move up is expected
With the target of retesting the level above at 98.000
LONG🚀
✅Like and subscribe to never miss a new idea!✅

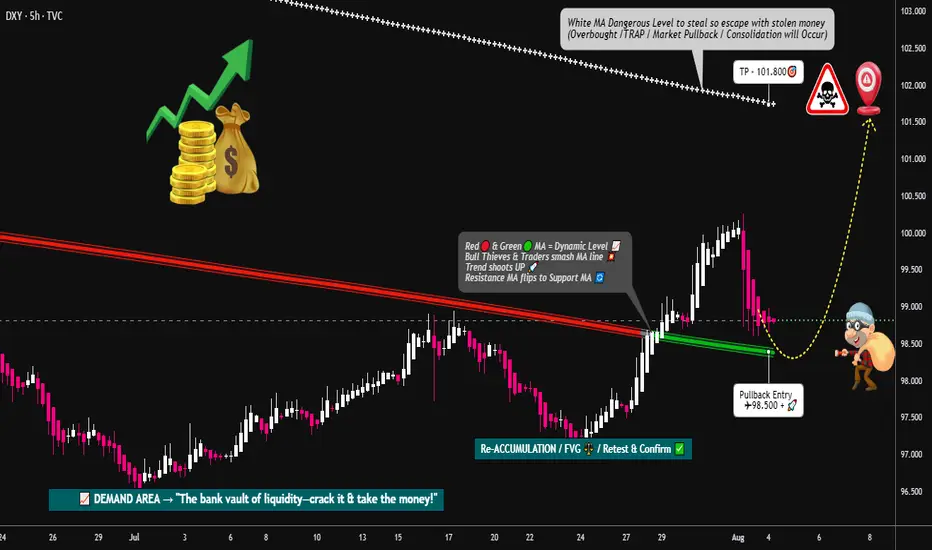
DXY Locked & Loaded: Robber's Gameplan for Profit Pullout💸💼 "DXY Market Heist Blueprint – The Thief's Bullish Escape Plan" 💼💸
Rob the Market, Not the Rules – Trade Smart, Trade Sharp, Trade Thief Style™
🌍 Hey Money Makers, Risk Takers & Market Robbers!
Hola! Ola! Bonjour! Hallo! Marhaba! 🙌
Let’s break into the DXY vault and swipe those profits with precision. 💼💸
🧠💡This Thief Trading Style™ Master Plan is a high-stakes operation backed by technical setups, macro-fundamentals, and robbery-level insights. Follow the blueprint laid out on the chart. Our target? The High-Risk Yellow ATR Zone – where the real treasure is buried.
💼 ENTRY: "The Vault Is Open – Grab the Bullish Bags!"
Enter long as price approaches key pullback levels within a 15–30 min timeframe. Use the most recent candle wick’s swing low/high for sniper-style DCA entries.
🔑 Layer multiple limit orders like a thief stacking getaway bags (aka the DCA / Layering Method). Be patient and precise.
🛑 STOP LOSS: "Don’t Get Caught by the Market Police"
📍 Place SL just below the nearest 4H swing low (example: 97.300) depending on your strategy (scalping/swing).
⚖️ Your SL should reflect your risk appetite, lot size, and how many limit orders you’re running. Thieves don’t risk it all on one job. 🎭
🎯 TARGET: 101.800 (or Escape Before the Sirens)
Once the target zone nears, decide whether to collect full loot or exit before resistance hits. We trade smart, not greedy. 🧠💰
📈 Why This Heist Makes Sense: Market Conditions Breakdown
Bullish momentum supported by macro drivers and intermarket forces
COT report and sentiment leaning in favor of USD
Dollar Index structure showing signs of reversal + trend confirmation
Consolidation trap zones hinting at institutional accumulation
💡 This is not just a blind entry—it's a well-researched and time-tested plan. Check the chart details and refer to:
🔗 Fundamentals | COT Reports | Sentiment Score | Quantitative Outlook
🚨 NEWS & POSITION MANAGEMENT ALERT
Before jumping in, beware of high-impact news!
🗞️ To keep your trades safe and stress-free:
Avoid opening new positions during major news releases
Use trailing SLs to protect gains
Monitor volatility triggers (economic calendar is your best friend!)
🏴☠️💥 BOOST THE ROBBERY – Hit That Like/Boost Button
The more you boost, the stronger the heist crew becomes! 💪🚀
Help fellow traders steal opportunities with the Thief Trading Style™ – calculated, bold, and sharp.
🔥 Let's continue to outsmart the markets and make each trade count. Stay tuned for the next heist update – fresh trades, deeper insights, and bigger bags. 🤑💼
🔔 Disclaimer: This plan is not financial advice. Use it for educational and entertainment purposes. Always conduct your own analysis and manage risk accordingly.
📌 Markets shift quickly. Stay adaptable, informed, and always ready to pivot.
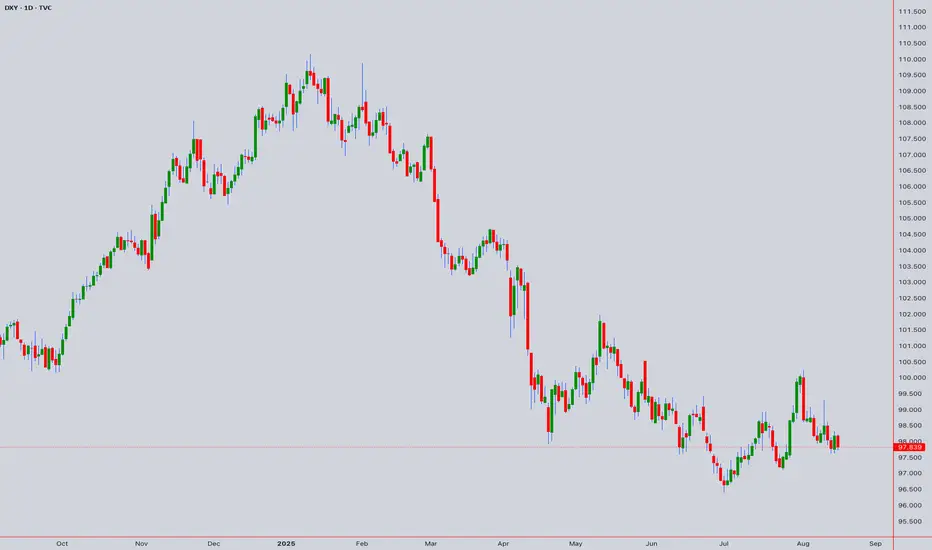
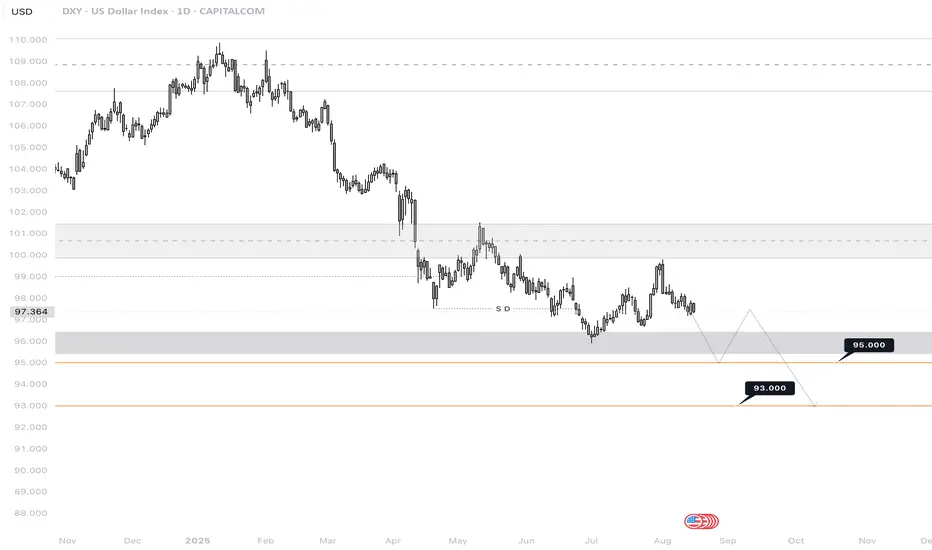
DXY (Daily)🔎 Chart Context
• Instrument: DXY (US Dollar Index)
• Timeframe: 1D (Daily)
• Broker: Capital.com
• Date: 15 August 2025
This chart tracks the relative strength of the US Dollar against a basket of major currencies. It is also strongly correlated inversely with risk assets (BTC, SOL, equities, gold).
📊 Key Observations
1. Macro Structure
• DXY peaked at 109.879 and 109.506 (late 2024 highs).
• Since then, the index has been in a steady downtrend, forming consistent lower highs: 107.235 → 104.256 → 101.513 → 98.959.
• Current price trades around 97.805–98.268, well below prior supports, confirming bearish pressure.
2. Support & Demand Zones
• 97.527 – 96.663: Current support range being tested repeatedly.
• 95.000: Stronger demand zone, marked as the next probable retest.
• 93.000: A deeper liquidity level, identified as a potential long-term downside target.
3. Resistance Zones
• 98.959 – 99.804: Previous breakdown area and strong supply.
• Any bullish bounce will likely stall in this zone unless momentum shifts drastically.
4. Liquidity Behavior
• DXY is compressing within the 97.5–99 band.
• Multiple sweeps of 97.527–96.663 suggest buyers are weakening.
• Next liquidity magnet lies at 95.000, with potential extension to 93.000.
5. Projected Path
• The chart projection suggests further downside movement toward 95.000, followed by a temporary relief rally, then continuation toward 93.000.
• This aligns with a macro bearish USD outlook.
📈 Bullish Case (Low Probability, Countertrend)
• If DXY holds 97.527–96.663 strongly and forms a higher low:
• First target: 98.959 (minor resistance)
• Second target: 99.804 (supply zone)
• Sustained break above 101.513 would change trend bias to bullish.
• However, this requires a major macro catalyst (e.g., Fed tightening or risk-off flows).
📉 Bearish Case (Higher Probability, Dominant Scenario)
• Downtrend structure intact with clear lower highs.
• Current weakness signals continuation:
• Next stop: 95.000 liquidity zone.
• Final target: 93.000 if bearish momentum persists.
• This aligns with weakening dollar demand and capital rotation into risk assets (crypto, equities, commodities).
⚡ Trading Plan
• Short Bias (Preferred Play):
• Enter on relief rallies into 98.959–99.804 supply zone.
• Target 1: 95.000
• Target 2: 93.000
• Stop-loss: Above 101.513
• Long Setup (Countertrend, Risky):
• Enter at 95.000 demand zone (scalp long).
• TP1: 98.959
• Stop: Below 93.000
DXY4H**Analytical Trading Perspectives for the Upcoming Week**
In this series of analyses, we have reviewed short-term trading perspectives and market outlooks.
As can be seen, in each analysis there is a key support or resistance zone near the current price of the asset. The market’s reaction or breakout at these levels will determine the next price movement toward the specified targets.
**Important Note:** The purpose of these trading perspectives is to highlight the key levels ahead of price action and the market’s possible reactions to them. These analyses are by no means trading signals.

BEARISH H4 DXYSee previous post - this is H4 view of my top down analysis from the monthly - weekly and down to the H4 time frame - supporting my bearish narrative on DXY until we mitigate the Bullish Monthly FVA / OB.
This Bearish Pullback supports - the Buy the Dip narrative. I will of course disregard my bullish bias on DXY if we break and close below the Invalidation of Bullish Bias point.

BEARISH MONTHLY PULLBACK ON XYDXY is bullish until we break and close below the invalidation of bullish bias. So if I have a bullish bias -I note April as True Year Open. I will buy below the TYO, hence the bearish monthly pullback.
Confluences that support my bearish Bias:
Current quarter is bearish and the draw on liquidity is towards the SSL around 30th June 2025 lows.
The previous week closed bearish so this coming week our initial draw on liquidity is bearish towards the green line. This may proceed towards the 30th June lows and into the inverse monthly FVG sitting above a fair value area and a bullish monthly order block marked in thick green line.

DXY Key-LevelsUsing the line chart I've plotted some general levels. Not exactly sure how to explain these levels other than "basically equal distance zones" to use as targets to manage risk from.
From this perspective, the $80 and below levels would make sense for a longer-term target.


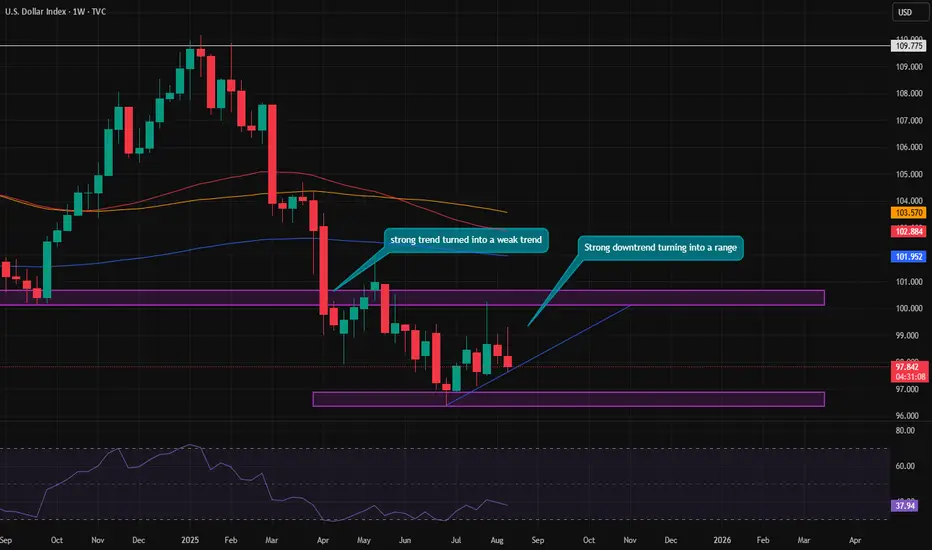
Weekly candle of the Dollar IndexThe Dollar Index has been stuck in a range for nearly 4 months, and in the most optimistic scenario, it might stay in this range for another month. We have to wait and see whether the battle between Trump and Powell will manage to weaken and devalue the dollar even further or not.
DXY ready to drop again?DXY has done false breakout in the beginning of the week with strong rejection to the upside. Upon rejection, price has pulled back to 38.2% fib along with daily resistance retest and price has strongly rejected from 98.70 showing further downside with another wave to 98.32 has rejected with strong liquidity candle that continue to drop as 4h, has formed liquidity candle with false breakout at 98.00, there is higher probability to drop to support.

DXY consolidating near key supportThe DXY is consolidating near key support, as Fed policy, inflation prints, and global trade moves dominate. A break below 97.10 risks deeper declines, while stability or positive data could prompt a technical rebound toward 98.65 –98.90. Fundamentals point to ongoing softness barring a surprise risk-off event, with yield dynamics and capital flows dictating the dollar’s path.
Fundamental Analysis:
Fed Policy: The market is pricing a ~89% chance of a 25bps cut at the September FOMC, with some banks forecasting up to four cuts by year end. This has capped dollar upside, as US yields drift lower.
Inflation: Core PCE stands at 2.8% YoY, above the Fed’s target, but the most recent CPI & PPI data was mixed. Headline inflation surprised on the high side, but rates markets still bet on easing as growth softens.
Macroeconomic Data: Labor data (including NFP, jobless claims) and ISM services trends have been underwhelming, fueling a tug-of-war between those expecting the Fed to cut sooner and those betting on sticky inflation.
Global Politics & Trade: New tariffs as of August on over 60 nations and 18.6% effective average US tariff rate, the highest since the 1930s, have muddied safe-haven flows supporting the dollar at times, but now viewed more as a global growth risk that could hurt USD as well.
Capital Flows: Despite volatility, the dollar remains underpinned by structural demand reserve currency role, deep markets, global capital safety. However, persistent US policy uncertainty around trade and the US Fed means foreign flows are choppier than usual.
Central Bank Trends: Some major peers such as ECB, BoE are also expected to ease or are facing economic softness, limiting the DXY’s downside. However, the US policy shift is perceived as more aggressive for now.
Technical Analysis & Key Levels
Pivot: 98.00 – 98.20
Immediate Support: 97.25 and 96.45
Major Support: 97.10, a close below here increases risk of further decline.
Immediate Resistance: 98.65, then 98.80. A break above here is needed for a bullish reversal.
Major Resistance: 99.40 and 100.00, these are bullish targets if the USD stages a structural rebound.
If support holds and macro data surprises to the upside, a rebound to 98.65 – 98.80 could materialise.
Analysis by Terence Hove, Senior Financial Markets Strategist at Exness
