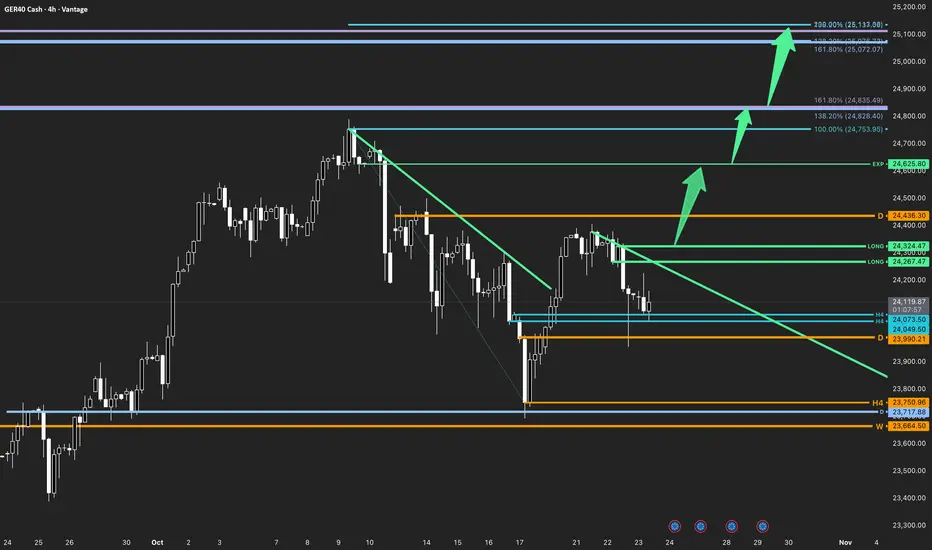
Is this the NEXT big leg up for DAX? It seems like there is stabilisation around in Europe with the markets.
While America is making a mess with its peace with many countries (including Canada).
We are seeing the EURO fly which means there is a safe haven among the CAC, DAX, IBEX and EURSTOXXX...
The charts are looking great for upside, and we might have some optimism around Europe in the next month.
Here are the technicals.
W Formation
Price>20 and 200
Target 25,113
Disclosure: I am part of Trade Nation's Influencer program and receive a monthly fee for using their TradingView charts in my analysis.
Trade ideas

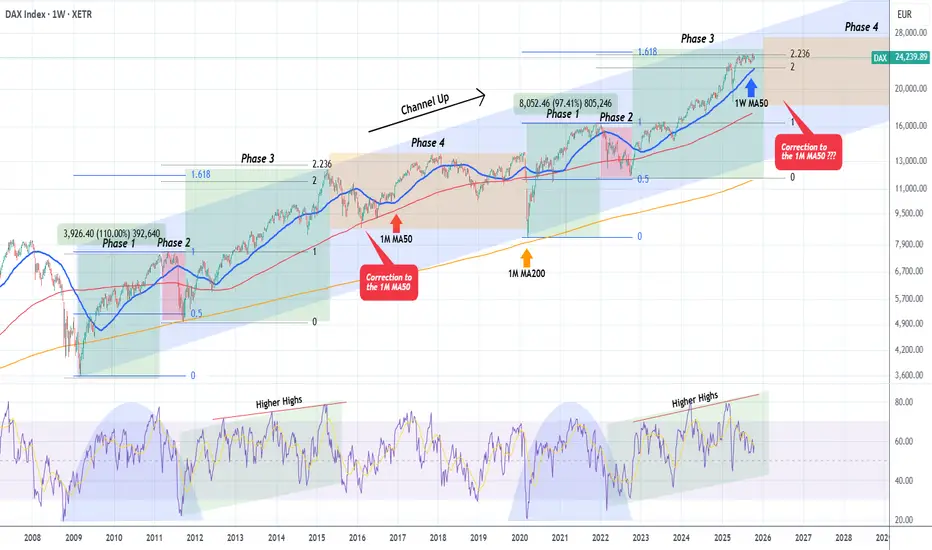
DAX may be at the end of a Bullish Super Cycle.DAX (DE40) has been trading within a historic 16-year Channel Up every since the March 2009 bottom of the U.S. Housing Crisis. This pattern has showcased very distinct technical patterns within it, characterized by an extremely high degree of symmetry.
As you can see, we have classified them into four Phases and right now DAX appears to be trading on a Phase 3. That is the phase where following a Phase 2 correction to the 0.5 Fibonacci retracement level (blue) of Phase 1, it enters a Bull Cycle, which supported by the 1W MA50 (blue trend-line), it peaks on the 1.618 (blue) and 2.236 (black) Fibonacci extensions (of Phase 1 and 2 respectively).
According to this, the index seems to be right at the end of this 'Super Cycle' of Phases 1,2 and 3 and entering Phase 4 of the Channel Up, which (the only data set we have on this pattern) is a period of directionless and volatile trend, loosely supported by the 1M MA50 (red trend-line), which only managed to find support and rebound just before touching the 1M MA200 (orange trend-line) during the March 2020 COVID crash. As a result, Phase 4 can be characterized as a true Bear Cycle, lasting 5 years before (April 2015 - March 2020).
The 1W RSI patterns of the two fractal phase groups are also identical and highly symmetrical and we are already on the 3rd Higher High, rejection and moving downwards. That is a Bearish Divergence and may explain DAX's mostly neutral price action since June 2025.
In any case, the index is possibly ending Phase 3 of this 'Super Cycle' and the next move according to the 2015 sequence is a correction to the 1M MA50. Long-term investors that don't get caught up in the daily volatility, avoid the noise and eventually enjoy the most steady returns on their investments, will most likely seek to wait patiently for this correction and buy low.
What would you be willing to do in that situation?
-------------------------------------------------------------------------------
** Please LIKE 👍, FOLLOW ✅, SHARE 🙌 and COMMENT ✍ if you enjoy this idea! Also share your ideas and charts in the comments section below! This is best way to keep it relevant, support us, keep the content here free and allow the idea to reach as many people as possible. **
-------------------------------------------------------------------------------
💸💸💸💸💸💸
👇 👇 👇 👇 👇 👇
Pullback tradeThe price has bounced off last week's support area with an engulfing bullish candle, showing that the market is still bullish, this provides an entry opportunity after a sharp pullback
WE ONLY TRADE PULLBACKS
Comment your thoughts

DAX uptrend breakout continuation supported at 23970The DAX remains in a bullish trend, with recent price action indicating a potential overbought pullback within the broader uptrend.
Support Zone: 23970 – a key level from previous consolidation. Price is currently testing or approaching this level.
A bullish rebound from 23970 would confirm ongoing upside momentum, with potential targets at:
24490 – initial resistance
24580 – psychological and structural level
24770 – extended resistance on the longer-term chart
Bearish Scenario:
A confirmed break and daily close below 23970 would weaken the bullish outlook and suggest deeper downside risk toward:
23870 – minor support
23770 – stronger support and potential demand zone
Outlook:
Bullish bias remains intact while the Dax40 holds above 23970. A sustained break below this level could shift momentum to the downside in the short term.
This communication is for informational purposes only and should not be viewed as any form of recommendation as to a particular course of action or as investment advice. It is not intended as an offer or solicitation for the purchase or sale of any financial instrument or as an official confirmation of any transaction. Opinions, estimates and assumptions expressed herein are made as of the date of this communication and are subject to change without notice. This communication has been prepared based upon information, including market prices, data and other information, believed to be reliable; however, Trade Nation does not warrant its completeness or accuracy. All market prices and market data contained in or attached to this communication are indicative and subject to change without notice.

GER40 Review October 28 2025Short-term price movement ideas.
The price has reached the daily zone of interest and performed a liquidity sweep there, which triggered a bearish move and created conditions for its further continuation.
At the moment, we have a 1H short order flow. If the price confirms the last 1H break-to-sell (BtS), we can then consider opening a position aiming for a continuation toward the 4H low.
Be flexible, adapt to the market, and the results will come quickly. Good luck to everyone.

Technical Analysis WeeklyGermany 40 has re-entered its trading range after a failed bullish breakout. Price trades at 24,057, slightly below its VWAP of 24,206. RSI at 48.4 suggests subdued momentum. Support lies at 23,683, while resistance is 24,729.
UK 100 maintains a bullish trend but is undergoing a corrective phase. Price has pulled back to 9,394, below its VWAP of 9,403. The RSI at 51.4 indicates weak bullish momentum. Support is at 9,287, and resistance stands at 9,558.
Wall Street remains in a bullish trend but continues to correct lower, currently at 46,303, on top of its VWAP. RSI at 52.6 shows a neutral stance. Support lies at 45,630, and resistance is estimated at 46,911.
Brent Crude is turning bearish within its broader range. Price has fallen to 6,094, below the VWAP of 6,422. RSI at 30.9 indicates strongly bearish momentum. Support sits at 5,983, while resistance is at 6,860.
Gold extends its bullish run in a strong impulsive phase, trading at 4,259, significantly above the VWAP of 4,015 but down a bit from all time highs. The RSI at 75.5 signals less overbought conditions. Support is way down at 3,677, and resistance is at 4,353.
EUR/USD holds its trading range, now trading at 1.1666, right next to its VWAP. RSI at 49.0 signals neutral momentum. Support is at 1.1556, and resistance is at 1.1782.
GBP/USD stays in a bullish trend but is correcting sideways, trading at 1.3423, slightly above the VWAP of 1.3400. RSI at 49.8 shows consolidation. Support is at 1.3299, with resistance at 1.3514.
USD/JPY is in a pullback following its bullish range-breakout, currently at 150.67, just above its VWAP of 150.30. The RSI at 54.2 reflects moderate bullish momentum. Support lies at 146.60, and resistance is at 154.01.

Fibonacci TradeThe price made a pullback to the 61 level on the fib follwed by a second pullback on the 50 level, now the price has made a higher high, and now looks to go long
WE ONLY TRADE PULLBACKS
Comment your thoughts


GER30 | Multi-Timeframe Bullish Expansion SetupThe Market Flow | October 27, 2025
Technical Overview
Weekly:
• The weekly bullish trend remains intact, sustaining above prior structural pivots.
• Structure continues its expansion phase, with higher lows forming consistent with the broader bullish bias.
Daily:
• The daily trend has started its transitioned into bullish after reclaiming and closing above the previous breakdown level.
• Wave structure confirms alignment with the weekly expansion path.
• Bias continues long as momentum builds toward upper clean H4 structures.
H4:
• H4 bullish trend confirmed, supported by a sequence of higher pivots.
• Current structure originated from the H4 pivot zone, now acting as the foundation for the next expansion leg.
• Fibonacci extensions show progressive resistance targets
H1:
• Previous H1 countertrend was broken from the H4 pivot zone, confirming re-entry into the bullish structure.
• New pivot formed and validated by crossing the previous H1 pivot, establishing continuation bias in favor of the higher timeframe trend.
Trade Structure & Levels
• Bias: Long above 24,219.32 (H4 pivot zone)
• Trigger = Break above 24,325.60 (highest clean H1 breakdown - "EXP")
• Primary Invalidation = H4 pivot at 24,219.32
• Secondary Invalidation = Daily pivot near 23,990.21
• Path → 24,450.60 → 24,556.25 → 24,625.80
• Phase: Accumulation
Risk & Event Context
• Index behavior may remain sensitive to European earnings season and macro data releases (inflation, ECB commentary).
• Volatility spikes likely around key US macro events.
Conclusion
Multi-timeframe alignment confirms a resuming bullish expansion above the Expansion level. With both H4 and Daily trends synchronized above active pivots, the path remains upward toward 24,625.80 while 24,218.30 holds as the key structural invalidation.

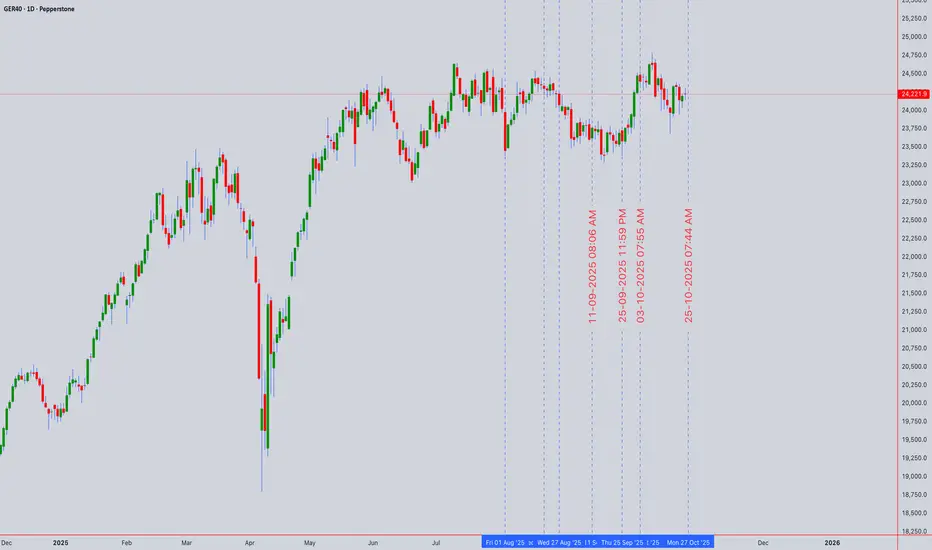
The most audacious forecast DAX gapped up above the trendline on news on trade deals, but there is no follow through. Instead, price is coming down and re-testing the breakout trendline.
Price action is bearish, which indicates further downside, thus rendering the trendline support as useless. Will that be the case? No doubt, the overall market is bullish, especially the US markets. But will DAX be the clue that we see a profit taking/sell down for the coming days? And using a simple projection, 23000 will be a 'scary' yet healthy pullback, as good level to go long off.

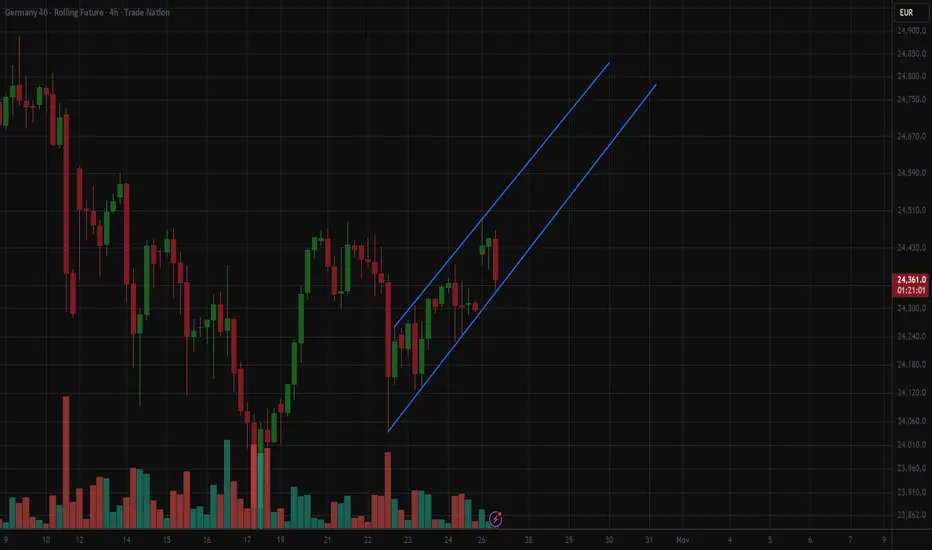
4H Bull channel DAX Buy signalDax futures are in a bull channel on 4H chart since 23 october.
Today the DAX can be bought at the bottom of that bull move with an entry around 24350, stop loss for 50 and an expected profit of 120 points.
DAX40 (GER40) INDEX TECHNICAL MASTERCLASS 💎 DAX40 (GER40) INDEX TECHNICAL MASTERCLASS | Oct 27-31, 2025 | ELITE Trading Roadmap 📊
Current Price: 24,221.9 | Strategy: Intraday Swing Trading | Timeframes: 5M → 1D Analysis ⏰
━━━━━━━━━━━━━━━━━━━━━━━━━━━━━━━━━━━━━━━━━━━━━━━━━━━━━━━━━━
💪 DAILY (1D) ANALYSIS - DAX Swing Trade Framework
DAX40 on the daily timeframe is displaying STRONG CONSOLIDATION AFTER BULLISH IMPULSE near 24,100-24,150 support offering CLEAN swing trade entries this week!
Gann theory angles from September lows converge at 24,400-24,500 resistance zone = MAJOR BREAKOUT TARGET identified! 🎯
━━━━━━━━━━━━━━━━━━━━━━━━━━━━━━━━━━━━━━━━━━━━━━━━━━━━━━━━━━
⚡ 4-HOUR (4H) SWING TRADE BLUEPRINT - PRIMARY ENTRY ZONE
The 4H timeframe is showing TEXTBOOK BREAKOUT FORMATION SETUP!
DAX | Accumulation Phase Validating Countertrend BreakTechnical Overview
Weekly:
The broader trend remains bullish, maintaining higher-high and higher-low structure. Price action continues to trade above the weekly pivot zone, confirming medium-term trend alignment to the upside.
Daily:
A valid countertrend structure is present. The last daily breakdown has been broken by a clean impulsive wave that also pierced the countertrend line, suggesting early transition from correction toward potential expansion.
Bias remains constructive as long as price holds above the lower daily pivot at 23,990 .
H4:
The structure shows price consolidating beneath the broken countertrend line, forming a short-term base around the 24,050–24,100 zone. A sustained close above 24,324 would confirm trigger alignment and open path toward 24,625 (EXP) and 24,850–25,100 Fibonacci extensions.
Trade Structure & Levels
Bias: Long above 23,990
Trigger Zone: 24,324–24,625
Invalidation: Daily close below 23,990 or H4 close below 23,750
Path → 24,625 → 24,850 → 25,100
Phase: Accumulation (pre-expansion)
Risk & Event Context
The GER40 remains in a technical accumulation phase within a bullish weekly structure. Volatility is moderate, and continuation depends on reclaiming upper trigger levels.
Conclusion
As long as the structure holds above the active daily and H4 pivots, the setup favors an eventual continuation toward expansion.
DAX key trading level at 23970 The DAX remains in a bullish trend, with recent price action indicating a potential overbought pullback within the broader uptrend.
Support Zone: 23970 – a key level from previous consolidation. Price is currently testing or approaching this level.
A bullish rebound from 23970 would confirm ongoing upside momentum, with potential targets at:
24490 – initial resistance
24580 – psychological and structural level
24770 – extended resistance on the longer-term chart
Bearish Scenario:
A confirmed break and daily close below 23970 would weaken the bullish outlook and suggest deeper downside risk toward:
23870 – minor support
23770 – stronger support and potential demand zone
Outlook:
Bullish bias remains intact while the Dax40 holds above 23970. A sustained break below this level could shift momentum to the downside in the short term.
This communication is for informational purposes only and should not be viewed as any form of recommendation as to a particular course of action or as investment advice. It is not intended as an offer or solicitation for the purchase or sale of any financial instrument or as an official confirmation of any transaction. Opinions, estimates and assumptions expressed herein are made as of the date of this communication and are subject to change without notice. This communication has been prepared based upon information, including market prices, data and other information, believed to be reliable; however, Trade Nation does not warrant its completeness or accuracy. All market prices and market data contained in or attached to this communication are indicative and subject to change without notice.

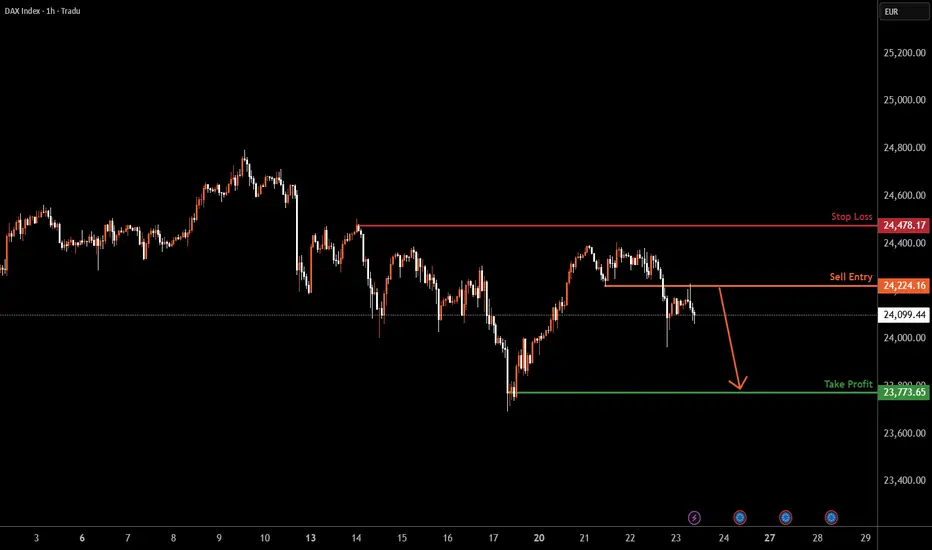
GER30 H1 | Bearish Drop-Off FormationGER30 has rejected the sell entry of 24,224.16, which is a pullback resistance and could potentially drop from this level to the downside.
Stop loss is at 24,478.17, which is a pullback resistance.
Take profit is at 23,773.65, which is a swing low support.
Stratos Markets Limited (tradu.com):
CFDs are complex instruments and come with a high risk of losing money rapidly due to leverage. 68% of retail investor accounts lose money when trading CFDs with this provider. You should consider whether you understand how CFDs work and whether you can afford to take the high risk of losing your money.
Stratos Europe Ltd (tradu.com ):
CFDs are complex instruments and come with a high risk of losing money rapidly due to leverage. 70% of retail investor accounts lose money when trading CFDs with this provider. You should consider whether you understand how CFDs work and whether you can afford to take the high risk of losing your money.
#DAX, next leg downPreviously, I called for a short of DAX for a move down to 23700/23800 (). We got 450 points down, hit my 23700 level and rebounded 700 points, to perfection.
Market seemed weak now; could see another leg down, back to 23680 and possibly to 23200.

DAX: Local Bearish Bias! Short!
My dear friends,
Today we will analyse DAX together☺️
The recent price action suggests a shift in mid-term momentum. A break below the current local range around 24,048.10 will confirm the new direction downwards with the target being the next key level of 23,872.63 and a reconvened placement of a stop-loss beyond the range.
❤️Sending you lots of Love and Hugs❤️

Technical Analysis WeeklyGermany 40 is still stuck in a neutral range phase. Price is at 24,159, close to the VWAP of 24,150. The RSI at 50.3 suggests a totally neutral bias. Support is at 23,878, and resistance is at 24,427.
UK 100 continues in a strong bullish impulsive trend, trading at 9,732 above its VWAP of 9,532. Momentum remains strong with an RSI of 69.3, nearing overbought territory. Support is seen at 9,234 and resistance at 9,829.
Wall Street maintains its bullish trend and is still in an impulsive phase, trading at 47,643 and comfortably above the VWAP of 46,711. The RSI at 68.0 reflects strong upside pressure. Support lies at 45,359, with resistance at 48,063.
Brent Crude is still bearish overall, though it has entered a correction phase- and could be staging a trend reversal. Price is at 6,461, hovering above the VWAP of 6,333. RSI at 51.5 indicates a neutral stance. Support is found at 6,000, while resistance caps at 6,667.
Gold’s bullish trend has paused into a correction, now trading at 4,002, still below the VWAP of 4,104. The RSI of 49.1 reflects a cooling momentum. Support is at 3,861, with resistance at 4,104.
EUR/USD has broken down into a 3-month low but remains in an overall neutral trend, trading at 1.1515 and under its VWAP of 1.1614. The RSI at 33.1 hints at building downside momentum. Support is found at 1.1500, with resistance at 1.1710.
GBP/USD has weakened to test the bottom of its multi-month range setting up possible breakdown into a new bearish trend, currently at 1.3127 and beneath the VWAP of 1.3309. The RSI at 30.4 signals oversold conditions. Support is at 1.3106, with resistance at 1.3513.
USD/JPY continues its bullish impulsive trend, now trading at 154.13, above the VWAP of 152.19. The RSI at 66.3 shows strong upward pressure. Support lies at 149.74, with resistance at 154.64.


DAX weekly pivot map for 3 to 7 November 2025Why this matters
Next week is a sequence market. Final PMIs set tone. Germany prints factory orders and industrial production. The week closes with the U.S. jobs report. That mix often compresses ranges around fair value until something cracks. So the plan is one grid, two scenarios, three rules.
Chart to publish
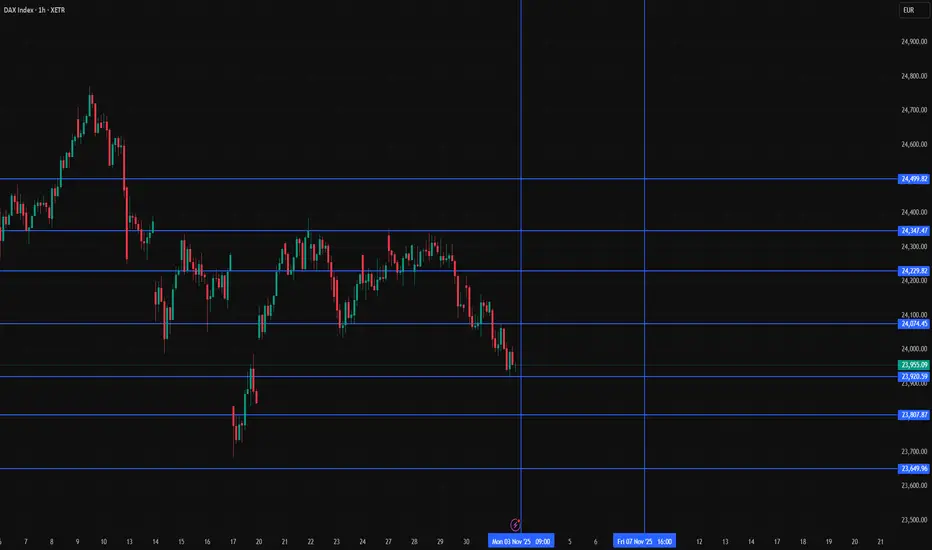
Timeframe 1H on GER40. Add a single grid from last week Xetra cash.
High 24 348.59. Low 23 922.95. Close 23 958.30.
Pivot 24 076.61. R1 24 230.28. R2 24 502.25. R3 24 655.92.
S1 23 804.64. S2 23 650.97. S3 23 379.00.
Optional helpers. VWAP. Cumulative delta. No extra overlays. Keep it clean so the levels do the talking.
What I am watching on tape
How price behaves around the pivot during quiet periods. The first pass into R1 or S1 without a fresh release often mean reverts. If a surprise hits, the grid becomes a runway for extension. The job is not to predict. The job is to recognise when ranges are intact and when a genuine break is underway.
Catalysts and session notes
Germany releases often land near 08:00 CET. Factory orders midweek. Industrial production the day after. The U.S. Employment Situation prints Friday at 08:30 ET. That one moves global curves and the euro which feeds back into exporters. I do not hold risk through the print. I would rather enter the follow through once the first sweep finishes.
Levels that matter this week
Pivot 24 076 is the magnet. Above it the burden of proof is on sellers. Below it buyers need time to build. R1 24 230 is the first supply pocket. R2 24 502 lines up with prior supply. R3 24 656 sits just under the recent extremes. On the downside S1 23 805 is first support. S2 23 651 is where momentum sellers usually engage. S3 23 379 is the stress zone if the week turns heavy.
Two simple scenarios
Scenario A soft landing tone
PMIs steady. Orders stabilise. Production improves. Payrolls strong enough but wages calm. The tape accepts price above the pivot and north of R1. Tactics. Buy pullbacks into 24 080 to 24 120 with a hard stop under 23 980. First take-profit at R1. Trail into the 24 330 pocket. If R2 breaks on confirmation keep a runner toward 24 650 to 24 770 where supply stacked recently. The idea is to let the market pay you for being patient near the magnet then step aside if the grid stops working.
Scenario B growth scare tone
PMIs revise down. Orders miss. Production disappoints. Payrolls hot on wages. Sellers defend R1 and the euro wobbles. Tactics. Sell failed bounces close to 24 230 with a stop above 24 330. First target the pivot. Add only on a clean loss of 23 980. Manage into S2 and be pragmatic near S3 because volatility tends to spike there.
How to trade the grid
Entry
I anchor on 1H structure. I drill down to 15m for the trigger. I want acceptance around the level. That means a pause, a clean candle close, and a little confirmation from volume. Chasing the very first touch is optional and usually a worse price unless the day is a trend day.
Risk
Fixed R works. Use a small stop around the other side of the level. I like 0.5 R stops and 1.0 R first targets. On days with a data print I cut size in half or I skip the first twenty minutes. The easiest way to survive event weeks is to size for the noise and accept that some moves will run without you.
Adds and exits
Adds only after partials are banked. No martingale. I scale out at the next grid line or at VWAP if the run stalls. I do not marry a view. If the grid stops behaving I go flat and wait for the next high quality test.
Why this works
These weekly levels attract flow. Dealers manage hedges around them. When the tape is balanced the pivot acts like gravity. When the tape is imbalanced the break through R2 or S2 gives you a repeatable context to join the side that is pressing. You are not forecasting. You are responding with a simple structure.
Rules to pin on the chart
• Fade the first clean touch of R1 or S1 back to the pivot if no high impact release is due within the next hour.
• Trade breakouts only on a firm thirty minute close above R2 or below S2 with volume support and a positive delta profile.
• Stay flat into red events. Flat at least five minutes before the U.S. jobs report. Reassess after the first sweep.
Instrument
GER40 on the 1H chart. If you execute futures on Eurex or a CFD feed, tiny price differences do not change the grid. Rebuild the levels each weekend from the cash high low close so the numbers stay honest.
Mindset
The grid is a map. It tells you where to look. Your edge comes from taking the same trade the same way every time. Good process first. P and L follows.
Education only.
How China Is Quietly Taking Over Europe’s Industrial FutureThe Lack of Rare Earth Elements Pushes Europe into Major Concessions to China.
Europe’s growing shortage of rare earth elements is forcing it to make unprecedented concessions to China — so deep that analysts now warn the continent could see the collapse of entire industrial sectors within the next five to six years.
Automotive, shipbuilding, aviation, and railway manufacturing are all at risk. To stay afloat, European manufacturers — especially in Germany — are reportedly transferring valuable production know-how and proprietary technologies to Chinese partners in a desperate attempt to survive just a few more months or years.
China, meanwhile, is using this knowledge to strengthen its own technological base. The scenario is alarmingly familiar: just as China mastered and surpassed the West in electric vehicles, it is now poised to outpace Europe across nearly every remaining industrial field.
Investing in major German corporations is rapidly becoming meaningless. These companies will either shut down or be bought out entirely. The battle for industrial dominance has already been decided — China has won against Europe. What remains is the larger confrontation with the United States, a conflict that will likely unfold on Europe’s back, among the ruins of its once world-leading industries.

Dax for Thursday October 23rdThe pattern has not got bullish.Plenty of overhead resistance though.Lets see who wins

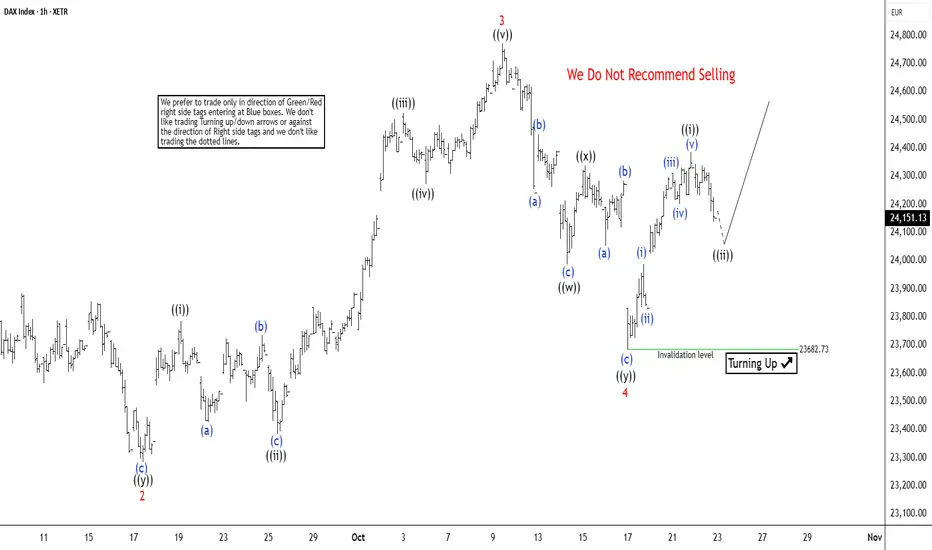
DAX Extends Gains in Five Wave Diagonal FormationThe short-term Elliott Wave analysis for the DAX Index indicates it is nearing the completion of a cycle from its April 2025 low, unfolding as wave (5). From the June 19 low, wave (5) has developed as an ending diagonal Elliott Wave structure. The rally from this low saw wave 1 peak at 24639.1, followed by a wave 2 pullback concluding at 23284.67. The Index then advanced in wave 3, structured as a five-wave impulse. From the wave 2 low, wave ((i)) reached 23785.24, with a corrective dip in wave ((ii)) at 23383.84. The subsequent wave ((iii)) climbed to 24524.11, followed by a wave ((iv)) retracement to 24269.94. The final wave ((v)) culminated at 24771.34, completing wave 3.
Wave 4 unfolded as a double zigzag structure. From the wave 3 high, wave ((w)) declined to 23986.93, wave ((x)) rebounded to 24339.27, and wave ((y)) fell to 23682.73, finalizing wave 4. The Index has since turned upward in wave 5. From the wave 4 low, wave ((i)) reached 24384.24. A wave ((ii)) pullback is expected to correct the cycle from the October 17 low before the Index resumes its ascent. As long as the pivot at 23682.73 holds, pullbacks should attract buyers in a 3, 7, or 11 swing, supporting further upside in the near term.