UK100 - step into recession - MARKET MANIPULATIONTeam,
Time to SHORT UK100 at 9890 ranges
STOP LOSS AT 9935
Target 1 at 9865-45
Target 2 at 9236-24
UNEMPLOYMENT HIT THE ROOF at 5%
INFLATION is above 3%
but market continue to rocket base on FAKE PUMP and manipulation.
NOT fundamentally.
LETS GO
Trade ideas
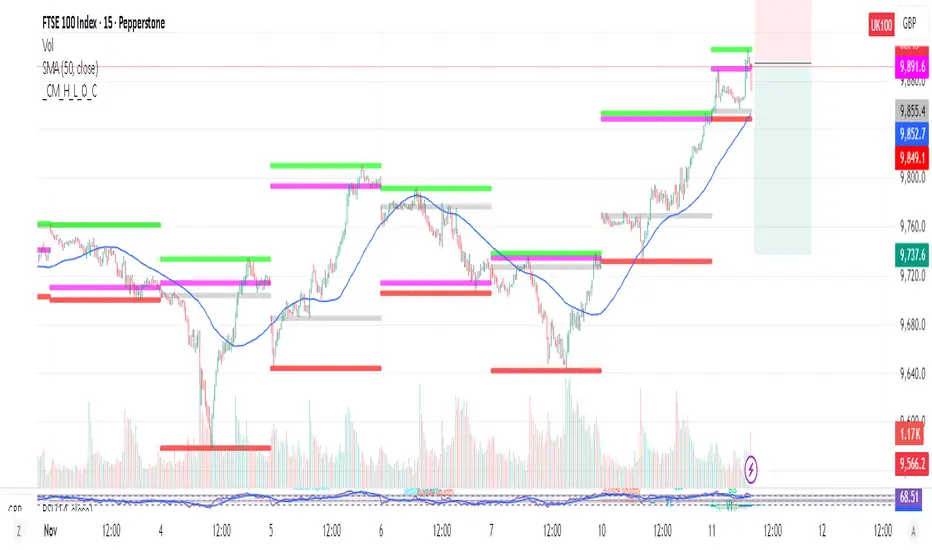
UK100 DOUBLE TOPHey awesome traders! Hope you’re snagging pips. FTSE just printed a clean Double Top—first peak near 9,790, second swing failed beneath it, and price is hovering under the short EL ~9,739.7. This puts sellers in control if we confirm below the neckline.
Key Levels
Peaks: 9,788–9,790
Short EL: 9,739.7
Mid level: 9,679.8 (0.5)
Neckline / Trendline break: 9,571.2
200-SMA: 9,488.3
Measured move T1: ~9,355.7
Trading Plan
Aggressive short: Fade the second top / EL 9,739–9,745 on bearish rejection (engulfing/pin).
Stop: above 9,795 (beyond tops).
TPs: 9,680 → 9,571 → 9,488 → 9,355.
Conservative short (confirmation): Wait for a 4H close below 9,571, then sell the retest as resistance.
Invalidation: sustained reclaim back above 9,571, or especially above 9,740–9,790.

UK 100 Index – Psychological 10000 level Within Sight!The UK 100 index has been on an impressive run so far in November. After a brief wobble which saw it fall from an opening level of 9761 on November 3rd down to a low of 9579 on November 4th, the UK 100 has rallied 3.7%, posting numerous record highs on the way to its most recent peak of 9936 on November 12th.
The reasons for its recent success can be put down to an improving backdrop for global trade and the reopening of the US federal government which has boosted general risk sentiment, but also directly benefits the earnings of multi-national companies that make up around 70% of the composition of the UK 100.
On the domestic front, concerns about the strength of UK economic growth, highlighted by a weaker-than-expected Q3 GDP release this morning, have led traders to increase their expectations for an interest rate cut from the Bank of England in December to around an 80% chance, up from 60% at the start of the week. This has seen GBP weaken against the US dollar and EUR, providing another boost to UK 100 companies who generate a large percentage of their earnings outside of the UK.
Add to this, the low valuations of UK companies when compared to their US peers and a generally better than expected Q3 earnings season and you can potentially see why the UK 100 has seen its prices rise.
Looking forward, traders may now be focused on the UK Chancellor’s Autumn Budget on November 26th as a key pivot point for the direction of the UK 100 index into the end of the year, especially since there may be a realistic potential for leaks of possible tax hikes and spending cuts contained in that budget before that date.
In the shorter term, the technical outlook may be a more pressing consideration for traders looking to determine whether the UK 100 could top the psychological 10000 level, or even higher into the weekend or early next week.
UK 100 Index Technical Update: Is the Trend Still Your Friend?
Since the September 2nd low, the UK 100 index has climbed over 9%, reaching a new all‑time high at 9936 on Wednesday this week. This advance highlights a pattern of higher highs and higher lows in price, showing buyers stepping in at elevated levels after each pullback, fuelling fresh moves to new highs and reinforcing positive sentiment.
However, just because this uptrend pattern is evident doesn’t offer a guarantee that further topside extension will materialise. As such, it is perhaps prudent to be aware of potential support and resistance levels that if broken may offer clues to the next directional price themes for the UK 100.
Potential Resistance Levels:
Much continues to depend on future price activity and trends, but with a new all‑time high of 9936 posted, traders appear to be maintaining risks toward further strength and this high at 9936 may now represent the first resistance level for them to focus on.
A successful close above 9936 is required to suggest further attempts at price strength, which could then shift the upside focus to 10012, which is the 100% Fibonacci extension, with scope for extension toward 10094 the higher 138.2% extension if that level gives way.
Potential Support Levels:
After the latest price strength, initial support could now stand at 9849, Tuesday’s session low. While the higher highs and higher lows pattern is still intact, closing breaks below 9849 may lead toward further short-term weakness.
If the 9849 low gives way on a closing basis, risks could then shift toward deeper declines, opening scope for tests of 9799, which is the 38.2% Fibonacci retracement of the November advance, possibly even 9713, which is the deeper 61.8% retracement level.
The material provided here has not been prepared accordance with legal requirements designed to promote the independence of investment research and as such is considered to be a marketing communication. Whilst it is not subject to any prohibition on dealing ahead of the dissemination of investment research, we will not seek to take any advantage before providing it to our clients.
Pepperstone doesn’t represent that the material provided here is accurate, current or complete, and therefore shouldn’t be relied upon as such. The information, whether from a third party or not, isn’t to be considered as a recommendation; or an offer to buy or sell; or the solicitation of an offer to buy or sell any security, financial product or instrument; or to participate in any particular trading strategy. It does not take into account readers’ financial situation or investment objectives. We advise any readers of this content to seek their own advice. Without the approval of Pepperstone, reproduction or redistribution of this information isn’t permitted.

FTSE 100 Trade Plan (1H)FTSE 100 Trade Plan (1H)
Market is currently reacting from a well-defined liquidity zone, showing a clear shift in structure after multiple swing failures. A beautiful cluster of equal highs and lower-high liquidity sits above, acting as a strong draw for price.
After taking out sell-side liquidity and forming a clean rejection from the discount zone, price is now driving upward toward that external liquidity. I’ll wait for a potential distribution or reaction once the buy-side liquidity gets swept.
If the market offers me an entry back in discount, I’ll position for continuation toward the higher liquidity target. My target is clear — I’ll engage only if price returns to the desired area; otherwise, I’ll stay flat.

UK showing strong upside once breaks above C&H to 9,772
A very large Cup and Handle has formed on UK100.
There are many reasons for the upside to come but here are a few ones I can think of.
📉 2. Undervalued vs. Other Indices
FTSE 100 has lagged behind the US and EU — now global investors are eyeing it as a catch-up play.
💷 3. Weak Pound Helps Export Giants
A softer GBP = stronger revenue for big FTSE names like Shell, BP, Unilever, etc., which dominate global markets.
🏦 4. Rate Cut Hopes Are Back
With UK inflation cooling, the Bank of England might ease up — which is fuel for stocks, especially banks and housing.
📈 5. Rotational Flows Into Value
Traders are rotating out of overbought tech and into solid dividend/value plays — and the FTSE is packed with them.
And this is looking great for upside.
We can expect upside to come ONCE the price breaks above the brim level.
Price>20 and 200MA.
9,772
Disclosure: I am part of Trade Nation's Influencer program and receive a monthly fee for using their TradingView charts in my analysis.

FTSE Bullish breakout resistance retest The FTSE remains in a bullish trend, with recent price action showing signs of a breakout within the broader uptrend.
Support Zone: 9646 – a key level from previous consolidation. Price is currently testing or approaching this level.
A bullish rebound from 9646 would confirm ongoing upside momentum, with potential targets at:
9770 – initial resistance
9800 – psychological and structural level
9845 – extended resistance on the longer-term chart
Bearish Scenario:
A confirmed break and daily close below 9646 would weaken the bullish outlook and suggest deeper downside risk toward:
9595 – minor support
9554 – stronger support and potential demand zone
Outlook:
Bullish bias remains intact while the FTSE holds above 9646. A sustained break below this level could shift momentum to the downside in the short term.
This communication is for informational purposes only and should not be viewed as any form of recommendation as to a particular course of action or as investment advice. It is not intended as an offer or solicitation for the purchase or sale of any financial instrument or as an official confirmation of any transaction. Opinions, estimates and assumptions expressed herein are made as of the date of this communication and are subject to change without notice. This communication has been prepared based upon information, including market prices, data and other information, believed to be reliable; however, Trade Nation does not warrant its completeness or accuracy. All market prices and market data contained in or attached to this communication are indicative and subject to change without notice.

FTSE Sideways consolidation supported at 9646The FTSE remains in a bullish trend, with recent price action showing signs of a breakout within the broader uptrend.
Support Zone: 9646 – a key level from previous consolidation. Price is currently testing or approaching this level.
A bullish rebound from 9646 would confirm ongoing upside momentum, with potential targets at:
9770 – initial resistance
9800 – psychological and structural level
9845 – extended resistance on the longer-term chart
Bearish Scenario:
A confirmed break and daily close below 9646 would weaken the bullish outlook and suggest deeper downside risk toward:
9595 – minor support
9554 – stronger support and potential demand zone
Outlook:
Bullish bias remains intact while the FTSE holds above 9646. A sustained break below this level could shift momentum to the downside in the short term.
This communication is for informational purposes only and should not be viewed as any form of recommendation as to a particular course of action or as investment advice. It is not intended as an offer or solicitation for the purchase or sale of any financial instrument or as an official confirmation of any transaction. Opinions, estimates and assumptions expressed herein are made as of the date of this communication and are subject to change without notice. This communication has been prepared based upon information, including market prices, data and other information, believed to be reliable; however, Trade Nation does not warrant its completeness or accuracy. All market prices and market data contained in or attached to this communication are indicative and subject to change without notice.

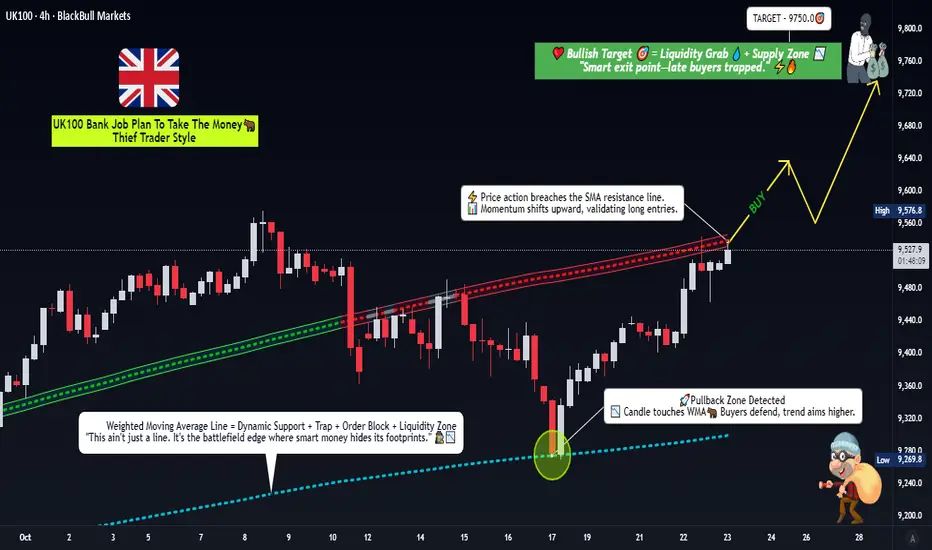
FTSE 100 Setup: Time to Go Long on This LSMA Breakout?🎯The UK100 "Capital Flow Heist" Blueprint 🚀 (Swing Trade Setup)
Buckle up, Thief Crew! 🏴☠️ We're plotting a bullish swing trade on the UK100, aiming to catch the next leg up. This isn't financial advice; it's a strategic blueprint for those who know how to handle the risk!
📈 The Master Plan (Analysis)
The strategy is simple: We're waiting for a confirmed bullish LSMA (Least Squares Moving Average) breakout to signal that the buyers are officially in control. This is all about timing the momentum shift and riding the wave.
⚙️ Trade Mechanics (The Heist Parameters)
Asset: UK100 (FTSE 100 Index)
Direction: Bullish
Style: Swing Trade
🎯 Entry Zone:
Action: Enter a LONG position on a confirmed candlestick close ABOVE the LSMA breakout level.
Level: 9560.0 (This is our launchpad! 🚀)
🛑 Stop Loss (The Escape Route):
Level: 9400.0
Thief's Note: This is my planned escape route. Place your SL where you are comfortable. Protect your capital like a pro! 💼
✅ Take Profit (The Loot Drop):
Level: 9750.0
Why Here? This zone represents a confluence of:
A strong historical resistance level.
Potential overbought conditions.
A classic bull trap area — so we grab our profits and exit stage left! 🎭
⚠️ Important Note from the OG: Dear Ladies & Gentlemen of the Thief Guild, I am not recommending you set only my SL or TP. It's your capital, your rules. You can make money, then take money at your own risk. Be a boss of your own trade. 😎
🔍 Related Pairs to Watch (The Intel)
To get a full picture, keep these assets on your radar. Movements here can influence our UK100 heist:
GBP/USD ( PYTH:GPUSD ): A stronger Pound can sometimes pressure the FTSE 100 (as many companies are multinational). Watch for inverse correlations.
US30 ($DOWI) / GER40 ( XETR:DAX ): Key global indices. Strong bullish moves in the US or German markets can often pull the UK market along for the ride.
EUR/GBP ( OANDA:EURGBP ): Economic dynamics between the UK and the Eurozone can cause capital flows in and out of UK assets.
✨ Final Community Message
“If you find value in my analysis, a 👍 and 🚀 boost is much appreciated — it helps me share more setups with the community!”
📜 Disclaimer & Hashtags
#UK100 #FTSE100 #TradingSetup #SwingTrading #TechnicalAnalysis #TradingView #CapitalFlow #ThiefStyle

FTSE100 overbought consolidation capped at 9770The FTSE remains in a bullish trend, with recent price action showing signs of a breakout within the broader uptrend.
Support Zone: 9646 – a key level from previous consolidation. Price is currently testing or approaching this level.
A bullish rebound from 9646 would confirm ongoing upside momentum, with potential targets at:
9770 – initial resistance
9800 – psychological and structural level
9845 – extended resistance on the longer-term chart
Bearish Scenario:
A confirmed break and daily close below 9646 would weaken the bullish outlook and suggest deeper downside risk toward:
9595 – minor support
9554 – stronger support and potential demand zone
Outlook:
Bullish bias remains intact while the FTSE holds above 9646. A sustained break below this level could shift momentum to the downside in the short term.
This communication is for informational purposes only and should not be viewed as any form of recommendation as to a particular course of action or as investment advice. It is not intended as an offer or solicitation for the purchase or sale of any financial instrument or as an official confirmation of any transaction. Opinions, estimates and assumptions expressed herein are made as of the date of this communication and are subject to change without notice. This communication has been prepared based upon information, including market prices, data and other information, believed to be reliable; however, Trade Nation does not warrant its completeness or accuracy. All market prices and market data contained in or attached to this communication are indicative and subject to change without notice.

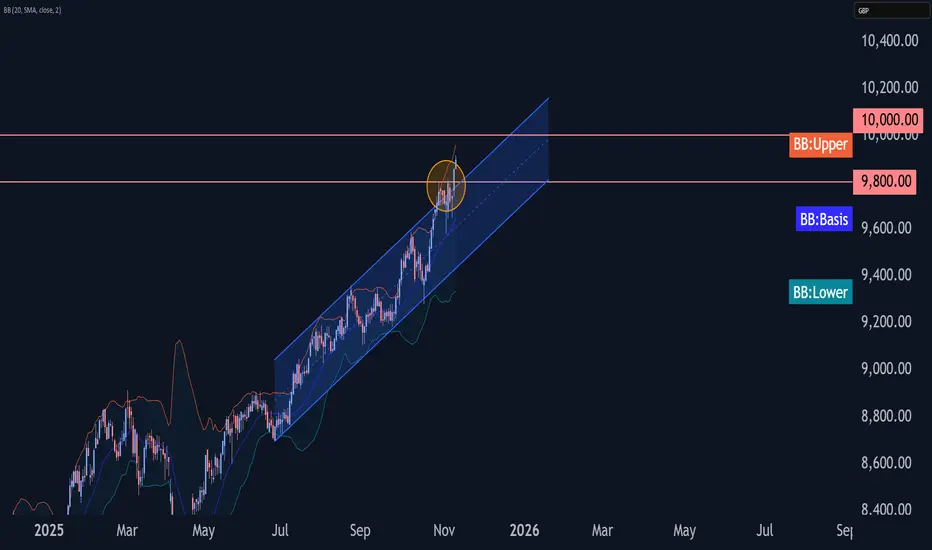
FTSE 100 index Wave Analysis – 11 November 2025- FTSE 100 index broke resistance area
- Likely to rise to resistance level 10000.00
FTSE 100 index recently broke the resistance area between the resistance level 9800.00 and the resistance trendline of the daily up channel from June.
The breakout of this resistance area accelerated the active short-term impulse wave iii of the sharp upward impulse wave 5 from the start of September.
Given the clear daily uptrend, FTSE 100 index can be expected to rise to the next round resistance level 10000.00 (target price for the completion of the active impulse wave iii).
FTSE100 Support retest The FTSE remains in a bullish trend, with recent price action showing signs of a breakout within the broader uptrend.
Support Zone: 9646 – a key level from previous consolidation. Price is currently testing or approaching this level.
A bullish rebound from 9646 would confirm ongoing upside momentum, with potential targets at:
9770 – initial resistance
9800 – psychological and structural level
9845 – extended resistance on the longer-term chart
Bearish Scenario:
A confirmed break and daily close below 9646 would weaken the bullish outlook and suggest deeper downside risk toward:
9595 – minor support
9554 – stronger support and potential demand zone
Outlook:
Bullish bias remains intact while the FTSE holds above 9646. A sustained break below this level could shift momentum to the downside in the short term.
This communication is for informational purposes only and should not be viewed as any form of recommendation as to a particular course of action or as investment advice. It is not intended as an offer or solicitation for the purchase or sale of any financial instrument or as an official confirmation of any transaction. Opinions, estimates and assumptions expressed herein are made as of the date of this communication and are subject to change without notice. This communication has been prepared based upon information, including market prices, data and other information, believed to be reliable; however, Trade Nation does not warrant its completeness or accuracy. All market prices and market data contained in or attached to this communication are indicative and subject to change without notice.

FTSE sideways consolidation capped at 9770The FTSE remains in a bullish trend, with recent price action showing signs of a breakout within the broader uptrend.
Support Zone: 9646 – a key level from previous consolidation. Price is currently testing or approaching this level.
A bullish rebound from 9646 would confirm ongoing upside momentum, with potential targets at:
9770 – initial resistance
9800 – psychological and structural level
9845 – extended resistance on the longer-term chart
Bearish Scenario:
A confirmed break and daily close below 9646 would weaken the bullish outlook and suggest deeper downside risk toward:
9595 – minor support
9554 – stronger support and potential demand zone
Outlook:
Bullish bias remains intact while the FTSE holds above 9646. A sustained break below this level could shift momentum to the downside in the short term.
This communication is for informational purposes only and should not be viewed as any form of recommendation as to a particular course of action or as investment advice. It is not intended as an offer or solicitation for the purchase or sale of any financial instrument or as an official confirmation of any transaction. Opinions, estimates and assumptions expressed herein are made as of the date of this communication and are subject to change without notice. This communication has been prepared based upon information, including market prices, data and other information, believed to be reliable; however, Trade Nation does not warrant its completeness or accuracy. All market prices and market data contained in or attached to this communication are indicative and subject to change without notice.

LSE: Losing IPO Volume, Gaining Strategic AutonomyIn the third quarter, the London Stock Exchange dropped out of the top 20 global IPO markets for the first time in many years, ranking 23rd in the Bloomberg rating . This is an unexpected turn for an exchange that has long ranked among the world's leading venues for public offerings and attracted capital from across the globe for decades. In the current ranking, it was surpassed by the exchanges in Singapore, Mexico, and even Oman.
London may be losing IPO volume, but not control
At first glance, it may indeed seem that London is losing its influence. But if you look deeper, the root cause is that IPOs themselves have lost popularity in recent years: due to high interest rates, many companies preferred to postpone going public. According to EY reports by the end of 2024, the total number of global IPOs was 1215, compared to 1351 in 2023 .
Investors have also been cautious. In the current environment, it is pretty difficult to predict which companies going public will be successful and which will not. So, capital has been directed to other instruments. However, the situation is gradually changing: interest rates around the world are falling, opening a window of opportunity, especially for technology companies.
Britain's Post-Brexit Regulatory
Against this backdrop, each economy reacted in its own way. The UK decided not to wait for external conditions to improve, but to seize the moment to make systemic changes. After Brexit, the UK began to build its own regulatory system, independent of Brussels and Washington. The country effectively acknowledged that it would not be able to meet both European and American standards at the same time and decided to develop its own British model of regulation.
You might settle for a slice of a sprawling feast that doesn't suit your appetite. Or, you could prepare your own pudding-perhaps less grand, but crafted to your liking. London has embraced the pudding approach. This means that the United Kingdom understands that it is losing volume, but wants to build a system in which it sets the rules of the game and doesn’t have to contend with foreign bureaucracy. In the rankings this looks like a decline and a decrease in attractiveness, but what we are seeing here is a change of model. London remains an important center of capital, but its role now – to demonstrate autonomy.
So, why are some companies leaving the British market?
In fact, each company makes its own decision about where to go public, and it is not always because of bias against London. Unilever (LSE:ULVR), for example, is not leaving Britain at all. Post-Brexit, however, regulatory divergence made it impractical to maintain equal footing across both EU and UK frameworks. As a company with deep European roots, Unilever has designated Amsterdam as the primary listing for its ice cream division while retaining a secondary listing in London. This isn't a complete departure, its more like a strategic rebalancing that keeps London as part of its dual-listing structure, ensuring access to the U.S. and U.K. markets without full relocation.
In addition, the self-identification of companies also plays a role. Take, for example, the ESG agenda. Formally, it exists in both Europe and the UK, but even within this acronym (environmental, social, governance), the emphasis is different in different regions. For Europe, ESG is a mandatory part of any regulations with a strong focus on environmental friendliness. In the UK, the approach is more flexible, with greater attention paid to social issues in some areas.
That is why companies choose the market that is closer to their philosophy. Ultimately, this is not a question of London losing its appeal.
Asian markets are growing, but not forever
At the same time, there is no point in denying that the role of Asian markets is constantly growing. Over the past year, the total volume of IPOs in Asia has skyrocketed by 80%. Nevertheless, it seems that the prospects for these markets are now exaggerated a little bit.
Yet, this momentum follows a familiar historical pattern seen in several economies. Japan in the 1980s, South Korea in the 1990s, and China in the 2000s each experienced explosive export-led growth, only to face structural slowdowns as demographic pressures, rising debt, and shifting global trade dynamics took hold. The transitions weren't uniform or inevitable, but they do highlight recurring challenges in sustaining high growth over decades. Of course, we can single out Singapore with its adaptive management system and resilience, but it remains the exception rather than the rule. For this reason, we should continue to treat Asia with caution as a reliable engine of long-term stable growth.
In the short term, I would rather bet on Europe. For example, more and more companies are going public in Poland, while others are choosing Amsterdam and Stockholm. And this is just one of many examples of how European markets are quite capable of growing steadily. The main thing is not to give in to alarmist sentiments, but to look at any market calmly and without undue panic. London has certainly lost some of its IPO volume, but in my opinion, it should not be written off.

FTSE overbought corrective pullback support at 9646The FTSE remains in a bullish trend, with recent price action showing signs of a breakout within the broader uptrend.
Support Zone: 9646 – a key level from previous consolidation. Price is currently testing or approaching this level.
A bullish rebound from 9646 would confirm ongoing upside momentum, with potential targets at:
9770 – initial resistance
9800 – psychological and structural level
9845 – extended resistance on the longer-term chart
Bearish Scenario:
A confirmed break and daily close below 9646 would weaken the bullish outlook and suggest deeper downside risk toward:
9595 – minor support
9554 – stronger support and potential demand zone
Outlook:
Bullish bias remains intact while the FTSE holds above 9646. A sustained break below this level could shift momentum to the downside in the short term.
This communication is for informational purposes only and should not be viewed as any form of recommendation as to a particular course of action or as investment advice. It is not intended as an offer or solicitation for the purchase or sale of any financial instrument or as an official confirmation of any transaction. Opinions, estimates and assumptions expressed herein are made as of the date of this communication and are subject to change without notice. This communication has been prepared based upon information, including market prices, data and other information, believed to be reliable; however, Trade Nation does not warrant its completeness or accuracy. All market prices and market data contained in or attached to this communication are indicative and subject to change without notice.

FTSE bullish breakout support at 9646The FTSE remains in a bullish trend, with recent price action showing signs of a breakout within the broader uptrend.
Support Zone: 9646 – a key level from previous consolidation. Price is currently testing or approaching this level.
A bullish rebound from 9646 would confirm ongoing upside momentum, with potential targets at:
9770 – initial resistance
9800 – psychological and structural level
9845 – extended resistance on the longer-term chart
Bearish Scenario:
A confirmed break and daily close below 9646 would weaken the bullish outlook and suggest deeper downside risk toward:
9595 – minor support
9554 – stronger support and potential demand zone
Outlook:
Bullish bias remains intact while the FTSE holds above 9646. A sustained break below this level could shift momentum to the downside in the short term.
This communication is for informational purposes only and should not be viewed as any form of recommendation as to a particular course of action or as investment advice. It is not intended as an offer or solicitation for the purchase or sale of any financial instrument or as an official confirmation of any transaction. Opinions, estimates and assumptions expressed herein are made as of the date of this communication and are subject to change without notice. This communication has been prepared based upon information, including market prices, data and other information, believed to be reliable; however, Trade Nation does not warrant its completeness or accuracy. All market prices and market data contained in or attached to this communication are indicative and subject to change without notice.

INTRADAY ascendinc triangle Monday close in break out, tuesday ascending triangle build in 3 session

FTSE 100 (UKX) | Targeting 17K → 23K → 50K The British Bull Awakens 🏴📈 | The British Bull Awakens 🏴📈 | The British Bull Awakens 🏴📈
Macro Wave 3 of SuperCycle 3 in full motion — 17K next, then 23K before Wave 4 reset and grand finale 50K .
The FTSE 100 is mid-way through its most powerful Elliott Wave phase in decades — Macro Wave (3) of SuperCycle (3).
A generational breakout is forming, with Fibonacci confluence and institutional flow pointing toward 17K and beyond. ⚡
🧩 The SuperCycle Map
📈 SuperCycle Wave (1) (1989–2000) → Globalization & tech boom = foundation of modern bull market.
📉 SuperCycle Wave (2) (2000–2009) → Dot-com + GFC reset the system with a 0.618 retrace.
⚡ SuperCycle Wave (3) (2009–Present) → Now in progress — a generational expansion wave unfolding.
Inside it:
Macro (1): 2009–2018 post-crisis recovery
Macro (2): 2018–2020 correction
Macro (3): 2020–Now → Targeting ~17,000
Macro (4): 2029–2033 est. → Retrace to 10–12K
Macro (5): 2033–2037 est. → Push to ~23,000
Then:
🌀 SuperCycle (4) = multi-year correction
🌟 SuperCycle (5) = grand finale toward ~50,000
💹 Wave Confluence & Fibonacci Geometry
2.618 extension → 17K (Macro 3 target)
3.618 extension → 23K (Macro 5 projection)
Historic 0.5–0.618 retraces at every cycle confirm proportional balance.
Long-term regression & wave symmetry both support this structure.
🧭 Smart Money & Market Structure
✅ Accumulation base: 7K–9K (institutional demand zones)
✅ Break of Structure (BoS) → confirmed expansion
✅ Fair Value Gaps below 9K → future liquidity magnets for Macro 4
✅ Continuous higher highs & order block footprints = Smart Money in control
📊 The FTSE remains in expansion phase , pushing through new structural highs as liquidity builds.
🌍 Macro Fundamentals
UK equities undervalued vs. global peers
Normalizing rates + disinflation = valuation tailwinds
Long-term flows into energy, AI, infrastructure
Institutional rotation into real assets supports the multi-decade rally
🎯 Targets Ahead
📍 Macro 3 (short-term): ~17,000
🔄 Macro 4 retrace: ~10–12K
🚀 Macro 5: ~23,000
🌀 SuperCycle 4 correction: multi-year base
🌟 SuperCycle 5: ~50,000
📈 This is the belief phase of a generational bull market — Macro Wave (3) within SuperCycle (3).
Patience now could pay off for decades.
💬 What’s your FTSE target — 17K, 23K, or 50K?
👇 Comment below and Follow for future wave updates & Smart Money confluence setups.
— Team FIBCOS
#FTSE100 #ElliottWave #SmartMoneyConcept #Fibonacci #WaveTheory #MarketStructure #MacroInvesting #TradingView #FIBCOS #BullMarket #Wave3 #PriceAction #UKX #Investing #MacroCycle

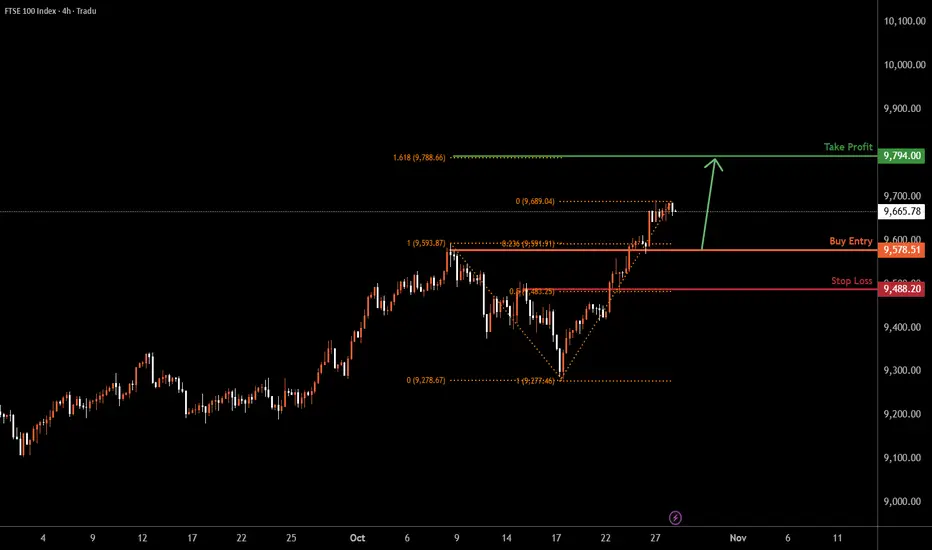
UK100 H4 | ullish Bounce off Pullback SupportUK100 is falling towards the buy entry, which is a pullback support that lines up with the 23.6% Fibonacci retracement and could bounce from this level to the upside.
Buy entry is at 9,578.51, which is a pullback support that aligns with the 23.6% Fibonacci retracement.
Stop loss is at 9,488.20, which is a pullback suport that aligns with the 50% Fibonacci retracement.
Take profit: 9,794.00, which is a resistance level that aligns with hte 161.8% Fibonacci extension.
Stratos Markets Limited (tradu.com):
CFDs are complex instruments and come with a high risk of losing money rapidly due to leverage. 68% of retail investor accounts lose money when trading CFDs with this provider. You should consider whether you understand how CFDs work and whether you can afford to take the high risk of losing your money.
Stratos Europe Ltd (tradu.com ):
CFDs are complex instruments and come with a high risk of losing money rapidly due to leverage. 70% of retail investor accounts lose money when trading CFDs with this provider. You should consider whether you understand how CFDs work and whether you can afford to take the high risk of losing your money.
FTSE bullish breakout supported at 9550The FTSE remains in a bullish trend, with recent price action showing signs of a breakout within the broader uptrend.
Support Zone: 9550 – a key level from previous consolidation. Price is currently testing or approaching this level.
A bullish rebound from 9550 would confirm ongoing upside momentum, with potential targets at:
9706 – initial resistance
9740 – psychological and structural level
9800 – extended resistance on the longer-term chart
Bearish Scenario:
A confirmed break and daily close below 9550 would weaken the bullish outlook and suggest deeper downside risk toward:
9526 – minor support
9483 – stronger support and potential demand zone
Outlook:
Bullish bias remains intact while the FTSE holds above 9550. A sustained break below this level could shift momentum to the downside in the short term.
This communication is for informational purposes only and should not be viewed as any form of recommendation as to a particular course of action or as investment advice. It is not intended as an offer or solicitation for the purchase or sale of any financial instrument or as an official confirmation of any transaction. Opinions, estimates and assumptions expressed herein are made as of the date of this communication and are subject to change without notice. This communication has been prepared based upon information, including market prices, data and other information, believed to be reliable; however, Trade Nation does not warrant its completeness or accuracy. All market prices and market data contained in or attached to this communication are indicative and subject to change without notice.

UK100 Strategy Map: SMA Pullback Meets Heikin Ashi Signal🚀 UK100 Index Market Wealth Strategy Map (Swing/Day Trade)
📊 Plan
🔹 Bias: Bullish trend confirmed
🔹 Method: Simple Moving Average (SMA-382) pullback + bullish Heikin Ashi candle confirmation + Double bottom pullback detected.
🔹 Style: Thief layering strategy (multiple limit orders to build position)
🎯 Entry Plan
💡 Using layer entries (multiple limit orders) for flexibility:
Buy Limit @ 9220
Buy Limit @ 9230
Buy Limit @ 9240
Buy Limit @ 9250
👉 (Layers can be increased depending on market context — this is just my thief-style approach 🕵️)
🛡️ Stop Loss (Thief SL)
Protective Stop @ 9190
⚠️ Note: Dear Ladies & Gentlemen (Thief OG’s) — this is my style of SL. You can manage risk in your own way.
💰 Target
Exit Zone @ 9330 (near strong resistance + overbought area + possible trap zone)
⚠️ Note: Not financial advice — escape with profits when the market gives!
🔑 Thief Notes
This is my OG layering strategy — I don’t set rigid SL/TP rules for everyone. Manage your own risk 💼.
Goal: Catch the swing, ride the bullish confirmation, and exit before trap levels lock profits.
🌍 Related Pairs to Watch
Because UK100 often correlates with global indices & USD movements:
FOREXCOM:SPX500 (US equities correlation, risk sentiment driver)
GOMARKETS:DAX40 (European equity benchmark, strong correlation with UK100)
FX:USDJPY (risk-on/risk-off sentiment gauge)
FX:GBPUSD (pound strength can influence UK equities indirectly)
Watching these helps confirm whether the UK100 move is supported by broader market flows 📈🌐
✨ “If you find value in my analysis, a 👍 and 🚀 boost is much appreciated — it helps me share more setups with the community!”
⚠️ Disclaimer: This is the Thief Style Trading Strategy — created for fun & educational purposes only. Not financial advice. Trade at your own risk.
#UK100 #FTSE100 #IndexTrading #SwingTrade #DayTrading #HeikinAshi #SMA #ThiefStrategy #SPX500 #DAX40 #GBPUSD #USDJPY #TradingCommunity

FTSE Bullish breakout supported at 9490The FTSE remains in a bullish trend, with recent price action showing signs of a breakout within the broader uptrend.
Support Zone: 9490 – a key level from previous consolidation. Price is currently testing or approaching this level.
A bullish rebound from 9490 would confirm ongoing upside momentum, with potential targets at:
9600 – initial resistance
9650 – psychological and structural level
9700 – extended resistance on the longer-term chart
Bearish Scenario:
A confirmed break and daily close below 9490 would weaken the bullish outlook and suggest deeper downside risk toward:
9465 – minor support
9440 – stronger support and potential demand zone
Outlook:
Bullish bias remains intact while the FTSE holds above 9490. A sustained break below this level could shift momentum to the downside in the short term.
This communication is for informational purposes only and should not be viewed as any form of recommendation as to a particular course of action or as investment advice. It is not intended as an offer or solicitation for the purchase or sale of any financial instrument or as an official confirmation of any transaction. Opinions, estimates and assumptions expressed herein are made as of the date of this communication and are subject to change without notice. This communication has been prepared based upon information, including market prices, data and other information, believed to be reliable; however, Trade Nation does not warrant its completeness or accuracy. All market prices and market data contained in or attached to this communication are indicative and subject to change without notice.

FTSE: hunt on previous highs. An excellent set-up with FTSE sweeping the weekly internal range liquidity first before aiming for external range above. Daily RSI support the trade along with bullish divergence. Text-book.
