Trendline break The price has broken out of a bearish trendline which was a consolidation as the price is still in a bullish trend, the price now looks to make a small pullback then, we expect a bullish impulse
WE ONLY TRADE PULLBACKS
Comment your thoughts
Trade ideas

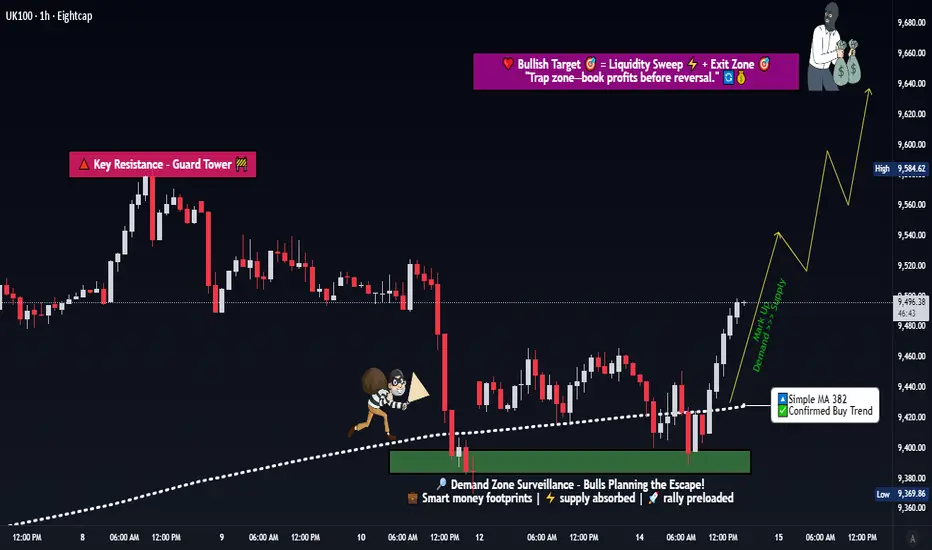
Is This the Perfect Retest for UK100 Buyers to Step In?💹 UK100 “Thief’s Layered Breakout Plan” | Bullish Retest Playbook 🏴☠️
Asset: UK100 Index CFD – Swing/Day Trade Opportunity Guide
Bias: 🔼 Bullish, confirmed by retest at the Simple Moving Average (SMA)
📊 Trade Plan:
The market structure shows a clean SMA retest zone, supporting a potential bullish continuation.
Our Thief Strategy uses layered entries — a pro-style method to catch price action across zones instead of waiting for a single perfect candle.
📍 Layered Buy Limits:
→ 9420
→ 9440
→ 9460
→ 9480
(You can increase layers based on your risk appetite and liquidity read)
🛑 Stop Loss (Thief SL): 9360
💰 Target: 9640 — “The Police Barricade” ⚠️ acting as resistance, overbought zone, and potential liquidity trap.
⚠️ Note to all Thief OG’s:
This setup is not financial advice — use my idea for educational purposes only. Manage your own SL and TP based on your plan and capital. You rob the market — but wisely.
🧠 Technical Key Points:
SMA Retest Confirmation: Confirms bullish continuation on lower timeframes.
Liquidity Sweep: Smart money grabbed stops near 9360 before reversal.
Momentum Rebuild: Buyers reloading via hidden accumulation layers.
Target Zone: Strong supply area near 9640 (watch for profit-taking).
🔗 Correlated Market Watch:
TVC:DXY – Inverse correlation; weaker USD can fuel UK100 strength.
SP:SPX / TVC:DJI – Risk-on sentiment confirmation.
SPREADEX:FTSE Futures – Directly mirrors UK100; monitor for intraday direction bias.
TVC:GOLD – Hedge flow signal; gold weakness can indicate equity strength.
Keep these on your radar — they add confluence to our Thief’s plan.
🎯 Thief’s Market Wisdom:
“You don’t chase the move — you build layers before it wakes up.
Smart traders rob the market with patience, not panic.” 💼
✨ If you find value in my analysis, a 👍 and 🚀 boost is much appreciated — it helps me share more setups with the community!
⚠️ Disclaimer:
This is a Thief-style trading strategy created just for fun and educational purposes — not financial advice. Trade at your own risk and reward.
#UK100 #FTSE #IndexTrading #SmartMoneyConcepts #PriceAction #SwingTrade #DayTrading #TradingPlan #MarketStructure #BullishSetup #ThiefTrader #LayeredEntry #CFDTrading #TechnicalAnalysis #ForexCommunity
FTSE Oversold bounce back support at 9365The FTSE remains in a bullish trend, with recent price action showing signs of a breakout within the broader uptrend.
Support Zone: 9365 – a key level from previous consolidation. Price is currently testing or approaching this level.
A bullish rebound from 9365 would confirm ongoing upside momentum, with potential targets at:
9486 – initial resistance
9516 – psychological and structural level
9550 – extended resistance on the longer-term chart
Bearish Scenario:
A confirmed break and daily close below 9365 would weaken the bullish outlook and suggest deeper downside risk toward:
9340 – minor support
9307 – stronger support and potential demand zone
Outlook:
Bullish bias remains intact while the FTSE holds above 9365. A sustained break below this level could shift momentum to the downside in the short term.
This communication is for informational purposes only and should not be viewed as any form of recommendation as to a particular course of action or as investment advice. It is not intended as an offer or solicitation for the purchase or sale of any financial instrument or as an official confirmation of any transaction. Opinions, estimates and assumptions expressed herein are made as of the date of this communication and are subject to change without notice. This communication has been prepared based upon information, including market prices, data and other information, believed to be reliable; however, Trade Nation does not warrant its completeness or accuracy. All market prices and market data contained in or attached to this communication are indicative and subject to change without notice.

FTSE Bullish consolidation supported at 9470The FTSE remains in a bullish trend, with recent price action showing signs of a corrective pullback within the broader uptrend.
Support Zone: 9470 – a key level from previous consolidation. Price is currently testing or approaching this level.
A bullish rebound from 9470 would confirm ongoing upside momentum, with potential targets at:
9550 – initial resistance
9566 – psychological and structural level
9580 – extended resistance on the longer-term chart
Bearish Scenario:
A confirmed break and daily close below 9470 would weaken the bullish outlook and suggest deeper downside risk toward:
9445 – minor support
9416 – stronger support and potential demand zone
Outlook:
Bullish bias remains intact while the FTSE holds above 9466. A sustained break below this level could shift momentum to the downside in the short term.
This communication is for informational purposes only and should not be viewed as any form of recommendation as to a particular course of action or as investment advice. It is not intended as an offer or solicitation for the purchase or sale of any financial instrument or as an official confirmation of any transaction. Opinions, estimates and assumptions expressed herein are made as of the date of this communication and are subject to change without notice. This communication has been prepared based upon information, including market prices, data and other information, believed to be reliable; however, Trade Nation does not warrant its completeness or accuracy. All market prices and market data contained in or attached to this communication are indicative and subject to change without notice.

FTSE rally resistance at 9550The FTSE remains in a bullish trend, with recent price action showing signs of a corrective pullback within the broader uptrend.
Support Zone: 9470 – a key level from previous consolidation. Price is currently testing or approaching this level.
A bullish rebound from 9470 would confirm ongoing upside momentum, with potential targets at:
9550 – initial resistance
9566 – psychological and structural level
9580 – extended resistance on the longer-term chart
Bearish Scenario:
A confirmed break and daily close below 9470 would weaken the bullish outlook and suggest deeper downside risk toward:
9445 – minor support
9416 – stronger support and potential demand zone
Outlook:
Bullish bias remains intact while the FTSE holds above 9466. A sustained break below this level could shift momentum to the downside in the short term.
This communication is for informational purposes only and should not be viewed as any form of recommendation as to a particular course of action or as investment advice. It is not intended as an offer or solicitation for the purchase or sale of any financial instrument or as an official confirmation of any transaction. Opinions, estimates and assumptions expressed herein are made as of the date of this communication and are subject to change without notice. This communication has been prepared based upon information, including market prices, data and other information, believed to be reliable; however, Trade Nation does not warrant its completeness or accuracy. All market prices and market data contained in or attached to this communication are indicative and subject to change without notice.

UK100 H1 | Bearish Breakdown in ProgressUK100 has rejected the sell entry at 9,543.37, which is a pullback resistance that lines up with the 50% Fibonacci retracement and could drop from this level to the downside.
Stop loss is at 9,591.20, which is a swing high resistance.
Take profit is at 9,430.25, which is a pullback support that aligns with the 38.2% Fibonacci retracement.
High Risk Investment Warning
Trading Forex/CFDs on margin carries a high level of risk and may not be suitable for all investors. Leverage can work against you.
Stratos Markets Limited (tradu.com ):
CFDs are complex instruments and come with a high risk of losing money rapidly due to leverage. 65% of retail investor accounts lose money when trading CFDs with this provider. You should consider whether you understand how CFDs work and whether you can afford to take the high risk of losing your money.
Stratos Europe Ltd (tradu.com ):
CFDs are complex instruments and come with a high risk of losing money rapidly due to leverage. 66% of retail investor accounts lose money when trading CFDs with this provider. You should consider whether you understand how CFDs work and whether you can afford to take the high risk of losing your money.
Stratos Global LLC (tradu.com ):
Losses can exceed deposits.
Please be advised that the information presented on TradingView is provided to Tradu (‘Company’, ‘we’) by a third-party provider (‘TFA Global Pte Ltd’). Please be reminded that you are solely responsible for the trading decisions on your account. There is a very high degree of risk involved in trading. Any information and/or content is intended entirely for research, educational and informational purposes only and does not constitute investment or consultation advice or investment strategy. The information is not tailored to the investment needs of any specific person and therefore does not involve a consideration of any of the investment objectives, financial situation or needs of any viewer that may receive it. Kindly also note that past performance is not a reliable indicator of future results. Actual results may differ materially from those anticipated in forward-looking or past performance statements. We assume no liability as to the accuracy or completeness of any of the information and/or content provided herein and the Company cannot be held responsible for any omission, mistake nor for any loss or damage including without limitation to any loss of profit which may arise from reliance on any information supplied by TFA Global Pte Ltd.
The speaker(s) is neither an employee, agent nor representative of Tradu and is therefore acting independently. The opinions given are their own, constitute general market commentary, and do not constitute the opinion or advice of Tradu or any form of personal or investment advice. Tradu neither endorses nor guarantees offerings of third-party speakers, nor is Tradu responsible for the content, veracity or opinions of third-party speakers, presenters or participants.

FTSE 100 Wave Analysis – 8 October 2025- FTSE 100 broke round resistance level 9330.00
- Likely to rise to resistance level 9612.00
FTSE 100 index recently broke the resistance level 9330.00, which stopped the previous impulse waves (5) and (1).
The breakout of the resistance level 9330.00 accelerated the active intermediate impulse wave (3) from September – which then broke the daily up channel from July.
Given the strong daily uptrend, FTSE 100 index can be expected to rise to the next resistance level 9612.00 (target price for the completion of the active impulse wave (3).

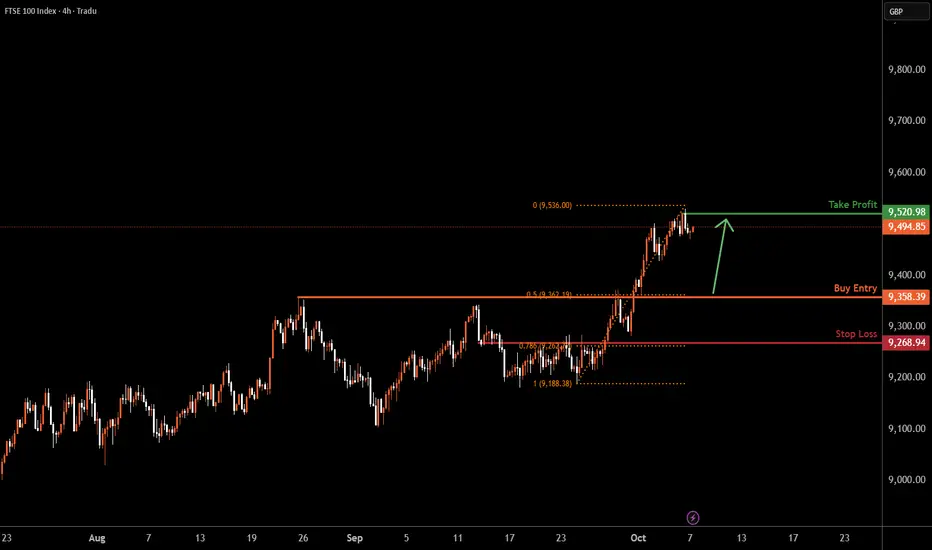
UK100 H4 | Bullish Rebound from Key Support LevelBased on the H4 chart analysis, we could see the price fall to the buy entry at 9,358.39, which is a pullback support that aligns with the 50% Fibonacci retracement and could bounce from this level to the upside.
Stop loss is at 9,268.94, which is a pullback support that lines up with the 78.6% Fibonacci retracement.
Take profit is at 9,520.98, which is a swing high resistance.
High Risk Investment Warning
Trading Forex/CFDs on margin carries a high level of risk and may not be suitable for all investors. Leverage can work against you.
Stratos Markets Limited (tradu.com ):
CFDs are complex instruments and come with a high risk of losing money rapidly due to leverage. 65% of retail investor accounts lose money when trading CFDs with this provider. You should consider whether you understand how CFDs work and whether you can afford to take the high risk of losing your money.
Stratos Europe Ltd (tradu.com ):
CFDs are complex instruments and come with a high risk of losing money rapidly due to leverage. 66% of retail investor accounts lose money when trading CFDs with this provider. You should consider whether you understand how CFDs work and whether you can afford to take the high risk of losing your money.
Stratos Global LLC (tradu.com ):
Losses can exceed deposits.
Please be advised that the information presented on TradingView is provided to Tradu (‘Company’, ‘we’) by a third-party provider (‘TFA Global Pte Ltd’). Please be reminded that you are solely responsible for the trading decisions on your account. There is a very high degree of risk involved in trading. Any information and/or content is intended entirely for research, educational and informational purposes only and does not constitute investment or consultation advice or investment strategy. The information is not tailored to the investment needs of any specific person and therefore does not involve a consideration of any of the investment objectives, financial situation or needs of any viewer that may receive it. Kindly also note that past performance is not a reliable indicator of future results. Actual results may differ materially from those anticipated in forward-looking or past performance statements. We assume no liability as to the accuracy or completeness of any of the information and/or content provided herein and the Company cannot be held responsible for any omission, mistake nor for any loss or damage including without limitation to any loss of profit which may arise from reliance on any information supplied by TFA Global Pte Ltd.
The speaker(s) is neither an employee, agent nor representative of Tradu and is therefore acting independently. The opinions given are their own, constitute general market commentary, and do not constitute the opinion or advice of Tradu or any form of personal or investment advice. Tradu neither endorses nor guarantees offerings of third-party speakers, nor is Tradu responsible for the content, veracity or opinions of third-party speakers, presenters or participants.
Will The FTSE100 Breakout Trigger This Bullish Plan?🎯 Title: UK100/FTSE100 Money Heist Plan: Bullish Breakout Play (Swing Trade) 💰⚡
Asset: #UK100 #FTSE100 ( TVC:UKOIL , FX:GBPUSD , OANDA:EURGBP )
🗺️ The Heist Plan Overview
Ladies & Gentlemen, Thief OG's! 👋🕵️♂️ Welcome to the vault. Our plan is a calculated BULLISH swing trade on the UK100, triggered by a key breakout. We're not kicking the door down; we're waiting for the alarm to be disabled first.
Trade Bias: Bullish (Pending Order Plan) 📈
Strategy: "The Thief" Layering Entry (Minimizes risk, maximizes opportunity)
Key Level: 9,250.00 – The Vault Door 🚪
⚡ Execution Details (The How)
ENTRY CONFIRMATION: We only move after a CONFIRMED BREAKOUT above 9,250.00. ⚡
SET AN ALARM! {{ticker}} > 9250 - Don't miss the signal!
ENTRY METHOD ("The Thief" Layer Strategy): 🎯
Instead of one risky entry, we use multiple BUY LIMIT orders placed below the breakout level to catch any retest. This is a sophisticated, risk-aware method.
Layer 1: 9,200.00
Layer 2: 9,225.00
Layer 3: 9,250.00 (Breakout Level Retest)
You can add more layers (e.g., 9,275) based on your capital & risk appetite.
STOP LOSS (The Escape Route): 🚨
My SL: 9,150.00 (Place after your entry is filled).
⚠️ IMPORTANT NOTE: This is MY plan. You, the Thief OG, MUST adjust your stop loss based on your own risk management strategy. Protect your capital.
TAKE PROFIT (The Escape with the Money): 💎
TP Target: 9,400.00
Why Here? This aligns with a major historical resistance zone, potential overbought conditions, and a classic bull trap area. Escape with your stolen profits before the market reverses!
⚠️ IMPORTANT NOTE: You can choose to take partial profits earlier or trail your stop. "Make money then take money at your own risk."
🕵️♂️ Why This Heist? (The Analysis)
This isn't a random guess. It's a plan backed by data.
📊 Real-Time Snapshot (#UK100CFD)
Daily Change: -0.09% 📉 (A slight dip for a better entry?)
1-Month Performance: +0.48% 📈
1-Year Performance: +12.55% 🚀 (Strong underlying trend)
😊 Market Sentiment & Fear/Greed
Retail Sentiment: 55% Bullish 🐂 | 45% Bearish 🐻
Institutional Sentiment: 60% Bullish 🐂 | 40% Bearish 🐻
Overall Mood: Moderately Bullish 😊
Fear & Greed Index: 53/100 (Neutral) ⚖️
This suggests the market is not overly euphoric or fearful, providing a stable backdrop for our breakout play.
📈 Fundamental & Macro Backdrop:
Fundamental Score: 65/100 ✅
Strong earnings in defensive sectors (Healthcare, Energy). 💪
Attractive valuations vs. US indices (P/E 20% below S&P 500). 💰
Stable UK interest rate environment. 📊
Macro Score: 55/100 ⚖️ (Caution Advised)
Risks: UK GDP contraction (-0.3%) and global trade tensions. 📉🌎
Support: Bank of England rate cuts providing a floor. 🏦
Overall Outlook: 60/100 (Mildly Bullish) 🐂
The resilience of the FTSE100, combined with solid fundamentals and neutral sentiment, creates a favorable setup for a breakout to the upside.
✅ Related Pairs to Watch
TVC:UKOIL (BP/Shell correlation)
FX:GBPUSD (GBP strength/weakness)
OANDA:EURGBP (UK vs. Eurozone strength)
✨ “If you find value in my analysis, a 👍 and 🚀 boost is much appreciated — it helps me share more setups with the community!”
#Trading #Investing #SwingTrading #Breakout #Strategy #LayerStrategy #UK100 #FTSE #CFD #Protest #MoneyHeist #Plan

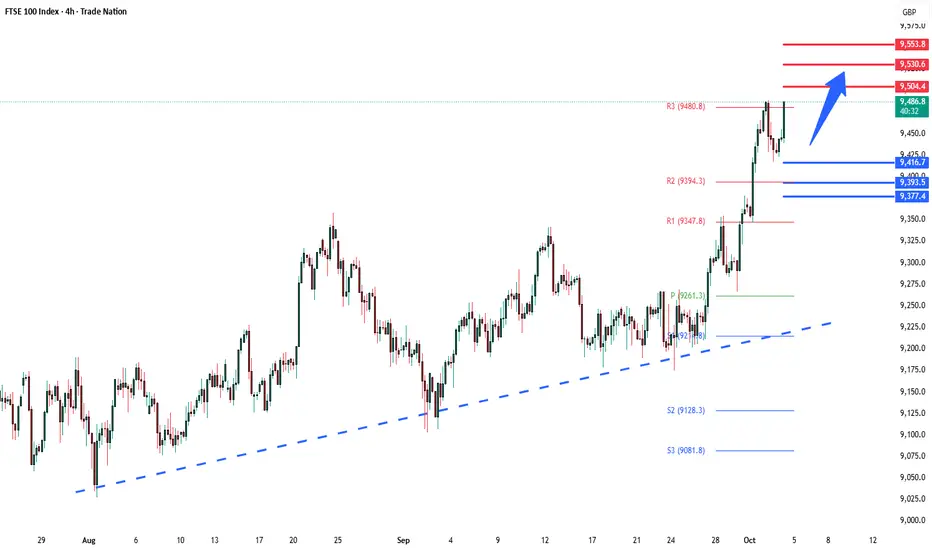
FTSE100 resistance retestThe FTSE remains in a bullish trend, with recent price action showing signs of a breakout within the broader uptrend.
Support Zone: 9417 – a key level from previous consolidation. Price is currently testing or approaching this level.
A bullish rebound from 9417 would confirm ongoing upside momentum, with potential targets at:
9500 – initial resistance
9530 – psychological and structural level
9550 – extended resistance on the longer-term chart
Bearish Scenario:
A confirmed break and daily close below 9417 would weaken the bullish outlook and suggest deeper downside risk toward:
9393 – minor support
9377 – stronger support and potential demand zone
Outlook:
Bullish bias remains intact while the FTSE holds above 9416. A sustained break below this level could shift momentum to the downside in the short term.
This communication is for informational purposes only and should not be viewed as any form of recommendation as to a particular course of action or as investment advice. It is not intended as an offer or solicitation for the purchase or sale of any financial instrument or as an official confirmation of any transaction. Opinions, estimates and assumptions expressed herein are made as of the date of this communication and are subject to change without notice. This communication has been prepared based upon information, including market prices, data and other information, believed to be reliable; however, Trade Nation does not warrant its completeness or accuracy. All market prices and market data contained in or attached to this communication are indicative and subject to change without notice.


FTSE closes in on 9.5KThe FTSE 100 (+0.7%) has continued to push higher along with other European indices. The UK benchmark index has actually hit a new record high today to close in on the 9,500 level. Distributor Bunzl (+4%) leads the blue chips while miners such as Fresnillo are also among the gainers amid rallying metals prices.
As we have been banging on about it, the FTSE remains in a strong bullish trend and dips are continuing to be bought with resistance levels giving way. Old resistance at 9,360 is now the most important short-term support to watch. Below that 9,270 is the next key level where a trend line converges.
By Fawad Razaqzada, market analyst with FOREX.com

FTSE100 Continuation of bullish runThe FTSE remains in a bullish trend, with recent price action showing signs of a breakout within the broader uptrend.
Support Zone: 9417 – a key level from previous consolidation. Price is currently testing or approaching this level.
A bullish rebound from 9417 would confirm ongoing upside momentum, with potential targets at:
9500 – initial resistance
9530 – psychological and structural level
9550 – extended resistance on the longer-term chart
Bearish Scenario:
A confirmed break and daily close below 9417 would weaken the bullish outlook and suggest deeper downside risk toward:
9393 – minor support
9377 – stronger support and potential demand zone
Outlook:
Bullish bias remains intact while the FTSE holds above 9416. A sustained break below this level could shift momentum to the downside in the short term.
This communication is for informational purposes only and should not be viewed as any form of recommendation as to a particular course of action or as investment advice. It is not intended as an offer or solicitation for the purchase or sale of any financial instrument or as an official confirmation of any transaction. Opinions, estimates and assumptions expressed herein are made as of the date of this communication and are subject to change without notice. This communication has been prepared based upon information, including market prices, data and other information, believed to be reliable; however, Trade Nation does not warrant its completeness or accuracy. All market prices and market data contained in or attached to this communication are indicative and subject to change without notice.
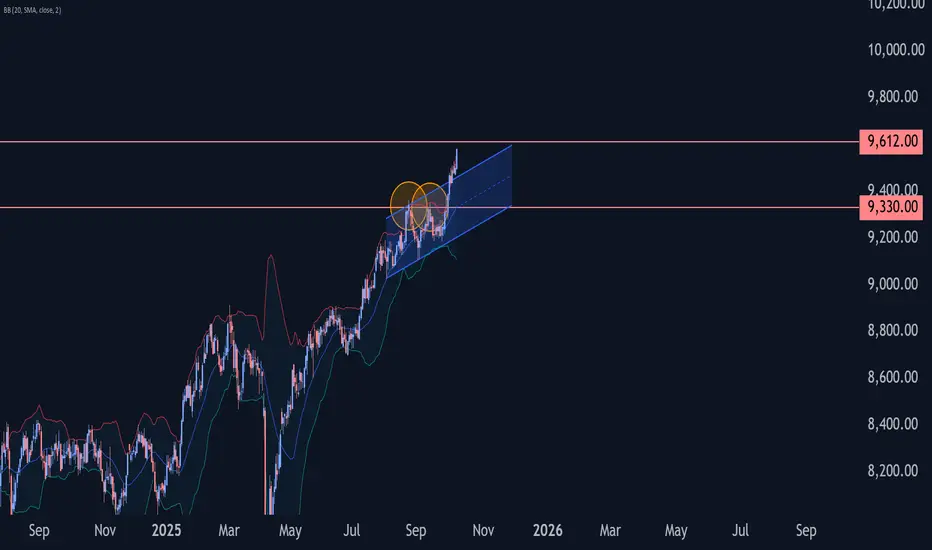
UK100 Weekly hesitation, time for correction SHORTHello
fellow traders and glass ball tellers :D finally a moment of truth-ARE WE DOING SOOOO WELLL??? hmm... By talking to people and checking out the chart looks like we are in a bubble which needs relief of the pressure for always doing so well, time will show, my idea, don't copy as it's not an advise, always protect your capital whatever you do, your money your responsibility, take care good luck

FTSE resistance breakout The FTSE remains in a bullish trend, with recent price action showing signs of a breakout within the broader uptrend.
Support Zone: 9347 – a key level from previous consolidation. Price is currently testing or approaching this level.
A bullish rebound from 9347 would confirm ongoing upside momentum, with potential targets at:
9440 – initial resistance
9480 – psychological and structural level
9500 – extended resistance on the longer-term chart
Bearish Scenario:
A confirmed break and daily close below 9347 would weaken the bullish outlook and suggest deeper downside risk toward:
9290 – minor support
9260 – stronger support and potential demand zone
Outlook:
Bullish bias remains intact while the FTSE holds above 9347. A sustained break below this level could shift momentum to the downside in the short term.
This communication is for informational purposes only and should not be viewed as any form of recommendation as to a particular course of action or as investment advice. It is not intended as an offer or solicitation for the purchase or sale of any financial instrument or as an official confirmation of any transaction. Opinions, estimates and assumptions expressed herein are made as of the date of this communication and are subject to change without notice. This communication has been prepared based upon information, including market prices, data and other information, believed to be reliable; however, Trade Nation does not warrant its completeness or accuracy. All market prices and market data contained in or attached to this communication are indicative and subject to change without notice.
UK100/FTSE100 - OPPORTUNITY TO PRINT MONEYTeam,
last trade UK100 target hit last night.
Now reaching the HOLD HIGH or NEW ATH, time for a kill
Shorting range at 9380-9400 - stop loss at 9460
Target 1 at 9356-45
target 2 at 9315-9286
lets go

UK100 H4 | Bullish bounce off 61.8% Fibonacci supportUK100 is falling towards the buy entry 9,259.83, which is a pullback support that aligns with the 61.8% Fibonacci retracement and could bounce from this level to the take profit.
Buy entry is at 9,259.83, which is a pullback support that aligns with the 61.8% Fibonacci retracement.
Stop loss is at 9,200.44, which is a pullback support.
Take profit is at 9,358.19, which is a multi swing high resistance.
High Risk Investment Warning
Trading Forex/CFDs on margin carries a high level of risk and may not be suitable for all investors. Leverage can work against you.
Stratos Markets Limited (tradu.com ):
CFDs are complex instruments and come with a high risk of losing money rapidly due to leverage. 65% of retail investor accounts lose money when trading CFDs with this provider. You should consider whether you understand how CFDs work and whether you can afford to take the high risk of losing your money.
Stratos Europe Ltd (tradu.com ):
CFDs are complex instruments and come with a high risk of losing money rapidly due to leverage. 66% of retail investor accounts lose money when trading CFDs with this provider. You should consider whether you understand how CFDs work and whether you can afford to take the high risk of losing your money.
Stratos Global LLC (tradu.com ):
Losses can exceed deposits.
Please be advised that the information presented on TradingView is provided to Tradu (‘Company’, ‘we’) by a third-party provider (‘TFA Global Pte Ltd’). Please be reminded that you are solely responsible for the trading decisions on your account. There is a very high degree of risk involved in trading. Any information and/or content is intended entirely for research, educational and informational purposes only and does not constitute investment or consultation advice or investment strategy. The information is not tailored to the investment needs of any specific person and therefore does not involve a consideration of any of the investment objectives, financial situation or needs of any viewer that may receive it. Kindly also note that past performance is not a reliable indicator of future results. Actual results may differ materially from those anticipated in forward-looking or past performance statements. We assume no liability as to the accuracy or completeness of any of the information and/or content provided herein and the Company cannot be held responsible for any omission, mistake nor for any loss or damage including without limitation to any loss of profit which may arise from reliance on any information supplied by TFA Global Pte Ltd.
The speaker(s) is neither an employee, agent nor representative of Tradu and is therefore acting independently. The opinions given are their own, constitute general market commentary, and do not constitute the opinion or advice of Tradu or any form of personal or investment advice. Tradu neither endorses nor guarantees offerings of third-party speakers, nor is Tradu responsible for the content, veracity or opinions of third-party speakers, presenters or participants.


Thoughts for today...Daily Chart (wider view)
Friday's candle was a strong green close, bouncing cleanly off support (pivot 9,273 + EMAs).
Price is now pressing the upper red downtrend line, inside the broader green upward channel.
RSI (10) = ~63 → bullish momentum, not overbought yet.
Next resistance levels:
R1 = 9,334 (in play now)
R2 = 9,368
R3 = 9,430
Supports:
Pivot = 9,283
S1 = 9,259
S2 = 9,178
S3 = 9,144
30-min Intraday Chart
Price has been trending steadily higher since overnight, now consolidating above 9,310.
EMAs (10, 25, 200) are aligned bullishly (short EMAs above long ones).
RSI divergence indicator is showing no bearish divergence yet → trend remains intact.
Pivot cloud shows today’s pivot at 9,287 as solid intraday support.
Trading Ideas for Today
Bullish Bias (primary scenario)
Trend is clearly up on both daily & intraday.
A clean breakout above R1 (9,334) opens room to R2 (9,368), then possibly R3 (9,430).
Trade idea: Long above 9,335 with stop ~9,285 (below pivot support), targets 9,368 → 9,400.
Pullback Buy Opportunity
If FTSE dips toward pivot (9,283–9,287) or S1 (9,259), watch for bounce setups.
Those levels align with EMA support on intraday.
Trade idea: Buy dips near 9,285–9,260 with stop ~9,235, target back to 9,334+.
Bearish Reversal (less likely unless macro/news-driven)
Only valid if FTSE fails at R1 (9,334) and closes back below pivot (9,283).
Would shift bias to test S1 (9,259) → S2 (9,178).
Trade idea: Short below 9,280 with stop ~9,310, target 9,259 → 9,180.
✅ Key Levels to Watch Today:
Bullish breakout trigger: 9,334+ (R1)
Support buy zone: 9,285–9,259 (pivot/S1)
Bearish trigger: Below 9,280

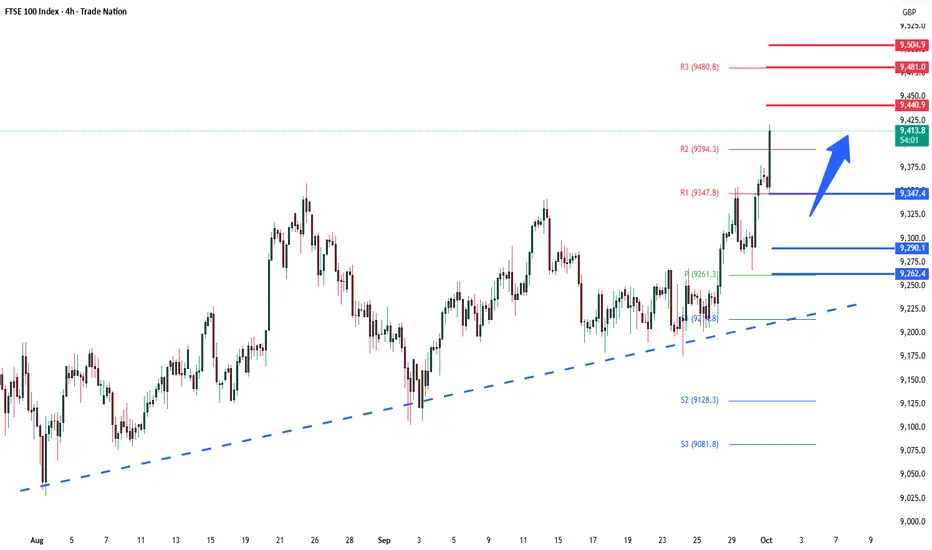
FTSE range breakout support at 9260The FTSE remains in a bullish trend, with recent price action showing signs of a breakout within the broader uptrend.
Support Zone: 9260 – a key level from previous consolidation. Price is currently testing or approaching this level.
A bullish rebound from 9260 would confirm ongoing upside momentum, with potential targets at:
9370 – initial resistance
9395 – psychological and structural level
9420 – extended resistance on the longer-term chart
Bearish Scenario:
A confirmed break and daily close below 9260 would weaken the bullish outlook and suggest deeper downside risk toward:
9240 – minor support
9214 – stronger support and potential demand zone
Outlook:
Bullish bias remains intact while the FTSE holds above 9260. A sustained break below this level could shift momentum to the downside in the short term.
This communication is for informational purposes only and should not be viewed as any form of recommendation as to a particular course of action or as investment advice. It is not intended as an offer or solicitation for the purchase or sale of any financial instrument or as an official confirmation of any transaction. Opinions, estimates and assumptions expressed herein are made as of the date of this communication and are subject to change without notice. This communication has been prepared based upon information, including market prices, data and other information, believed to be reliable; however, Trade Nation does not warrant its completeness or accuracy. All market prices and market data contained in or attached to this communication are indicative and subject to change without notice.

UK100/FTSE100 - TIME TO KILL Team, UK last ATH was 9360
It has dropped low toward 9115 and rebounded toward the range 9215-40-70 - for 2 weeks
It's time to SHORT at 9312-20 ranges with stop loss at 9345
I will ADD more at 9360 with a stop loss at 9385
Our first target at 9286-72
Next target at 9245-25
Lets GO.

UK100--LONG--Bullish reversal from the bottom of the ascending channel
--tp and entry levels are as shown on chart
