US100 REBOUND AHEAD|LONG|
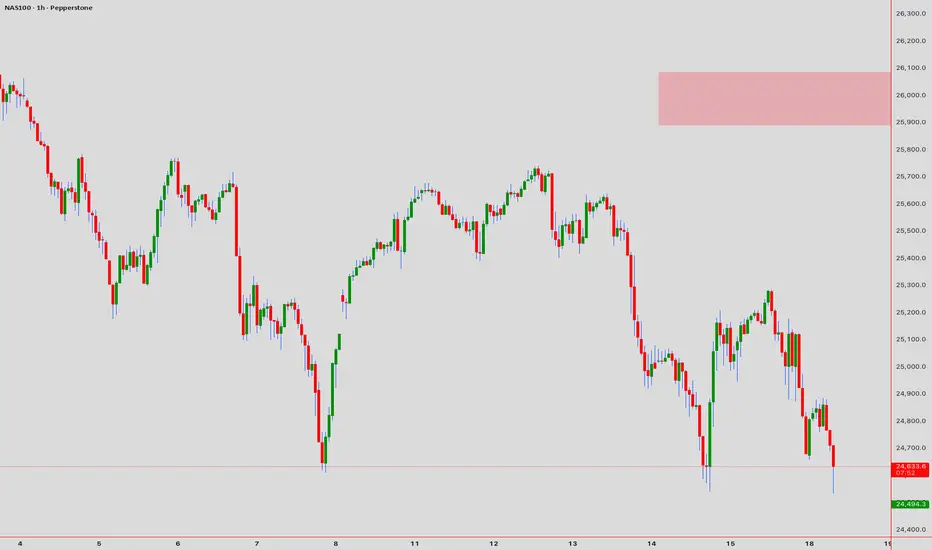
✅US100 is approaching a defined demand level where discount pricing aligns with bullish order flow. A potential rebound may deliver price toward the imbalance above. Time Frame 5H.
LONG🚀
✅Like and subscribe to never miss a new idea!✅
Trade ideas

Should Nasdaq Reversion or Continuous Bearish?
Nasdaq at Strong Support so can it reversion? It hit VAL previous Week and consolidation.
So which option does NASDAQ chose?
Take eyes on it! When it break out?
Even we have Positive Delta in Accumulation Block but Market is un-prediction!

Double zig-zag wavecountThe wavecount may be wrong, but I think we are still in wave Y. Maybe it will reach 24300 in it's final move down. Anyway it doesn't look like a reversal, this decline looks corrective.

NAS100 Trade Plan: Counter-Trend Opportunity Into Friday CloseI’m currently watching the NASDAQ NAS100 📊 and looking for a potential setup as we head into the Friday close. The market has pushed into the weekly low, and I’m anticipating the possibility of a retracement, which could offer a counter-trend opportunity during the New York session. 🚀📉📈 All details are broken down clearly in the video — this is not financial advice. ⚠️

NAS100 Trade Set Up Nov 14 2025I am expecting price to continue bearish to take out lower SSL but first i want to see a test of 1h FVG to then form internal IFVG/CISD to continue its bearish trend

NASDAQDO YOU KNOW WHATS BEHIND THIS OR OTHER IDEAS?? in bio..
Preferably suitable for scalping and accurate as long as you watch carefully the price action with the drawn areas.
With your likes and comments, you give me enough energy to provide the best analysis on an ongoing basis.
And if you needed any analysis that was not on the page, you can ask me with a comment or a personal message.
Enjoy Trading ;)

NASDAQ Pressure Still to The DownsideI know many a people are anticipating new ATHs here but I beg to differ.
I think pressure to the downside will likely resume. I am just waiting patiently to see how far up the bullish correction goes so I can continue to short. Or alternatively, a break and retest of the current H1 support if price does not pull back up.
My overall bias is still bearish here.

US100 (NASDAQ) - LONG IDEANAS hit its major support level and seems to be respecting that level, NASDAQ shifted its internal structure looking good to buy at the current price. Do your own analysis before taking any trade, this isn't a financial advise.

US100 (NASDAQ) — Daily CLS RangeUS100 (NASDAQ) — Daily CLS Range
Daily CLS ,
2nd candle is now complete, establishing the range.
On the 1H chart, a pullback into the BPR zone would provide a high-probability entry, supported by strong confluence at this level.
Target: Daily 50% midpoint at 25,287.6

Nasdaq 100 drops to a new low on the weekWhat a sell-off! The Nasdaq 100 (-2%) has now dropped almost 1,000 points from earlier high, to relinquish its entire gains related to Nvidia (-1.6%) and some to hit a new low on the week. How much more selling in there to come? Judging by price action in the crypto space, I would say a fair bit more.
By Fawad Razaqzada, market analyst with FOREX.com

US100NASDAQ ( US - 100 )
- Completed " 12345 " Impulsive Waves
- Break of Structure
- Demand Zone
- RSI - Divergence
- Order Block

NAS100 H4 | Potential bullish reversalMomentum: Bearish
The price may experience a short-term pullback toward the identified buy-entry level, which aligns with a key pullback-support zone.
Buy Entry: 24,851.44
Pullback Support
Stop Loss: 24,362.73
Multi Swing-Low Support
Take Profit: 25,774.15
Pullback Resistance
High Risk Investment Warning
Stratos Markets Limited (tradu.com ), Stratos Europe Ltd (tradu.com ):
CFDs are complex instruments and come with a high risk of losing money rapidly due to leverage. 70% of retail investor accounts lose money when trading CFDs with this provider. You should consider whether you understand how CFDs work and whether you can afford to take the high risk of losing your money.
Stratos Global LLC (tradu.com ): Losses can exceed deposits.
Please be advised that the information presented on TradingView is provided to Tradu (‘Company’, ‘we’) by a third-party provider (‘TFA Global Pte Ltd’). Please be reminded that you are solely responsible for the trading decisions on your account. Any information and/or content is intended entirely for research, educational and informational purposes only and does not constitute investment or consultation advice or investment strategy. The information is not tailored to the investment needs of any specific person and therefore does not involve a consideration of any of the investment objectives, financial situation or needs of any viewer that may receive it. Past performance is not a reliable indicator of future results. Actual results may differ materially from those anticipated in forward-looking or past performance statements. We assume no liability as to the accuracy or completeness of any of the information and/or content provided herein and the Company cannot be held responsible for any omission, mistake nor for any loss or damage including without limitation to any loss of profit which may arise from reliance on any information supplied by TFA Global Pte Ltd.

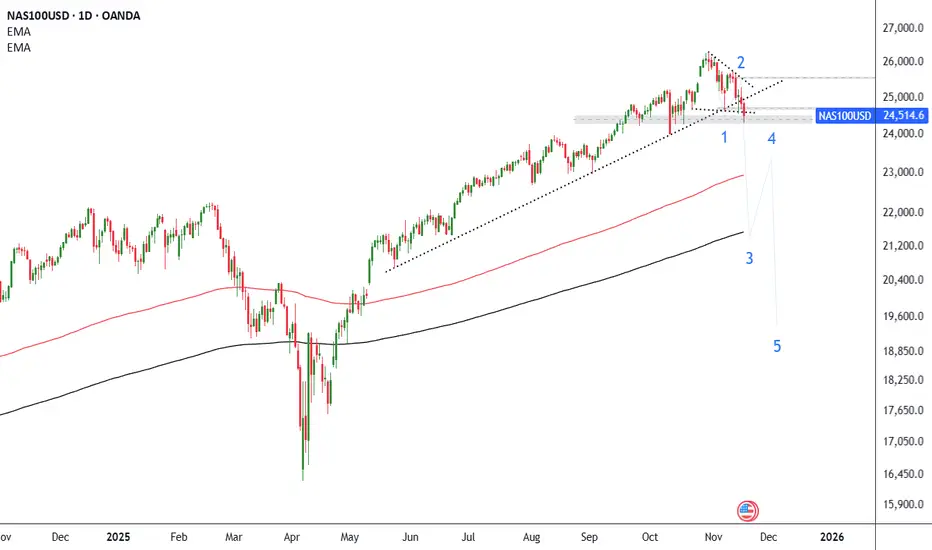
Nasdaq 100 Poised for a Deep Corrective Move After Breaking Key The Nasdaq 100 index has retreated toward a key area after a clear break below the ascending trendline that has held since mid-year, reinforcing expectations of a broader corrective wave. The current decline below the 25,000 – 24,600 zone indicates weakening bullish momentum, especially after breaking the previous low (Point 1), which supports the outlook for the index to move within a multi-leg bearish structure (five-wave decline).
The most likely scenario at this stage is a continued move lower toward the major moving averages, targeting the 22,800 – 22,200 zone as the first stage (Wave 3), followed by a limited rebound (Wave 4), before resuming the decline into Wave 5. This sequence would mark the beginning of a relatively deep correction compared to the prior bullish trend.
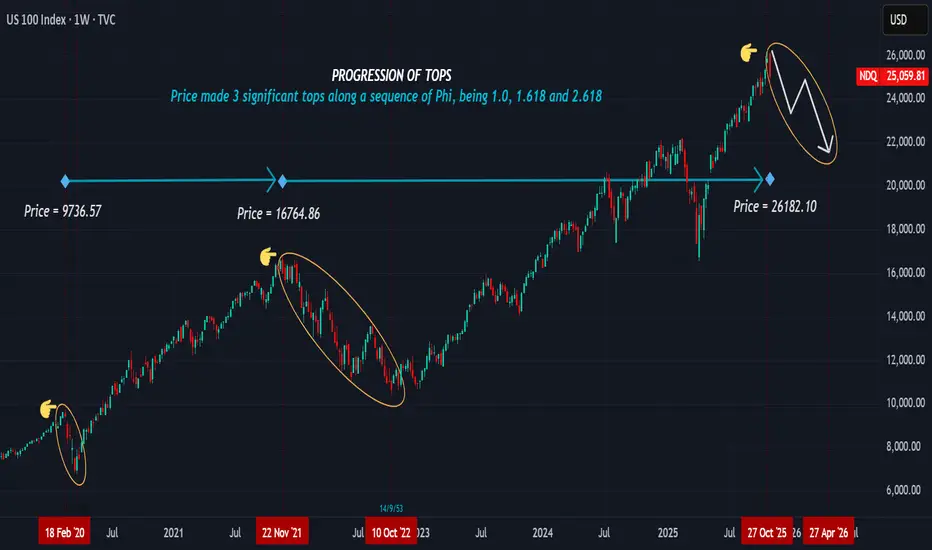
SHORT UNTIL LATE APRIL 2026OUR OBSERVATION
NASDAQ made three significant tops in its price action from 2009 to the present in a sequence of an expanding Phi.
February 2020 High = 9736.57 (This is the 1.0 growth level divided into a Log function)
(9736.57 / 10^4) = 0.973657 (Equivalent to 3/3 = 1.0)
November 2021 High = 16764.86
(16764.86 / 10^4) = 1.676486 ( This is the 5/3 Fibonacci sequence or a variation of 1.618)
Current High at 27th October 2025 = 26182.10
(26182.10 / 10^4) = 2.618210 (This level indicates the 8/3 growth sequence or 2.618 level)
TRADE PLAN
If we project a sequence of thirds, (1/3, 2/3, 3/3), then the three tops from 2009 made an expanding sequence along 3/3, 5/3, and 8/3 nodal points , at 9736.57, 16764.86 and 26182.10 levels respectively. Each node effected a correction, and by projection, we expect price to correct steadily until late April 2026. (1,2,3,5,8...) points form the price tops. The zone between 26182.1 and 26880.XX will be our confluence zone to expect a decline.
We projected the 27th October top as far back as April 2025, where we mentioned a broader cross assets decline. If we compare NASDAQ's price to SP-500 and DJIA, then we can create a larger sequence pattern. SP-500 top reached 6920.34 being 2/3 on the sequence while DJIA reached 48040.64, the 13/3 node. Several markets reaching tops at the same time cooks a sharp long decline. Therefore, we will keep short entries for all three markets until the tops break.
NOTE: We do not trade news effects, we only trade measurable facts the charts indicate. However, we look to the news for signals that add strength to our expectations.
Trade safe, good luck

NDXNDX has been moving within this upward channel since June...if it is still respected...it should bounce from here...

nasdaq buyhi evryone the nasdaq index can rise to the specifed target. please don't forget capital managment

NAS100 Intraday Market Structure AssessmentActionable Trading Framework
Bullish Scenario (Probability: 60%)
Entry: 24,595-24,620 (consolidation breach confirmation)
Target 1:24,680 (+$62 risk/reward)
Target 2: 24,750 (+$132 profit extension)
Stop Loss: 24,550 (-$45)
Trigger: Break above 24,650 with volume confirmation on 5/15-min charts
Bearish Scenario (Probability: 40%)
Entry: 24,680-24,710 (rejection candle formation)
Target 1: 24,600 (-$80 to +$30 range)
Target 2: 24,520 (-$160 reversal)
Stop Loss: 24,760 (+$50)
Trigger: Failed breakout attempt + RSI divergence on 1-hour chart
Key Technical Confluences
✓ EMA 20/50 Crossover Zone → Dynamic support (1-hour timeframe)
✓ VWAP Alignment → Acts as pivot point at 24,635
✓ Harmonic Pattern → Potential bullish AB=CD completion near current zone
✓ Ichimoku Tenkan-sen → Resistance pressure at 24,705
Execution Rules
1. Entry Confirmation: Engulfing or Pin Bar + Volume Spike on 5-min chart
2. Risk Management: Maximum risk per trade = 1% account size
3. Time Window: Optimal trading 08:00-15:00 UTC+4 (high liquidity period)
4. Exit Protocol: Trail stop at 15-pips after Target 1 achievement
Market Watch: NASDAQ at a Critical JunctureToday, all eyes are on the NASDAQ as we head into a key earnings release. The index is approaching a pivotal short-term level — the 55-day moving average at 24,091, which aligns closely with the August high of 23,969. With the daily RSI nearing oversold territory around 30, there's a strong chance this level could hold on the initial test.
But here's the catch: the weekly chart is flashing warning signs.
🔍 The weekly RSI has already topped out, suggesting momentum is fading. If the 55-day MA doesn't hold, we could see a deeper pullback toward the 55-week moving average at 22,035, which also aligns with the late 2024 high of 22,222.
This level could be the litmus test for the broader bull trend. A weekly close below it would be a major technical breakdown — and let’s not forget, the NASDAQ often leads the S&P.
Stay sharp. The next few sessions could be decisive.
Not trading advice

Nasdaq Short: Peak Confirmed; Bear Market ConfirmedIt is now clear that the bull market ended on 30th Oct and that we have already seen the first completed wave down for Nasdaq that unfolded in clear 5-wave structure. The sub-waves also showed clear 5-wave structure themselves.
We are currently in a wave 2 retracement that is facing the first real support-turned-resistance. However, take note that wave 2 can technically go all the way up to the start of wave 1 without invalidating the idea. So look out for reversal signal or confirmation before you short.

NAS100 Bullish Setup on 1hrNAS100 Bullish Setup on 1hr
Bullish Setup presented on 1hr
- Bullish divergence
- 1hr FVG created in this crazy sell off
- 1hr unfinished candle at my TP level
Entry: 24160
TP: 25000
SL: 23980
RR: 1:5.71

Nasdaq slides down as markets wobbleNasdaq is being pushed down, driven by raising concerns about valuations of AI companies despite strong earnings from NVDA and other giants. Volatility (VIX) stays near 20 but the hard landing for Nasdaq might boost it and lead to another several days of bearish rally as shown at the chart. According to statistical studies, bearish swings for Nasdaq rarely last for more than 19-20 days, so if it continues to move down, it might reverse in 5-10 days at the statistic support level, as shown at the chart.
Don't forget - this is just the idea, always do your own reserch and never forget to manage your risk!

USNAS1OO Appear Breakout phase, with bullish pressure building.The USNAS100 (NASDAQ 100) appears to be in a consolidation-to-breakout phase, with bullish pressure building.
U.S. stock index futures are advancing on Monday following positive developments in Washington toward ending the U.S. government shutdown the prolonged shutdown had delayed key economic data releases and increased uncertainty over growth. Renewed optimism for resolution has improved risk sentiment, prompting buying momentum in equity futures.
If price sustains above 25,000 and momentum continues, bulls could “shut down” the recent NASDAQ decline by pushing toward 25,750 – 26,005 a strong breakout with volume could trigger further upside toward 26,250–26,500, aligning with the next major resistance zone.
You may find more details in the chart,
Trade wisely best of Luck Buddies.
Ps; Support with like and comments for better analysis Thanks for Supporting.
